
Continuous Authentication based on Hand Micro-movement during
Smartphone Form Filling by Seated Human Subjects
Aratrika Ray
1
, Daqing Hou
1
, Stephanie Schuckers
1
and Abbie Barbir
2
1
Department of Electrical and Computer Engineering, Clarkson University, Potsdam, New York, U.S.A.
2
Mobile Security Group, CVS Health, U.S.A.
Keywords:
Behavioral Biometrics, Continuous Authentication, Android Smartphones, Acceleration, Angular Velocity,
Support Vector Machine, Weighted Score Fusion, Likelihood Ratio-based Score Fusion.
Abstract:
Mobile devices typically rely on entry-point and other one-time authentication mechanisms such as a pass-
word, PIN, fingerprint, iris, or face. But these authentication types are prone to a wide attack vector and worse
still, once compromised, fail to protect the user’s account and data. In contrast, continuous authentication,
based on traits of human behavior, can offer additional security measures in the device to authenticate against
unauthorized users, even after the entry-point and one-time authentication has been compromised. To this
end, we have collected a new data-set of multiple behavioral biometric modalities (49 users) when a user fills
out an account recovery form in sitting using an Android app. These include motion events (acceleration and
angular velocity), touch and swipe events, keystrokes, and pattern tracing. In this paper, we focus on authenti-
cation based on motion events by evaluating a set of score level fusion techniques to authenticate users based
on the acceleration and angular velocity data. The best EERs of 2.4% and 6.9% for intra- and inter-session
respectively, are achieved by fusing acceleration and angular velocity using Nandakumar et al.’s likelihood
ratio (LR) based score fusion.
1 INTRODUCTION
Currently smartphones are predominantly protected
through one-time authentication mechanisms such as
password, PIN, patterned password, and fingerprint
scanning. These one-time mechanisms are prone to
a wide vector of security attacks. For example, PINs
and passwords can be guessed and social engineered,
a patterned password is prone to smudge attacks, and
fingerprint scanning is prone to spoof attacks. Other
forms of attacks include video capture and shoul-
der surfing. Given the increasingly important roles
smartphones play in e-commerce and other opera-
tions where security is crucial, there lies a strong need
of continuous authentication mechanisms to comple-
ment and enhance one-time authentication such that
even if the authentication at the point of login gets
compromised, the device is still unobtrusively pro-
tected by additional security measures in a continuous
fashion.
The research community has investigated sev-
eral continuous authentication mechanisms based on
unique human behavioral traits, including typing,
swiping, and gait. To this end, we focus on inves-
tigating the performance of acceleration and angular
velocity of a smartphone for continuous authentica-
tion. Our data is collected from 49 users in two visits
when they sit in a laboratory to fill out an account re-
covery form on Android phones. The present study
is motivated by observations over two broad groups
of factors that we believe can uniquely identify in-
dividuals, namely, postural preferences and physio-
logical traits. While interacting with hand-held de-
vices, individuals strive to achieve stability and pre-
cision. This is because a certain degree of stability is
required in order to manipulate and interact success-
fully with smartphones, while precision is needed for
tasks such as touching or tapping a small target on
the touch screen (Sitov
´
a et al., 2015). As a result,
to achieve stability and precision, individuals tend to
develop their own postural preferences, such as hold-
ing a phone with one or both hands, supporting hands
on the sides of upper torso and interacting, keeping
the phone on the table and typing with the preferred
finger, setting the phone on knees while sitting cross-
legged and typing, supporting both elbows on chair
handles and typing. On the other hand, physiological
traits, such as hand-size, grip strength, muscles, age,
424
Ray, A., Hou, D., Schuckers, S. and Barbir, A.
Continuous Authentication based on Hand Micro-movement during Smartphone Form Filling by Seated Human Subjects.
DOI: 10.5220/0010225804240431
In Proceedings of the 7th International Conference on Information Systems Security and Privacy (ICISSP 2021), pages 424-431
ISBN: 978-989-758-491-6
Copyright
c
2021 by SCITEPRESS – Science and Technology Publications, Lda. All rights reserved

gender and others (Kim et al., 2006), can also affect a
user’s behavior when interacting with a smartphone.
In general both postural preferences and physiolog-
ical traits can contribute towards unique behavioral
characteristics of individuals.
In our study, 49 users sit and fill out an Android
account recovery form with their personal informa-
tion to simulate the familiar password resetting sce-
nario. We hypothesize that such human-phone inter-
actions can be unique to individuals and be measured
for authentication purpose by phone sensors like ac-
celerometer and gyroscope. Therefore in this work
we have made the following contributions:
(1) A Novel User-behavior Data-set Involving Fill-
ing Out an Account Recovery Form While Sitting.
The state of the art has studied user behavior of
answering questions on phones while sitting (Kumar
et al., 2016) and walking (Sitov
´
a et al., 2015), move-
ment patterns in different contexts (e.g., swipe, type,
talk while sitting, standing, walking, in an elevator,
in a moving bus, train, or in a car), picking up a
phone (Feng et al., 2013), and hand-waving (Hong
et al., 2015). Behavior authentication during form
filling is also a common and important activity that
warrants further study.
(2) Fusion of Multiple Readings Both within
and across the Acceleration and Angular Velocity
Modalities.
Since our initial SVM-based binary classification
using individual readings for each modality does not
produce good performance, we focus on fusing mul-
tiple readings both within (in case of independent ac-
celeration and angular velocity) and across modalities
(both acceleration and angular velocity). However,
fusing the two motion events (across the modalities)
significantly enhances the performance, in both intra-
and inter-session experiments. Overall, our score
level fusion using Nandakumar et al.’s likelihood ratio
produces the best EERs of 2.4% and 6.9%, respec-
tively, among all the intra-session and inter-session
experiments.
The rest of this paper is organized as follows. Sec-
tion 2 presents related work. Section 3 describes the
data collection procedure. Section 4 reports all the
experiments, results, and analyses. Lastly, Section 5
concludes our study and discusses future works.
2 RELATED WORK
Lee and Lee (Lee and Lee, 2015) investigates combi-
nation of accelerometer, gyroscope and magnetome-
ter data for authentication. Using two data-sets of four
subjects and feature fusion using SVM,they conclude
that both higher sampling rates and fusion increase
performance, with accuracy ranging between 58.3%
and 97.4%.
In a preliminary work with 20 users in sitting (Lin
et al., 2012), Lin et al. demonstrate that different sub-
set of orientation features can be selected per user and
per vertical and horizontal flicks, accomplishing an
EER as good as 6.85% based on a majority vote of
seven readings using kNN.
Feng, Zhao, and Shi (Feng et al., 2013) authen-
ticates users based on phone picking up as a novel
biometric modality. Using data from accelerometer,
gyroscope, and magnetometer sensors of 31 users, a
best EER of 6.13% is achieved for the inter session
and stationary condition.
Hong et al. (Hong et al., 2015) investigates hand-
waving patterns as a biometric modality for phone
screen unlocking. Based on a dataset from 200 users
and SVM, they obtain an average false positive rate of
15% and an average false negative rate of 8%.
Fusion can be done at different levels/stages of the
authentication process, including sensor level, fea-
ture level, score level, and rank and decision level
are broadly discussed in (Ross et al., 2008). Giuf-
frida et al. (Giuffrida et al., 2014) investigates the
fusion of password keystroke dynamics with motion
events. Jain and Kanhangad (Jain and Kanhangad,
2015) performs score level fusion of swipe and touch
related gestures with the motion data from phone’s
accelerometer and gyroscope sensors.
Sitova et al. (Sitov
´
a et al., 2015) studied the phone
movement patterns as hand-movements, orientation
and grasp (HMOG) under two specific conditions:
walking and sitting. They showed that the phone
movement patterns while typing achieved EERs of
19.67% and 13.62% respectively under the sitting and
walking conditions. The fusion of typing patterns
with HMOG achieved EERs of 7.16% and 10.05%
respectively for walking and sitting conditions.
Kumar, Phoha, and Serwadda (Kumar et al., 2016)
investigates the fusion of phone movement patterns
(acceleration) with typing and swiping when a user
uses a web browser in sitting, achieving an accu-
racy of 93.33% for a feature fusion of movement and
swipes, and 89.31% for a score fusion of movement
and typing. We focus instead on fusion of accelera-
tion and angular velocity.
Gait-based authentication uses acceleration from
smartphones during walking or similar movements.
Derawi et al. (Derawi et al., 2010) seems to be the first
work in this area. By applying Dynamic Time Warp-
ing (DTW) over data from 51 users during normal
walk on flat ground, they obtain an EER of 20.1%.
Kwapisz, Weiss, and Moore (Kwapisz et al.,
Continuous Authentication based on Hand Micro-movement during Smartphone Form Filling by Seated Human Subjects
425

Figure 1: User interface of our Android logging app where our user simulates the account recovery process by filling out
a form with personal information such as name/phone/address to reclaim an account, performing fingerprint scanning, and
tracing geometrical patterns. Keystrokes, acceleration and angular velocity, and swipe and touch data were logged throughout
the process.
2010) performs a binary classification based study
over acceleration data from 36 users in three gait ac-
tivities (walking, jogging, and climbing stairs) and
shows that user authentication is impacted signifi-
cantly by the gait activities.
Our user behavior during the data collection pro-
cess involves static scenario where a user sits and
fills out an Android account recovery form. Our au-
thentication is based on analysis of motion-event data
(both acceleration and angular velocity) to capture the
user’s hand micro-movements during the process.
3 DATA COLLECTION
3.1 Collection Procedure
After approval from the University Institutional Re-
view Board (IRB), official announcements were made
through university email for advertising our data col-
lection process. In total we could recruit 49 subjects,
which included both students and staff. There were 17
participants in the 18-20 age group, 9 participants of
age 21-25, 12 participants of age 26-30, 5 participants
from age group 30-35, and 6 participants of 35 years
of age or older. 23 out of the 49 subjects were female
and 26 male participants, which is an approximately
equal ratio across the two genders.
Each user was scheduled to visit us twice. During
the visits, our subjects simulate the typical account re-
covery process using an Android app on smartphones
provided by us (Figure 1). In the first visit, a subject
is asked to use our Android app to fill out an account
recovery form 10 times with their own personal infor-
mation. In the second visit, the subject is required to
use our app for 15 times; the subject first enters their
own information 5 times, and for the other 10 times,
the subject attacks five other users by entering their in-
formation each twice. We provided our subjects with
Android smartphones (one of each Samsung Galaxy
S8, Samsung Galaxy Note 9, and Motorola X4). In
the end, all 49 subjects completed visit 1 as required,
but only 15 fully completed visit 2.
We observed that in general users hold the mobile
phone with both hands and type. They either support
their hands on a table kept in front of them or they
support their hands on their upper torso. In general,
every individual has manifested a conscious psycho-
logical trait.
3.2 Account Recovery Android App
Our data collection was designed to maximize the
kinds of research problems we can study in future
with the data. As shown in Figure 1, users interact
and fill out the account recovery form with their cre-
dentials. They also use the fingerprint scanner when
the logger prompts the user and in the end users are
asked to trace several geometrical shapes. Through
the above user interactions, the Android logger cap-
tures keystrokes, on-touch events (taps, double taps,
long-presses, and swipes), motion events (accelera-
tion and angular velocity), motion events during fin-
gerprint scanning, and strokes from pattern tracing
ICISSP 2021 - 7th International Conference on Information Systems Security and Privacy
426
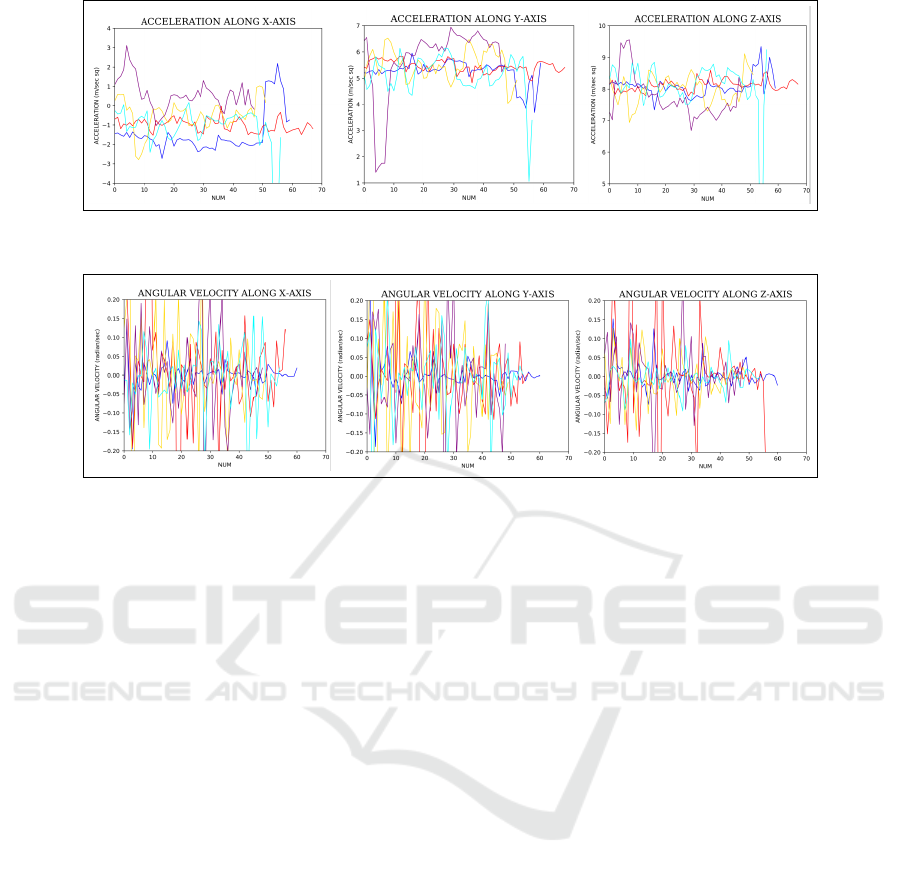
Figure 2: Acceleration data of 5 random users: left- acceleration along x-axis, center- acceleration along y-axis, right- accel-
eration along z-axis.
Figure 3: Angular velocity data of 5 random users: left- angular velocity along x-axis, center- angular velocity along y-axis,
right- angular velocity along z-axis.
through guided behavior. These events are logged us-
ing event listeners provided by the Android API. We
have used a sampling interval of 0.5 second, which
is consistent with other research (Deb et al., 2019).
Therefore, two data points per second get logged from
each sensor. The motion events collected during nor-
mal form filling and during fingerprint scanning are
separated. Our data is stored in the phone’s internal
SQLite3 database during the visit and copied to a se-
cured server after each visit. We have plotted the ac-
celeration and angular velocity data of 5 random users
to visualize the data, in Figure 2 and Figure 3, respec-
tively. As shown, both kinds of data can be used to
separate users.
4 EXPERIMENTAL DESIGN AND
RESULTS
4.1 Design Overview
We first evaluate the authentication performance of
acceleration and angular velocity as an independent
modality by training one SVM binary classifier per
user. Because these classifiers are based on individ-
ual data samples, not surprisingly they have not pro-
duced strong performance. We therefore focus on
improving the performance by performing score fu-
sion both within and across the two modalities of
acceleration and angular velocity. In particular, we
have performed two types of score fusion experi-
ments, namely, the weighted sum and Nandakumar
et al.’s likelihood ratio based score fusion (Nandaku-
mar et al., 2007). Moreover, we have performed both
intra-session (where training, validation, and testing
are done with data from the first visit) and inter-
session (where training and validation are done with
the first visit data and the second visit data is tested)
experiments.
In all fusion experiments, we have utilized a slid-
ing window strategy to specify the range of readings
needed to make each authentication decision. The
sliding window is defined by two parameters, k and
n, where k is the the number of consecutive rows of
readings included in the window, and n is the number
of rows by which the sliding window moves forward
to formulate the input for the next decision. Each au-
thentication decision is made by fusing k consecutive
score outputs from the basic binary classifiers.
Each user’s data is partitioned into three por-
tions for training, validation, and testing, respectively,
where validation is used to determine the optimal slid-
ing window size, k, and the step size, n, that produces
the best EER. During testing, we use the same k and n
obtained from the validation step to calculate the EER
for the user. We repeat the same fusion process for all
the users and calculate the average EER as an estima-
tion of the overall performance of the system. In our
experiments, we let k range from 5 to 150 (with a step
Continuous Authentication based on Hand Micro-movement during Smartphone Form Filling by Seated Human Subjects
427

size of 5) and a set of values of n = 5, 10 to 140 (with
a step size of 10). A k value of 150 amounts to 75
seconds of data, which is an average time for a user
to fill out the account recovery form completely for
once. The value of n is always less than or equal to
k. For the intra-session experiments, we use 40% of a
user’s visit 1 data for training, 40% for validation, and
20% for testing. We have performed cross validation,
where each user’s data is partitioned into five equal
portions and then in each combination the five por-
tions are distributed as training, validation, and test-
ing data. This results in 10 combinations. The overall
performance is measured by taking the average across
all the 10 combinations.
For the inter-session experiments, we use 40% and
60% of a user’s visit 1 data for training and validation,
and the entire visit 2 data for testing. Therefore, we
performed cross-validation by shuffling the training
and the validation portions of the visit 1 data, which
results in 10 combinations. The overall performance
is measured by taking the average across all the 10
combinations.
The results of all of our experiments are compiled
in Table 1, where we have reported the descriptive
statistics (average, median, minimum, maximum, and
standard deviation) for EERs, sliding window (k,n),
numbers of Gaussian components for GMM (K), and
weights (W
a
,W
g
), across all the users.
4.2 Features and SVM Configuration
We have used the following features for acceleration:
acceleration along x, y, z- axes and the resultant ac-
celeration, and for angular velocity: rate of rotation
along x, y, z- axes and the resultant of angular veloc-
ity. The unit of acceleration data is meter/second
2
.
The unit of angular velocity data is radian/second.
The resultant or magnitude of the motion-event (ac-
celeration or angular velocity) is defined as the square
root of the sum of the squares of the motion-events
along x, y, and z axes:
resultant =
p
x
2
+ y
2
+ z
2
In general, we train one binary classifier per user.
The min/max/median numbers of data points for all
49 users are 903/4756/2477 and 837/2551/1270 for
acceleration and angular velocity, respectively. The
intra-session experiments make use of the motion data
from visit 1 only, where the data from the user are
used as genuine samples and data from all the other
48 users are used as imposters. In all experiments,
training data are properly balanced by up-sampling
the genuine samples.
We use the SVM implementation from Python
sklearn, with gamma set as auto, a value of 100 for
the parameter C, and RBF (Radial Basis Function)
as kernel. There are two SVMs per user, one for
each of acceleration and angular velocity. We have
also fused both within and across the modalities. We
measure the performance of the fused classifiers us-
ing Receiver Operating Characteristic (ROC) curves
and report Equal Error Rates (EER). We compute the
pair-wise correlation between acceleration and angu-
lar velocity features. The correlation coefficients do
not show any substantial correlation between any two
features, which is an ideal precondition for fusion.
4.3 Within-modality Score Level Fusion
4.3.1 Score Fusion of Acceleration
This experiment is about authentication using only ac-
celeration data. Recall that the features extracted for
this modality are acceleration along x, y, and z axes,
and the resultant acceleration. Based on the accel-
eration data, we train one binary classifier per user
and measure the performance of the classifier using
the ROC curve. To improve performance, we apply a
score level fusion to each user by averaging the dis-
tance scores of k consecutive acceleration readings
(scores) from the binary classifier. During the vali-
dation step, we decide the values of k and n that yield
the best EER. At testing, we use the same k and n
obtained from validation to calculate the EER for the
user. We repeat the same fusion process for all the
49 users and calculate the average across all the 49
EERs as an estimation of the overall performance of
the system. As shown in Table 1, the average EERs
obtained in this experiment are 20.5% in intra-session
and 8.4% in inter-session.
4.3.2 Score Fusion of Angular Velocity
This experiment uses only the angular velocity data
from gyroscope for authentication. Features extracted
include angular velocity along x, y, z axes, and the re-
sultant angular velocity. Again, similar to the acceler-
ation modality, we train one binary classifier per user,
based on the angular velocity data and measure the
performance of the classifier using the ROC curve.
Given that in our case a user sits and fills out an
account recovery form on Android phones, they stay
mostly static and there is not much somatic move-
ments involved during data collection. Therefore, we
hypothesize that the angular velocity data is skewed
toward the 0 value, which might bias the classifiers.
Visualizations of angular velocity data over multiple
small time intervals confirm this. Therefore we decide
ICISSP 2021 - 7th International Conference on Information Systems Security and Privacy
428

Table 1: Summary of Experiments and Performance Results (k,n: width and step size of sliding window; K: number of
Gaussian components for GMM; and W
a
,W
g
: weights for weighted sum score fusion).
Intra-session Inter-session
Experiment avg/med/min/max/std avg/med/min/max/std
Within-modality
Score fusion EER-20.5/20.2/3/35/7 EER-8.4/4.1/0/31/10.8
of acceleration k-122/123/94/143/11 k-89/92/17/124/32
(Section 4.3.1) n-105/105/85/132/11 n-83/88/11/121/31
of angular velocity EER-18.3/19.9/0/34.6/9.6 EER-8.5/5.7/0/34.9/10.9
(Section 4.3.2) k-120/122/41/146/18 k-99/112/17/127/31
n-104/105/41/131/16 n-91/102/11/123/30
Cross-modality
Weighted score fusion EER-8.3/8/0/28/5.6 EER-7.9/0.8/0/34.5/11.5
k-90/94/27/127/22 k-73/77/16/117/30
(Section 4.4.1) n-82/86/25/121/20 n-67/75/11/103/28
W
a
-0.6/0.5/0.2/0.9/0.2 W
a
-0.5/0.5/0.1/0.8/0.1
W
g
-0.4/0.5/0.1/0.8/0.2 W
g
-0.4/0.4/0.1/0.8/0.1
Likelihood ratio based EER-2.4/0.9/0/15.3/3.3 EER-6.9/2/0/33.4/10.1
score fusion k-80/82/12/120/25 k-80/73/16/134/31
(Section 4.4.2) n-73/77/9/112/24 n-71/64/11/110/28
K-3/2/2/10/2 K-3/3/2/7/2
to experiment with thresholding the data to improve
authentication performance. Specifically, we take the
10th percentile value of all the magnitudes of angular
velocity data as a threshold, which turns out to be 0.05
radian/sec, and eliminate all data points of which the
magnitude is less than the chosen threshold. As a re-
sult, the remaining angular velocity data for all users
shows a magnitude between 0.05 and 5 radian/second.
The same score level fusion as for acceleration is
applied to angular velocity. As shown in Table 1, with
the threshold of 0.05 rad/sec, the average EER for all
49 users for the score level fusion is 18.3%. The inter-
session experiment taking 15 users produced an EER
of 8.5% in this experiment.
4.4 Cross-modality Score Level Fusion
4.4.1 Weighted Score Fusion
This score level fusion experiment makes use of ac-
celeration and angular velocity events occurring at a
common time instant. Once they are classified using
their respective SVMs, we compute the weighted sum
of the average of the k distance scores generated from
the two SVMs as a new score (Nandakumar et al.,
2007). So, in addition to k and n, the validation step
also selects the pair of weights (for acceleration and
angular velocity) that yields the best EER for the user.
Therefore, the pair of weights is user-specific. The
weights range from 0 to 1.0 with a step size of 0.1,
and always add up to 1. The validated k, n, and pair
of weights are then used in testing.
As shown in Table 1, the average EERs for the
intra-session and inter-session experiments are 8.3%
and 7.9% respectively. Recall that the best EERs of
acceleration and angular velocity as uni-modality are
20.5% and 18.3%, respectively, in the intra-session
experiments. So the 8.3% EER from this intra-session
score fusion of two modalities represents a noticeable
improvement.
4.4.2 Likelihood-ratio based Score Fusion
This experiment applies Nandakumar et al.’s like-
lihood ratio based score level fusion (Nandakumar
et al., 2007). We then take the 2-dimensional vectors
of match scores of acceleration and angular velocity
from their respective classifiers and create genuine
and impostor distributions. The genuine and impos-
tor distributions are estimated as Gaussian Mixture
Models (GMMs). The likelihood ratio (LR), which
is defined as the ratio of the genuine distribution to
the impostor distribution, is then used as a new match
score for a test sample:
LR =
ˆ
f
gen
(x)/
ˆ
f
imp
(x)
where
ˆ
f
gen
(x) and
ˆ
f
imp
(x) are the estimated genuine
and impostor density functions, respectively, and x is
a 2 dimensional vector of match scores of acceleration
and angular velocity. The calculated LR is used as a
match score for identifying a genuine user.
During validation, for each user we validate the
optimal combination of k, n, and the number of Gaus-
sian components (K) that produce the best EER for
the user. Hence, the number of Gaussian components
Continuous Authentication based on Hand Micro-movement during Smartphone Form Filling by Seated Human Subjects
429
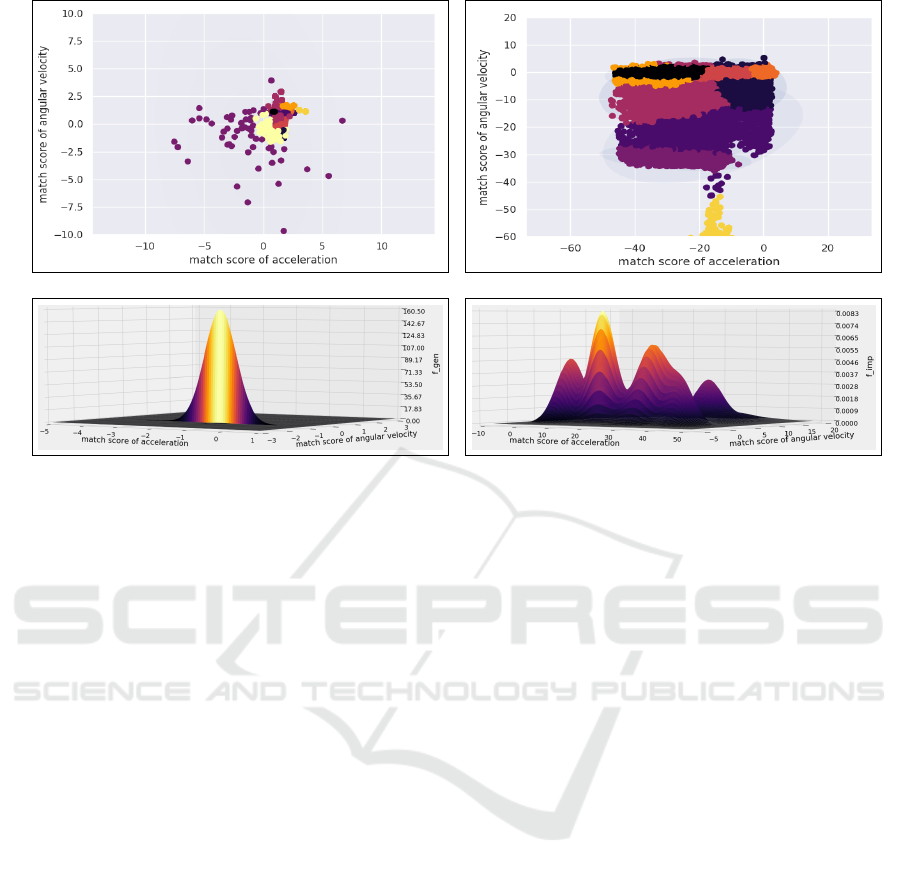
(a) (b)
(c) (d)
Figure 4: Density estimation based on Gaussian Mixture Models for the motion event data from our mobile logger. (a) Scatter
plot of genuine scores along with 10 fitted mixture components shown in different colors, (b) scatter plot of impostor scores
along with 10 fitted mixture components in different colors, (c) density estimate of genuine scores, (d) density estimate of
impostor scores. Number of mixture components for both genuine and impostor densities in this example is 10.
is user-specific, which ranges from 2 to 18 (with a step
size of 2). We then use the validated k, n, and compo-
nent number (K) in testing. By taking the mean of k
likelihood ratios as a final match score, we calculate
an EER for each user.
As shown in Table 1, the average EER of all 49
users is 2.4%, which is the best among all intra-
session, cross-modality fusion experiments. Lastly,
the inter-session EER for this experiment is increased
to 6.9%, which is also the best performance among all
the inter-session experiments.
The genuine and impostor distributions are mod-
eled as a mixture of Gaussian components using
Gaussian Mixture Model (GMM).
The genuine distribution is defined as:
ˆ
f
gen
(x) =
∑
M
gen
j=1
P
gen, j
φ
K
(x;µ
gen, j
,Σ
gen, j
)
and the impostor distribution is defined as:
ˆ
f
imp
(x) =
∑
M
imp
j=1
P
imp, j
φ
K
(x;µ
imp, j
,Σ
imp, j
)
Note that φ
K
is a K-variate Gaussian density func-
tion with mean µ, and covariance matrix Σ:
φ
K
(x;µ,Σ) =
(2π)
−K/2
|Σ|
−1/2
exp(−1/2(x − µ)
T
Σ
−1
(x − µ))
M
gen
(M
imp
) is the number of mixture components
used to model the density of the genuine (impostor)
scores. P
gen, j
(P
imp, j
) is the weight assigned to the j
th
mixture component in
ˆ
f
gen
(x) (
ˆ
f
imp
(x)). The weights
assigned to the j-components must sum up to one:
∑
M
gen
j=1
P
gen, j
= 1 and
∑
M
imp
j=1
P
imp, j
= 1
µ
gen, j
(µ
imp, j
) and Σ
gen, j
(Σ
imp, j
) are the mean and co-
variance matrix of the jth Gaussian, respectively.
Our experiment chooses from 2 to 18 components
to identify GMMs that produce the best performance.
Figure 4 depicts the scatter plots of genuine and im-
postor scores as well as the estimated density func-
tions for both genuine and impostor scores for a par-
ticular user that achieves the best performance with
GMMs of 10 Gaussian components for both modali-
ties. Note that the genuine scores and imposter scores
lie in different regions in the scatter plots. Figure 4c
shows the 10-component GMM estimated from the
genuine scores. Note that this distribution peaks at
a value around 160 but there are also several smaller
peaks that are not visible in this graph. On the other
hand, there are more visible components in the im-
postor score distribution shown in Figure 4d.
5 CONCLUSION AND FUTURE
WORK
We evaluate the potential of using motion events (ac-
celeration and angular velocity) generated during a
common activity when a smartphone user is filling out
a form in sitting, to continuously authenticate the user.
Using a new data-set collected from 49 users when
ICISSP 2021 - 7th International Conference on Information Systems Security and Privacy
430

they fill out an account recovery form on Android
phones while sitting in a laboratory, we have per-
formed score-level fusion experiments, of two types,
namely, weighted score fusion and the likelihood ra-
tio based score fusion. In addition, we have also per-
formed both intra- and inter-session experiments.
By fusing both modalities, the likelihood ratio
based score fusion performs the best in both intra- and
inter-sessions, between the two score fusion strate-
gies, with EERs of 2.4% and 6.9%, respectively. An
average sliding window width of 80 for the best-
performing likelihood ratio approach is equivalent to
40 seconds of data per decision.
As shown in Table 1, in the score fusion of ac-
celeration experiment and score fusion of angular ve-
locity experiment, the average and the median EERs
are very close, which shows that the data is evenly
distributed. The standard deviation implies that the
EERs do not vary much among the users. Over-
all, the cross-modality fusion outperforms the within-
modality and the likelihood ratio based score fusion
performs the best in all experiments. Lastly, it is no-
ticed that in the score fusion experiments, the k and n
parameters of the sliding window are typically high.
Based on our sampling rate of 2 Hz, these would
amount to less than 2 minutes of data per authenti-
cation decision.
Our future work will include replicating this study
on other public data-sets to increase the reliability of
the reported performance. It will also be worthwhile
to investigate the fusion of motion events with other
modalities such as typing and swiping to identify the
optimal combination of multi-modalities while con-
sidering user experiences and usability.
ACKNOWLEDGEMENTS
This material is based upon work supported by
the Center for Identification Technology Research
(CITeR) and the National Science Foundation under
Grant No.1650503.
REFERENCES
Deb, D., Ross, A., Jain, A. K., Prakah-Asante, K., and
Prasad, K. V. (2019). Actions speak louder than (pass)
words: Passive authentication of smartphone* users
via deep temporal features. In 2019 International
Conference on Biometrics (ICB), pages 1–8. IEEE.
Derawi, M. O., Nickel, C., Bours, P., and Busch, C. (2010).
Unobtrusive user-authentication on mobile phones us-
ing biometric gait recognition. In 2010 Sixth Interna-
tional Conference on Intelligent Information Hiding
and Multimedia Signal Processing, pages 306–311.
IEEE.
Feng, T., Zhao, X., and Shi, W. (2013). Investigating mo-
bile device picking-up motion as a novel biometric
modality. In 2013 IEEE Sixth International Confer-
ence on Biometrics: Theory, Applications and Systems
(BTAS), pages 1–6. IEEE.
Giuffrida, C., Majdanik, K., Conti, M., and Bos, H. (2014).
I sensed it was you: authenticating mobile users with
sensor-enhanced keystroke dynamics. In Interna-
tional Conference on Detection of Intrusions and Mal-
ware, and Vulnerability Assessment, pages 92–111.
Springer.
Hong, F., Wei, M., You, S., Feng, Y., and Guo, Z. (2015).
Waving authentication: your smartphone authenticate
you on motion gesture. In Proceedings of the 33rd An-
nual ACM Conference Extended Abstracts on Human
Factors in Computing Systems, pages 263–266.
Jain, A. and Kanhangad, V. (2015). Exploring orientation
and accelerometer sensor data for personal authentica-
tion in smartphones using touchscreen gestures. Pat-
tern recognition letters, 68:351–360.
Kim, K.-E., Chang, W., Cho, S.-J., Shim, J., Lee, H., Park,
J., Lee, Y., Kim, S., et al. (2006). Hand grip pattern
recognition for mobile user interfaces. In Proceedings
of the National Conference on Artificial Intelligence,
volume 21, page 1789. Menlo Park, CA; Cambridge,
MA; London; AAAI Press; MIT Press; 1999.
Kumar, R., Phoha, V. V., and Serwadda, A. (2016). Con-
tinuous authentication of smartphone users by fusing
typing, swiping, and phone movement patterns. In
2016 IEEE 8th International Conference on Biomet-
rics Theory, Applications and Systems (BTAS), pages
1–8. IEEE.
Kwapisz, J. R., Weiss, G. M., and Moore, S. A. (2010).
Cell phone-based biometric identification. In 2010
Fourth IEEE International Conference on Biometrics:
Theory, Applications and Systems (BTAS), pages 1–7.
IEEE.
Lee, W.-H. and Lee, R. B. (2015). Multi-sensor authenti-
cation to improve smartphone security. In 2015 Inter-
national Conference on Information Systems Security
and Privacy (ICISSP), pages 1–11. IEEE.
Lin, C.-C., Chang, C.-C., Liang, D., and Yang, C.-H.
(2012). A new non-intrusive authentication method
based on the orientation sensor for smartphone users.
In 2012 IEEE Sixth International Conference on Soft-
ware Security and Reliability, pages 245–252. IEEE.
Nandakumar, K., Chen, Y., Dass, S. C., and Jain, A. (2007).
Likelihood ratio-based biometric score fusion. IEEE
transactions on pattern analysis and machine intelli-
gence, 30(2):342–347.
Ross, A., Nandakumar, K., and Jain, A. K. (2008). Intro-
duction to multibiometrics. In Handbook of biomet-
rics, pages 271–292. Springer.
Sitov
´
a, Z.,
ˇ
Sed
ˇ
enka, J., Yang, Q., Peng, G., Zhou, G., Gasti,
P., and Balagani, K. S. (2015). Hmog: New behav-
ioral biometric features for continuous authentication
of smartphone users. IEEE Transactions on Informa-
tion Forensics and Security, 11(5):877–892.
Continuous Authentication based on Hand Micro-movement during Smartphone Form Filling by Seated Human Subjects
431
