
A Diagnosis Support System for Veterinary Necropsy based on Bayesian
Networks
Vianney Sicard
a
, S
´
ebastien Assi
´
e
b
, La
¨
etitia Dorso
c
, Florian Chocteau
d
and S
´
ebastien Picault
e
INRAE, Oniris, BIOEPAR, 44300, Nantes, France
Keywords:
Veterinarian Autopsy, Bayesian Network, Decision-support Tool, Cattle Diseases.
Abstract:
Veterinary autopsy requires a high level of expertise and skills that not all veterinarians necessarily master,
especially in the context of the desertification of rural areas. The development of support systems is a chal-
lenging issue, since such a tool, to be considered relevant and accepted by practitioners in their diagnosis
process, must avoid any black box effect. The diagnosis support system we introduce here, IVAN (“Inno-
vative Veterinary Assisted Necropsy”), aims to engage the user in an explicit, understandable, validable and
reviewable process, able to cope with the specific issues of cattle necropsy. Besides, it provides uncertainty
management to deal with approximate lesion descriptions. IVAN relies on a Bayesian network to infer relevant
proposals at each step of the diagnostic process. IVAN was trained on a set of real autopsy cases from autopsy
reports, and its performance was assessed using another set of reports. In addition, the tool had to provide
results in short response time and be able to run the application on mobile device and web server. In addition
to demonstrating the feasibility of the approach, IVAN is a first step towards other support systems in other
species and in broader contexts than autopsy.
1 INTRODUCTION
Autopsy (or necropsy) is the macroscopic morpholog-
ical examination of all organs, based on the dissection
of a corpse to either determine the cause of death, or
identify an ongoing pathological process that required
euthanasia. In cattle, autopsy is often necessary, when
sudden death of an animal or serial mortality occurs
in a farm, to provide the essential elements for a doc-
umented diagnosis and to set up the most appropri-
ate measures for the other animals in the herd, po-
tentially impacting public veterinary health. Veteri-
nary autopsy requires very specific skills (anatomy,
diagnostics, etc.) that not all field veterinarians nec-
essarily master. The increasing scarcity of veterinar-
ians in rural areas makes this issue even more criti-
cal because of the potential severe sanitary and eco-
nomic impact of flawed disease detection (even post-
mortem) in livestock. Connected intelligent medical
tools will provide a substantial assistance to field vet-
a
https://orcid.org/0000-0002-4909-5544
b
https://orcid.org/0000-0002-8291-9533
c
https://orcid.org/0000-0001-7790-951X
d
https://orcid.org/0000-0003-3276-4593
e
https://orcid.org/0000-0001-9029-0555
erinarians by guiding them throughout the diagnostic
process, proposing the most relevant organ to look at,
helping to identify potential diseases, and suggesting
complementary analyses.
The use of expert systems is a serious opportu-
nity to address the scarcity of veterinary practition-
ers with a specialization in necropsy. With the joint
development of artificial intelligence (AI), data avail-
ability and increased information technology (IT) re-
sources, it is possible to develop reliable systems to
model a realistic medical decision-making process in
order to assist non-expert veterinarians. However, the
user must be able to validate each step of the process,
hence, such a system must avoid a black box effect
by making explicit, unambiguous and understandable
proposals that can be assessed throughout the diag-
nostic process.
The transfer of veterinary autopsy expertise to
field practitioners through a support system based
on AI is a real challenge. Expert systems dedi-
cated to diagnosis support have been developed in hu-
man medicine since the 60s, but they generally tar-
get a specific disease and require to integrate a large
amount of human knowledge. The specificity of au-
topsy is the multiplicity of possible diseases and of
intermediary steps (lesions, organs, morphological di-
Sicard, V., Assié, S., Dorso, L., Chocteau, F. and Picault, S.
A Diagnosis Support System for Veterinary Necropsy based on Bayesian Networks.
DOI: 10.5220/0010223106450654
In Proceedings of the 13th International Conference on Agents and Artificial Intelligence (ICAART 2021) - Volume 2, pages 645-654
ISBN: 978-989-758-484-8
Copyright
c
2021 by SCITEPRESS – Science and Technology Publications, Lda. All rights reserved
645

agnosis...), which leads to a highly combinatory pro-
cess. In this paper, we introduce IVAN (“Innova-
tive Veterinary Assisted Necropsy”), a system based
on Bayesian Networks (BN) with a compromise be-
tween veterinary expertise and data-based learning,
to provide the clearest possible process and leave the
choice and validation of each diagnostic step by the
veterinarian. To the best of our knowledge, there is
currently no similar solution in human nor veterinary
medicine which implied to develop new methods able
to address the specificities of necropsy.
The paper is structured as follows: first, we
present related work and their limitation, together
with the Bayesian approach; second, we introduce
the principles and algorithms implemented in IVAN;
third, we present how we carried out the evaluation of
the system.
2 BACKGROUND
In this section, we provide an overview on existing
work on diagnosis support methods. We also briefly
present the principles and interest of BN, and finally
emphasize the specificities of cattle necropsy.
2.1 Existing Diagnosis Support Methods
Existing medical support systems (e.g. Munin (An-
dreassen et al., 2001), Prostanet (Lacave and D
´
ıez,
2003)) focus on a few diseases (only one most of the
time) in living human beings, and generally lack ex-
plicit or understandable process. The first (de Dombal
et al., 1972), developed in the 1960s, concerned only
heart disease and acute abdominal pain. They imple-
mented Bayes’ naive method and got good results on
simple issues. However, they were limited because
the observations were not always correlated. Sub-
sequently, more recent systems used uncertain rea-
soning (e.g. Munin), but, even if the diagnosis pro-
posals were very close to the expert’s, many incon-
sistencies suggested revising the underlying assump-
tions. Mycin (De Baets and Fodor, 1999) used BN
to solve both issues: uncertain reasoning and con-
sistency. Thereafter, softwares like Prostanet pro-
vided robust solutions with a very high level of exper-
tise. More recently, McKendrick (McKendrick et al.,
2000), Seidel (Seidel et al., 2003), Greenen (Geenen
et al., 2011) and Aristoteles (Aristoteles et al., 2019)
have confirmed that expert systems based on BN are
relevant for diagnosis assistance, especially because
of its usage potential for use in a wide range of epi-
demiological disease situations. However, the solu-
tions mentioned above are applied to a single disease,
whereas the solution we propose in the context of vet-
erinary necropsy handles hundreds of diseases.
Other methods, based on deep learning methods,
particularly artificial neural network (Amato et al.,
2013), also focus on a single disease. In addition, they
do not enable explicit and understandable diagnostic
process (black box effect), which, currently, remains
a strong limitation to acceptability among veterinar-
ians. Hence, we preferred to rely upon a Bayesian
approach.
2.2 Bayesian Networks
A BN can be defined as a probabilistic graphi-
cal model representing random variables (Ben-Gal,
2008). It is both a knowledge representation and
reasoning frame, a system for calculating conditional
probabilities, and the underlying architecture for de-
veloping an expert system.
A BN is a directed acyclic graph (DAG) composed
of sets of nodes connected by edges. Nodes represent
variables in the Bayesian sense: observable quanti-
ties, latent variables, unknown parameters or hypothe-
ses. Nodes and variables are equivalent (a node rep-
resents a single variable and a variable can be repre-
sented by only one node). The parameters describe
how each variable relates probabilistically to its par-
ents. Edges represent direct causal relationships be-
tween nodes.
The DAG of a BN necessarily respects the
Markov property, i.e. a node is independent of all
its non-descendent conditionally on its parents (Pearl,
2009) so we have a joint probability density (Pearl,
1982) (1).
P(X
1
, X
2
, ..., X
n
) =
n
∏
i=1
P(X
i
|π
X
i
)
Where π
X
i
is the parents of X.
(1)
Each node is conditionally independent of its non-
descendent.
Each node is endowed with its own conditional
probability table (CPT) (Figure 1) which gives the
probabilities of a variable with respect to the others.
ICAART 2021 - 13th International Conference on Agents and Artificial Intelligence
646
Sprinkler
Grass wet
Rain
Sprinkler
T F
0.4 0.6
Rain
T F
0.2 0.8
Grass wet
Sprinkler Rain T F
F F 0.6 0.4
F T 0.87 0.13
T F 0.92 0.08
T T 0.99 0.01
Figure 1: Example of a trivial BN and associated CPT.
The marginal distribution for a given node with
children can be calculated applying the marginaliza-
tion algorithm (Pearl, 1982; Smail, 2004):
As an example, the calculation of the probability
to have grass wet true (P(G
T
) )
Example of calculation of P(G
T
) from the Fig. 1:
(G = Grass wet, S = Springler, R = Rain)
P(G
T
) = P(G
T
|S
F
, R
F
) · P(S
F
) · P(R
F
)
+ P(G
T
|S
F
, R
T
) · P(S
F
) · P(R
T
)
+ P(G
T
|S
T
, R
F
) · P(S
T
) · P(R
F
)
+ P(G
T
|S
T
, R
T
) · P(S
T
) · P(R
T
)
P(G
T
) = (0.6 ∗ 0.6 ∗ 0.8)
+ (0.87 ∗ 0.6 ∗ 0.2)
+ (0.92 ∗ 0.4 ∗ 0.8)
+ (0.99 ∗ 0.4 ∗ 0.2)
P(G
T
) = 0.766
(2)
The probability of non-observed data can be in-
ferred in the BN, following the direction opposite to
causal effect by applying Bayes’ theorem (BT) (3) or
its generalization to multiple nodes (4).
P(B|A) =
P(A|B) ·P(B)
P(A)
(3)
P(A|X
1
, X
2
, ..., X
n
) = α
"
n
∏
i=1
P(X
i
|A)
#
·P(A)
with α =
1
n
∑
i=1
P(A|X
i
)
(4)
where {X
1
, .., X
n
} is the vector of child nodes of A (all
X
i
assumed independent one from each other).
2.3 Animal Necropsy and Available
Data
The process of veterinary necropsy followed by spe-
cialized practitioners is composed of several inference
steps (Fig. 2). First, after recording general infor-
mation on the animal (sex, breed, age), the veteri-
narian decides to target several organs (step 1), on
which to search for lesions. Lesions consist in ab-
normal shape, size, color, consistency, content or dis-
tribution of either parts of organs or of whole organs,
each combination of these features resulting in a spe-
cific morphological diagnostic (MD). Then, the prac-
titioner deduces possible diagnoses from one or vari-
ous observed MD (step 2). Most of the time, making
the final diagnosis is possible only after gaining ad-
ditional discriminant information (step 3), e.g. by se-
lecting other organs to look at, or performing biolog-
ical tests. The diversity of possible diseases and MD,
as well as the difficulty to identify proper MD from
observed lesions, are a key issue in animal necropsy
and rely both on a vast theoretical knowledge and on
daily experience.
animal information
Potential diseases
Target organs
STEP 1
What to focus on?
autopsy
Observed lesions
description
Morphological
diagnostics
Diagnoses
STEP 2
Which causes?
final diagnosis
Additional tests
STEP 3
How to discriminate?
Figure 2: Main steps of the diagnostic process. Information
deduced by the practitioner can either stay implicit or be
mentioned explicitly in the final necropsy report.
To model this process, two data sources were im-
mediately available. The first one comes from four
years of autopsy reports performed on cattle by vet-
erinary necropsy specialists in a necropsy service in
a French veterinary school. The second is a cor-
pus of theoretical knowledge compiled by a veteri-
nary necropsy specialist concerning the description
of lesions, morphological diagnostic (MD) and dis-
A Diagnosis Support System for Veterinary Necropsy based on Bayesian Networks
647

eases. Recorded data is composed of epidemiological
and health information from reports for 783 cases of
bovine autopsies, involving 543 distinct MD, cover-
ing a total of 152 diseases. In each report, the cause
of death is attributed to a single disease based on
the observed MD. Theoretical knowledge is indeed
larger with a description of 379 diseases, involving
potentially 1914 MD (some of them being quite rare).
Hence, theoretical data can be used to complement
observations.
3 PRINCIPLES AND METHOD
In this section, we present the architecture and algo-
rithms used to implement our diagnostic support sys-
tem for veterinary necropsy (IVAN).
3.1 Intrinsic Complexity and Technical
Constraints
Using a classical BN structure (with each disease rep-
resented by a Boolean node) would involve 925 nodes
(i.e. 1850 Boolean parameters). Their combination
would lead to a huge computation time while the fi-
nal application must be used on the field and there-
fore must produce results in reasonable time. Since
autopsy reports conclude with a single disease, it was
possible for diseases to replace the multiple Boolean
nodes by a single node with multiple values. Besides,
several optimization methods were applied in the pro-
cessing of BN calculations.
The challenge was to address the following issues
simultaneously:
• no black box: the diagnosis process is not a
straight deduction from an initial set of input data;
it must instead be decomposed into several steps
which are all explicit, understandable, validable
and reviewable by the user and are expected to
guide the user and propose a prioritization of pos-
sible options
• uncertainty management: assist and guide non-
experts by providing them the most relevant pro-
posals for accurate input information
• reactivity: short response time even with highly
combinatorial process and mobile application
• versatility: the application must run on both a mo-
bile device and a web server
To solve versatility issues, we use the Meteor.js
framework which enables developing once in a single
language, here Javascript (JS), and then compile the
code for each platform. This comes with a limitation
due to JS, which is not a language dedicated to sci-
entific computing, and provides currently no specific
library for BN.
3.2 Calculation of Conditional
Probability Tables
To ensure that the diagnostic process followed by
IVAN mimics the usual diagnostic process as ex-
pected by the practitioner, the structure of the BN
was built with the help of veterinary necropsy spe-
cialists, not by learning the structure from the data.
The data provided by necropsy reports were restruc-
tured into tables (in xls format) directly by the vet-
erinary necropsy specialists, according to the specific
structure of the global BN (Na
¨
ım et al., 2011). To cal-
culate each CPT corresponding to the different nodes
of the BN, we used the R library bnlearn (Scutari and
Denis, 2015) which provides outputs in its specific
format (.bif ).
Examples :
• description of the node age group defined from
veterinary necropsy expertise:
variable age_group {
type discrete [ 5 ] {
ADULT, YOUNG, NEWBORN, CALF, OLD
};
}
• declaration of the CPT between the disease
Mannheimia (BR10) and the MD Pulmonary em-
physema (RP2430) calculate from data (the values
below give, on each line representing the presence
of MD RP2430, the probability of having or not
the disease BR10):
probability ( BR10 | RP2430 ) {
(present) 0.2403846, 0.7596154;
(absent) 0.01150121, 0.98849879;
}
To calculate CPT bnlearn needs the following inputs:
• the graph structure in a specific syntax,
e.g. for BN1: [sex][breed][age_group]
[diseases|sex:breed:age_group],
• the data table structure according to the BN struc-
ture,
• the method to use (here Bayesian method with an
imaginary sample size (iss) of 10 (Scutari and De-
nis, 2015)).
The output files generated by bnlearn are parsed
by the application to build the different BN needed.
ICAART 2021 - 13th International Conference on Agents and Artificial Intelligence
648
3.3 Belief Propagation
Belief propagation in a BN can be calculated us-
ing either polytree propagation (PP) (Rebane and
Pearl, 1987) or junction tree (JT) (Madsen and Jensen,
1998). JT is usually used when the BN cannot be ex-
pressed as a polytree. In our case the BN is a polytree
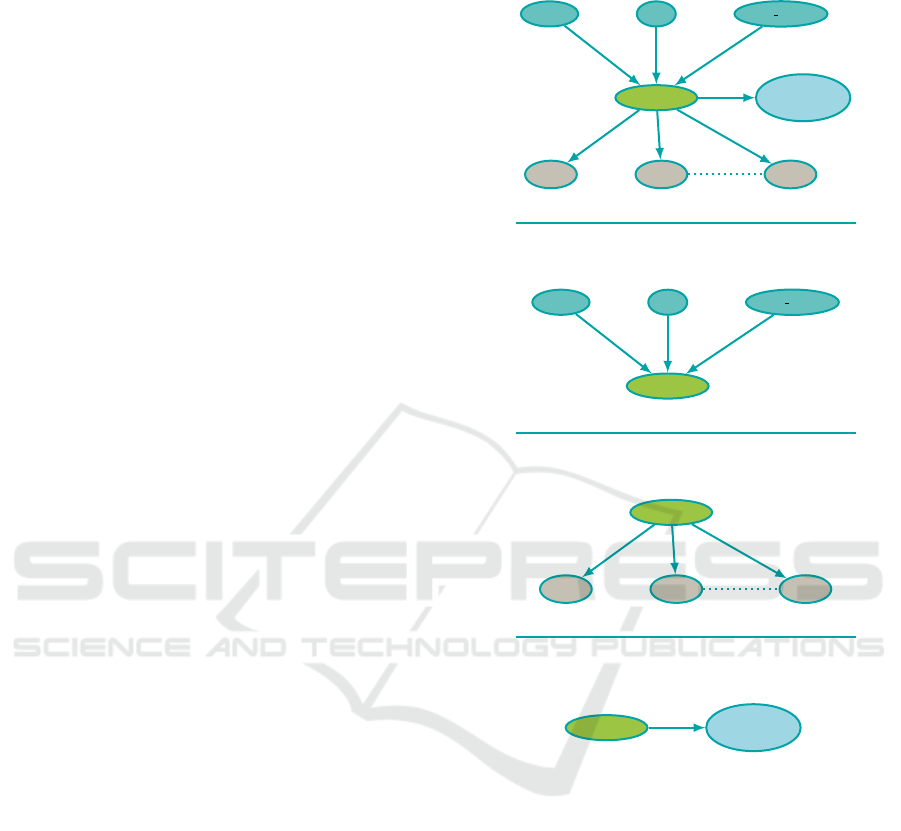
(Fig. 3), so we used the PP algorithm.
To optimize calculation, marginal distributions are
computed “just in time” and results are stored for later
use. The propagation is calculated only for the branch
of the BN concerned with the Depth-First Search al-
gorithm. Thus, marginal distribution goes up to the
considered node and the path can be reused without
recalculation.
Belief propagation is based on the opposite effect
to causal effect. As mentioned above, generalised BT,
which involves only a single layer of the BN, limits
the number of calculations to perform. The compu-
tational cost of generalised BT is proportional to the
number of variables involved.
3.4 Subgraph Division
The formalisation of the diagnosis process is com-
posed of three main steps corresponding to the dif-
ferent stages of the veterinarian’s reflection process
to make a diagnosis (Fig. 4):
1. determine a set of potential diseases (and there-
fore their concerned organs to be autopsied) based
on animal information
2. diagnose diseases from a set of MD observed dur-
ing autopsy
3. propose additional tests to discriminate between
possible diseases
Each of these steps are conditioned by the choice
of the veterinarian from the list of proposals given
by the system. The respect of these validation break-
points is crucial to ensure that the system is not per-
ceived as a monolithic black box which would provide
final outputs directly from inputs. On the contrary,
each step is seen as mimicking the corresponding rea-
soning step in the veterinary necropsy specialist’s di-
agnosis process.
It is therefore possible to divide the whole BN into
three subgraphs representing these steps. This signif-
icantly reduces the calculation times for BN process-
ing, making it possible to implement this method in
JS, hence enabling the final application to be usable
in the field.
To make the divisions, we had to adapt the struc-
ture of the BN with a specific approach consisting of
grouping nodes that have similar specification (Smail
Global BN
breed
sex
age group
diseases
additionnal
tests
MD
1
MD
2
MD
n
BN1
breed
sex
age group
diseases
BN2
diseases
MD
1
MD
2
MD
n
BN3
diseases
additionnal
tests
Figure 3: Global architecture of the BN after node grouping,
and the different sub-graphs: BN1 → animal information to
diseases, BN2 → diseases to MD, BN3 → disease to addi-
tional tests. These subgraphs correspond to the successive
steps of the diagram process (Fig. 4.)
and Raoult, 2005), i.e. grouping each disease node
into a single one, compound of the parameters cor-
responding to each possible disease, and similarly for
additional tests. The disease node is used as a pivot
node for each sub-graph (Fig. 3).
For the first division, the disease node contains the
parameters corresponding to each possible disease.
This node has three parent nodes corresponding to the
animal’s information (sex, age, breed). The second
division is the principal BN which produces the diag-
nosis. The disease node contains the parameters cor-
responding to each possible diseases. This node has
several children corresponding to the different possi-
ble MD. The third division is the simplest, with only
A Diagnosis Support System for Veterinary Necropsy based on Bayesian Networks
649
animal information
- d
1
- d
2
- d
n
Potential diseases
- o
1
- o
2
- o
n
Target organs
STEP 1
autopsy
description
- MD
1
- MD
2
- MD
n
MD found
- diag
1
- diag
2
- diag
n
Possible diagnoses
STEP 2
- add
1
- add
2
- add
n
Additional tests
STEP 3
Final diagnosis
veterinary procedure interaction with practician
system proposals inference step
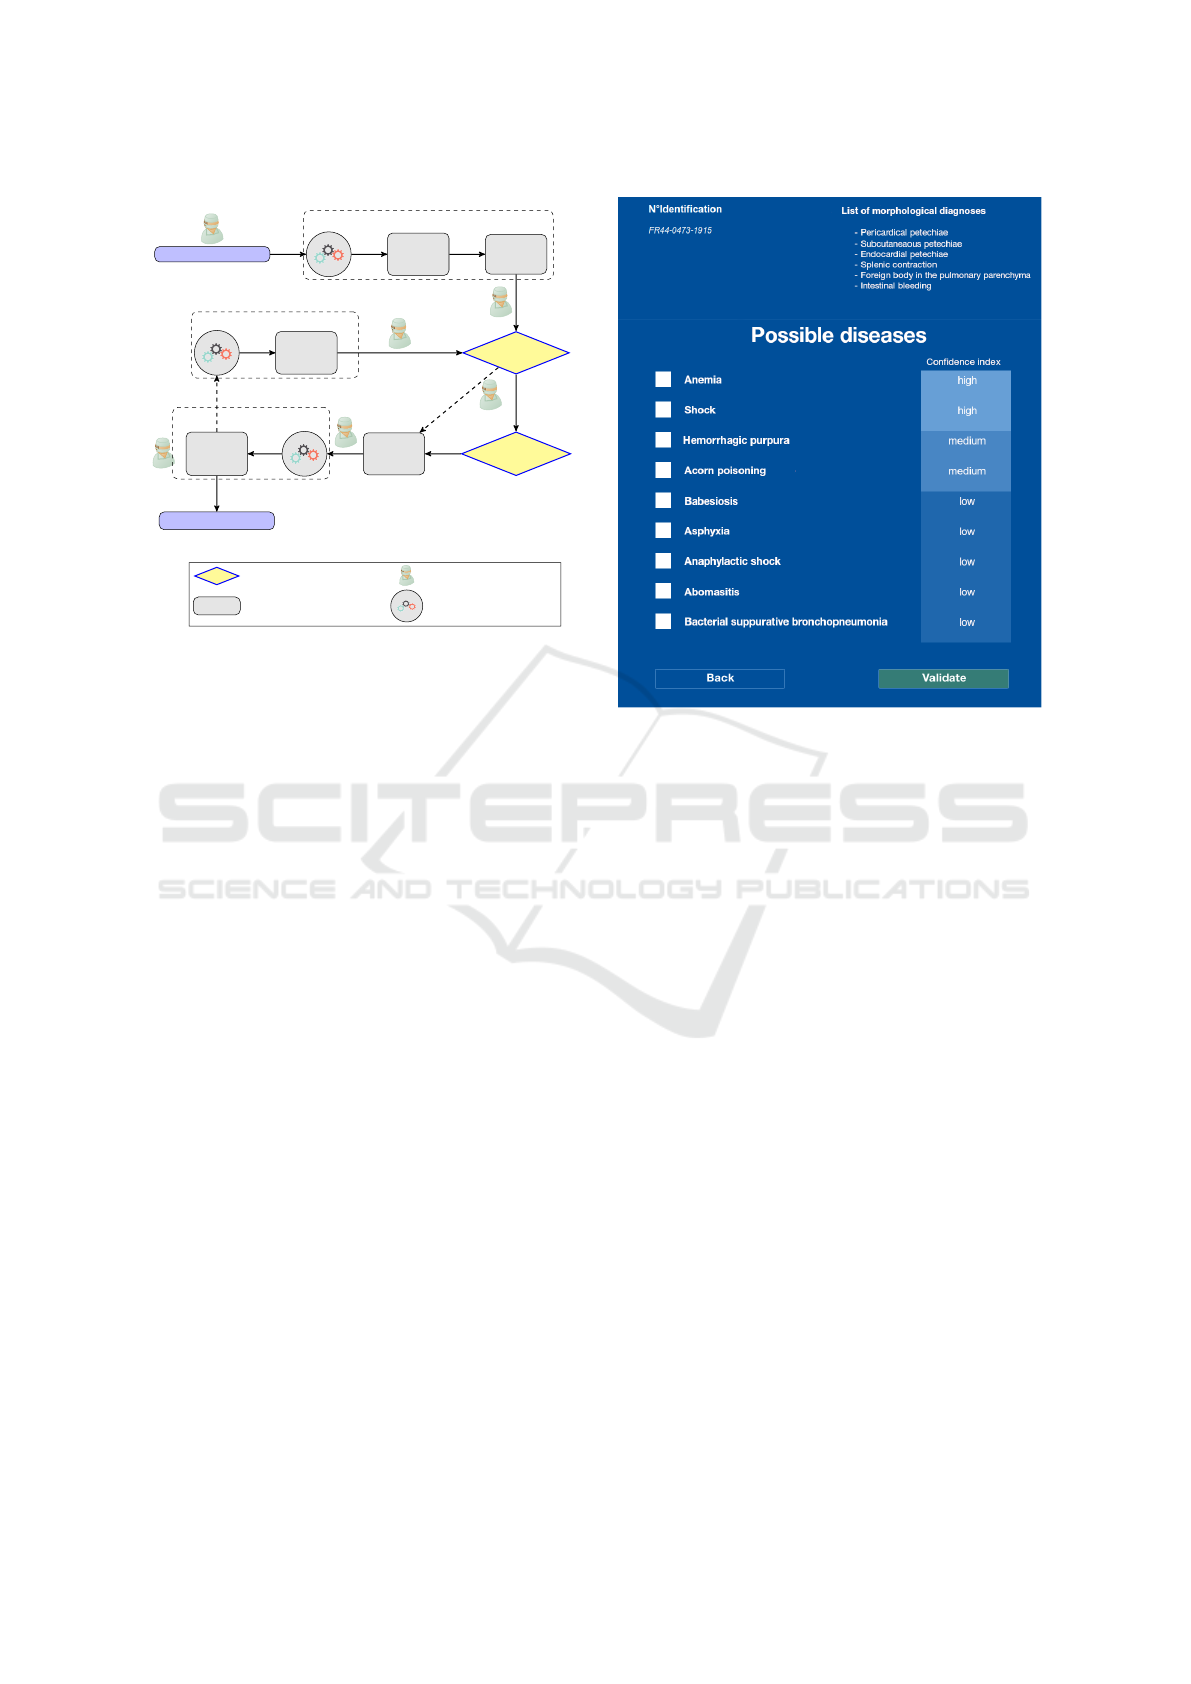
Figure 4: Main steps of the diagnostic process in IVAN.
The veterinarian chooses whether to acknowledge or revise
proposals at each key step identified previously.
two nodes connecting diseases and additional tests.
At this stage, the practitioner can select the dis-
eases which seems the more probable to get a pro-
posal of additional test for further discrimination.
3.5 Clustering of Subgraph Inferences
To facilitate the interpretation of outputs inferred in
each subgraph (hence user’s subsequent choice), the
proposals are not displayed directly with their cal-
culated probability value, which is expected mainly
to provide a confidence level and a relative order
of proposals. Thus, results are clustered into 1 to
3 categories (High, Medium and Low probabilities)
without changing their order (Fig. 5), using the K-
means algorithm (Lloyd, 1982) with Euclidean dis-
tance. The relevant number of classes is determined
by the Silhouettes method (Rousseeuw, 1987), to en-
sure that e.g. three medium-probability outputs are
gathered into the “Medium probability” class rather
than dispatched into High, Medium and Low proba-
bility classes respectively.
This approach is a way to cope with the uncer-
tainty of observations or descriptions, which results
in the relatively low relevance of providing the user
with absolute probability values. According to veteri-
nary necropsy specialists’ evaluation of the tool, this
qualitative classification was much more meaningful
than a list sorted by probability value.
Figure 5: Screenshot of IVAN proposing diagnoses (cen-
ter, left) grouped by probability levels (center, right) rang-
ing from high to low, based on observed MD (upper right
corner).
3.6 Morphological Diagnosis
Discrimination
To perform the diagnostic process with the BN, the
veterinarian must enter the appropriate MD name into
the system. This can be an issue if the veterinarian
is not familiar with MD identification. To solve this
problem, MD can be inferred from the description
of organ lesions, even imprecise. Each MD was de-
scribed by veterinary necropsy specialists according
to the following criteria: size, shape, colour, consis-
tency, content and distribution. In order to manage the
uncertainty of descriptions, veterinary necropsy spe-
cialists have established a list of valid values for each
criterion and determined a distance between those
values to qualify their differences.
Each criterion k is associated with a set of n
k
valid
values a
k
i
(e.g. k = colour =⇒ a
k
i
= white) with
a distance measure between each pair of valid val-
ues (|a
k
i
− a
k
j
|) defined by veterinary necropsy spe-
cialists. The theoretical description of a lesion on
an organ, associated to a specific MD, is a vector :
V
∗
= (a
∗k
i
)
i=1,n
k
with k = {shape, size, color, consis-
tency, content, distribution} and (a
∗k
i
)
i=1,n
k
being the
set of valid values for criterion k. The description of
an observed lesion, entered by the veterinary during
ICAART 2021 - 13th International Conference on Agents and Artificial Intelligence
650

Figure 6: Example of the description of distances between
parameters for the shape of the lesion.
the diagnosis process, is a vector V = (a
k
i
)
i=1,n
k
. The
distance matrix D = (|a
∗k
i
− a
k
j
|)
i, j
allows to identify
the most relevant MD associated to the lowest value
of
∑
k
D
ik
. (Fig. ??), proposed for validation to the
user.
3.7 Supervised Learning
IVAN is enriched by supervised learning based on its
usage. The results of each diagnostic step are stored in
the database in separate table. These records are peri-
odically validated or discarded by veterinary necropsy
specialists and then re-injected into the process of the
calculation of conditional probability tables to update
them. This process is semi-automated, the valida-
tion step by a veterinary necropsy specialist being the
only section executed by humans. For now, this step
is mandatory to ensure that user-generated informa-
tion is reliable enough (especially because IVAN user
keeps the full responsibility for the final diagnosis).
4 TESTS AND VALIDATION
4.1 Execution Time
The use of the application on the field requires low re-
sponse times. We have tested it on a server with 2 GB
RAM and 2 CPUs. The test of performance was done
on the different steps separately to determine which
one takes the more execution time (Table 1).
As expected, the more MD there are, the longer
the execution time of the second step is, but this re-
Table 1: Typical execution time for each BN corresponding
to the three main steps. The crucial step (from MD to dis-
ease) was assessed with both a simple case (1 MD) and the
most complex case found on reports (6 MD).
BN1 BN2 BN3
(organs) 1 MD 6 MD
< 2s < 1s < 15s < 1s
mains within an acceptable time range for real-world
use, compared to the time spent by the veterinary for
necropsic exams (about 1h for an adult cow).
4.2 Protocol for Assessing Diagnosis
Proposals
To carry out a preliminary evaluation of IVAN, we
used a set of 40 new autopsy reports that were not in-
cluded in the set of learning reports. We considered
two criteria: a score with respect to the best proposal,
and the relevance of the diagnostic. Both can be as-
sessed for each step of the process.
The score refers to the relative position (based on
the rank from 1 to number of proposals nbProp) of a
real diagnosis item (organ, MD or disease mentioned
in the autopsy report) in the list of IVAN proposals for
the corresponding step, ordered by decreasing proba-
bility (5). A score between 1 and 0.5 means that the
diagnosis was found in the first half of the list pro-
posed by the software.
(
score = 0 if real diagnosis not proposed
score =
nbProp−rank+1
nbProp
otherwise
(5)
The relevance refers to the presence or absence
of each diagnosis in the list of results, which means
that IVAN’s proposals are considered relevant if one
of them matches the real-case diagnosis as mentioned
in the final report. This measure was defined in accor-
dance with veterinary necropsy specialists’ point of
view, to account for the lack of explicit intermediary
hypotheses, possibly formulated during the necropsic
process, but discarded from the final report. Indeed,
when used by a non-expert veterinarian in real situ-
ations, the correct diagnosis may have a poor score,
because alternative diagnoses that are highly proba-
ble without prior information may be discarded later
due to additional exams. Thus, the relevance is a way
to assess whether IVAN is able to propose the right
diagnosis among its proposals.
A Diagnosis Support System for Veterinary Necropsy based on Bayesian Networks
651
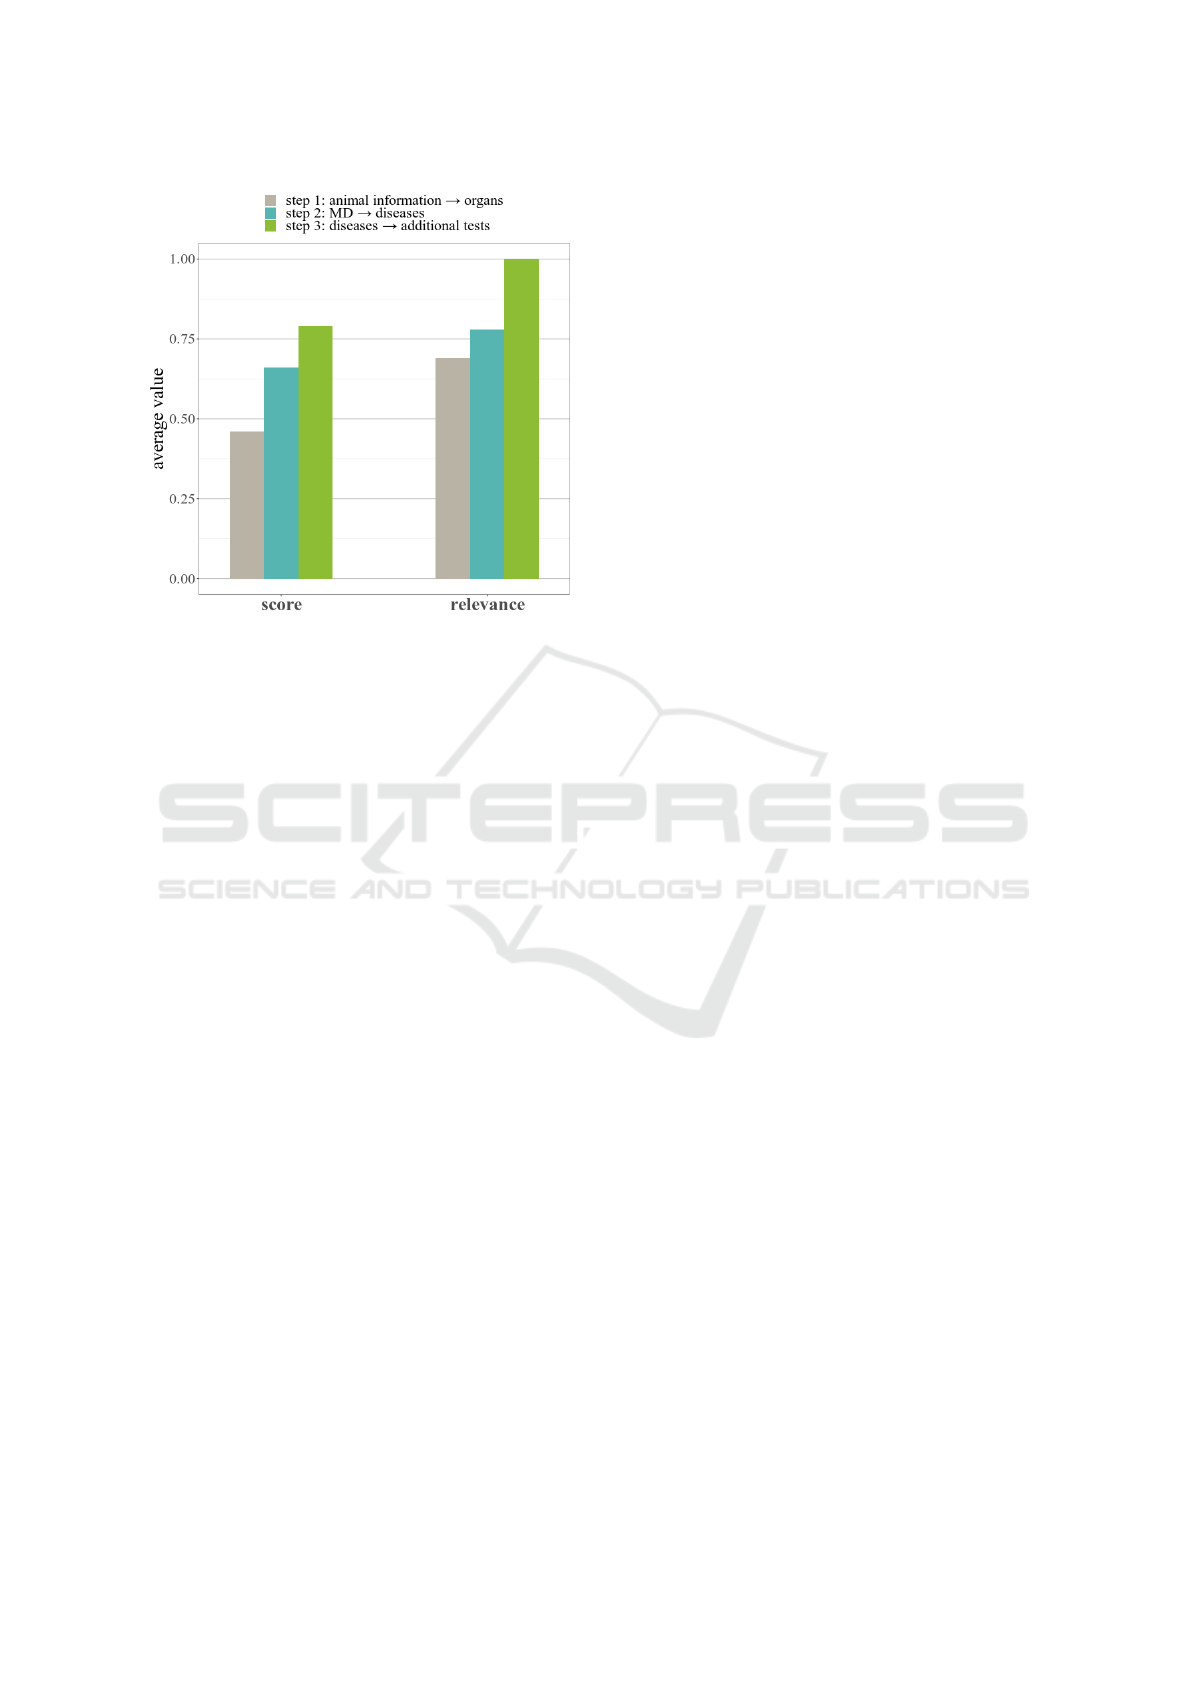
Figure 7: Average score and relevance of IVAN on a sample
of 40 new reports.
4.3 Results
Figure 7 shows that most of the results are in first half
of the list for all subgraphs outputs. The low score for
the first step (0.46) is due to the wide range of possi-
bilities at this stage of the diagnosis, but in terms of
performance, it can be considered that the application
is able to provide sound advice. In contrast, the third
step has very high score. This is due to the limited
range of additional tests.
The real interest lies in the second step, which cor-
responds to the diagnostic step. Most of the results are
at the top of the first half of the list (0.79) and provide
the correct diagnosis in 78% of cases. The result is in
the high average of a veterinarian practitioner who is
not a specialist in cattle necropsy. We can probably
achieve better results with a larger learning sample.
5 DISCUSSION AND
PERSPECTIVES
To the best or our knowledge IVAN is the first system
to support the diagnosis of veterinary necropsy based
on Bayesian Networks.
Necropsic diagnosis requires a high level of ex-
pertise, which is not necessarily mastered by field vet-
erinarians. IVAN is a helpful assistant for practition-
ers by providing relevant proposals at each step of the
necropsic procedure without any black box effect and
leaving the final decision to the veterinarian. The di-
agnosis process of the system is fully understandable,
validable and reviewable by the user, including un-
certainty management by guiding the veterinarian in
describing the lesion to give the system the exact mor-
phological diagnosis required.
The first performance tests are encouraging, both
in terms of execution time and relevance of the diag-
nostic proposals. According to veterinary necropsy
specialists, who are also lecturers at a public veteri-
nary school, IVAN results would be higher in average
than students results in final year of veterinary school,
and at least equal or better than field veterinarians not
expert but familiar with autopsies.
5.1 Further Assessment
The purpose of a tool like IVAN is to enhance the
reliability of the necropsies performed by field vet-
erinarians, especially in the context of an increased
scarcity of veterinary necropsy specialists. Thus, the
tool should either make non-experts more confident in
their diagnosis, or come to a diagnosis at all.
Thus, to evaluate IVAN in more realistic condi-
tions as an intelligent assistant, we need to compare
the outcomes of an interaction between a non-expert
practitioner and the software throughout a necropsy,
with two extremes: on the one hand, the conclusions
of the veterinary necropsy specialist (used as a gold
standard), and on the other hand, the conclusions of
the non-expert, assumed incorrect in many cases (ac-
cording to veterinary necropsy specialists).
We plan to do so in the forthcoming months with
the help of field veterinarians or of veterinary thesis
students engaged in a specialization in necropsy. For
each step of the necropsic process, proposals made by
the non-expert practitioner and by IVAN will be as-
sessed by the veterinary necropsy specialist (in terms
of score and relevance), then the non-expert prac-
titioner will be provided with IVAN proposals and
asked either to keep its conclusions or revise them,
which will lead to a third assessment by the veteri-
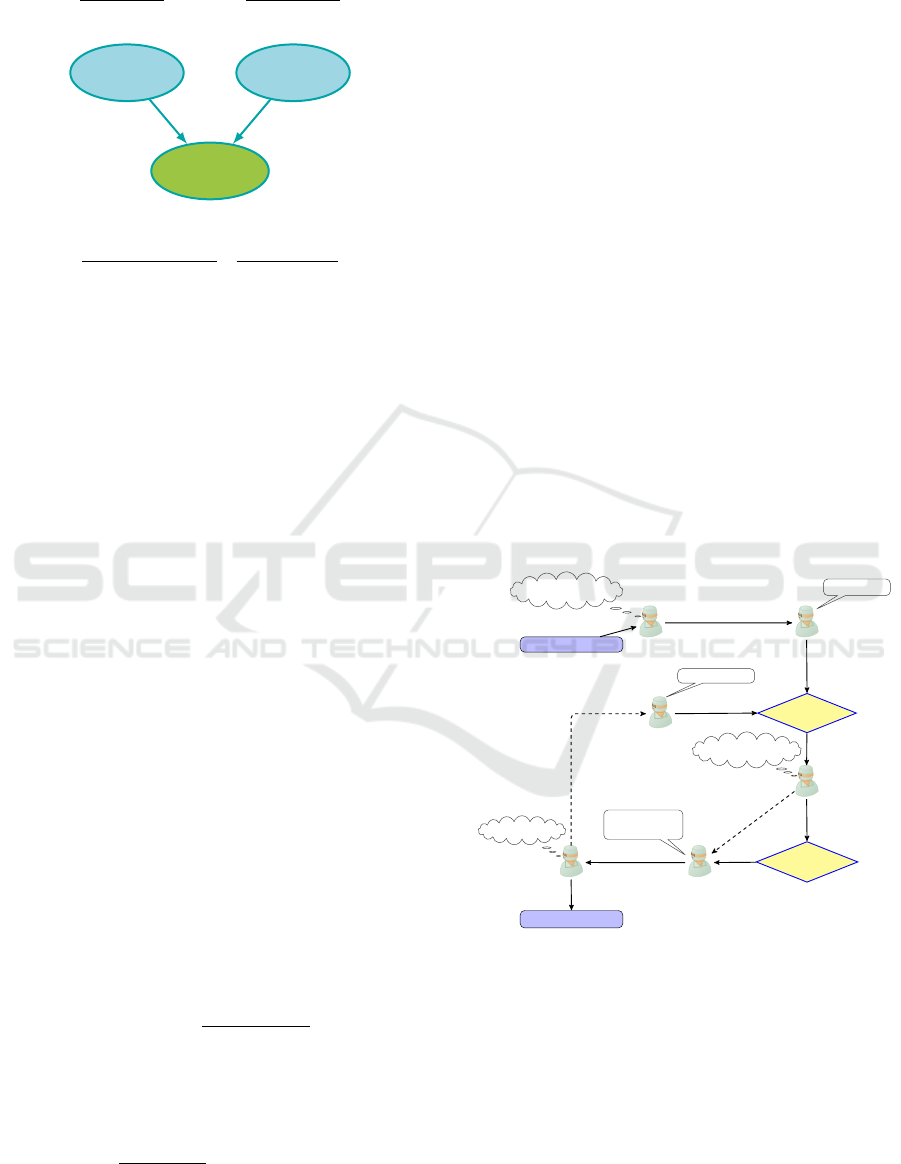
nary necropsy specialist (Fig. 8).
Thus, we will be able to evaluate to what extent
the conclusions of the non-expert veterinarians may
either be comforted by IVAN proposals, or enhanced
by its suggestions, as a measure of the quality of the
support provided by the machine. The study of how
frequently erroneous conclusions of a non-expert are
modified when confronted to correct conclusions by
the software will also provide insights on the accept-
ability of the software as an “intelligent assistant”.
Conversely, cases where IVAN proposals are incor-
rect will highlight cases underrepresented in learning
data.
ICAART 2021 - 13th International Conference on Agents and Artificial Intelligence
652

Necropsy expert
observation
assessment1
assessment2
assessment3
Nurse
Vet student/Field vet
observation
proposals1
proposals3
(aer reading proposals2)
IVAN
submission
proposals2
Figure 8: Evaluation protocol to be carried out for each
of the three steps of the diagnostic process, to assess the
added-value of IVAN for assisting a non-expert veterinar-
ian during on-field necropsy.
5.2 Perspectives
In addition to the intended experimental assessment,
IVAN will be integrated in the coming months within
a professional software platform to be proposed as an
e-service to field veterinarians. This will be an op-
portunity to carry out a thorough assessment of the
tool usage and provide data from real use cases. A
procedure will be set up to assess the reliability of
necropsies carried out with IVAN and integrate vali-
dated reports into the learning database.
The first results of IVAN on bovine necropsy make
it possible, firstly, to consider other breeds and in a
further step, to apply the process on living animals,
including clinical signs instead of lesion description.
Supporting necropsy for other breeds can rely upon
the autopsy reports for bovine. That can be applied
quite readily and quickly in the continuity of the cur-
rent work. The post-mortem diagnosis can also ben-
efit from knowledge regarding the ante mortem con-
dition. The issues to address to do so are similar for
the diagnosis of living animals, since they rely on the
same kind of hypothetico-deductive inferences. This
will be the major challenge for the next stages of
IVAN, and for the development of a specific tool to
support living animal diagnosis.
6 CONCLUSION
We consider our contribution a first step towards the
development of diagnosis support systems for veteri-
nary necropsy, able to assist non-expert practitioners
with relevant, reviewable, step-by-step recommenda-
tions mixing recorded cases and theoretical knowl-
edge. IVAN’s database will be enriched by, on the one
hand, new necropsy reports performed at the autopsy
service, and, on the other hand, on-field records stored
in IVAN performed by non-expert practitioners, after
validation by veterinary necropsy specialists.
Though initiated in the context of bovine
necropsy, our approach is generic enough to apply
to other species and to living animals. The choice
of a Bayesian Network for learning and probabilistic
inference enables to cope with uncertainties encoun-
tered in the descriptions of lesions and resulting from
the scarcity of data, but also to provide a natural de-
composition of the diagnostic process, mimicking the
inferences made by a veterinary necropsy specialist,
hence facilitating the acceptance of the system by the
user. Such systems could be an opportunity for AI to
provide a substantial assistance to field veterinarians
in the context of the medical desertification of rural
areas.
ACKNOWLEDGEMENTS
This work is being carried out as part of the
Telemedecine Business Chair, co-financed by MSD
Animal Health and Oniris - Veterinary Medicine
School of Nantes.
REFERENCES
Amato, F., L
´
opez, A., Pe
˜
na-M
´
endez, E. M., Va
ˇ
nhara, P.,
Hampl, A., and Havel, J. (2013). Artificial neural
networks in medical diagnosis. Journal of Applied
Biomedicine, 11(2):47–58.
Andreassen, S., Suojanen, M., Falck, B., and Olesen, K. G.
(2001). Improving the Diagnostic Performance of
MUNIN by Remodelling of the Diseases. In Quaglini,
S., Barahona, P., and Andreassen, S., editors, Artificial
Intelligence in Medicine, Lecture Notes in Computer
Science, pages 167–176. Springer Berlin Heidelberg.
Aristoteles, A., Adhianto, K., Andrian, R., and Nuhricha,
Y. (2019). Comparative analysis of cow disease di-
agnosis expert system using bayesian network and
dempster-shafer method. 10(4).
Ben-Gal, I. (2008). Bayesian Networks. In Encyclopedia of
Statistics in Quality and Reliability. American Cancer
Society.
A Diagnosis Support System for Veterinary Necropsy based on Bayesian Networks
653

De Baets, B. and Fodor, J. (1999). Van Melle’s combining
function in MYCIN is a representable uninorm: An al-
ternative proof. Fuzzy Sets and Systems, 104(1):133–
136.
de Dombal, F. T., Leaper, D. J., Staniland, J. R., McCann,
A. P., and Horrocks, J. C. (1972). Computer-aided
Diagnosis of Acute Abdominal Pain. British Medical
Journal, 2(5804):9–13.
Geenen, P., van der Gaag, L., Loeffen, W., and Elbers, A.
(2011). Constructing naive bayesian classifiers for
veterinary medicine: A case study in the clinical di-
agnosis of classical swine fever. 91(1):64–70.
Lacave, C. and D
´
ıez, F. J. (2003). Knowledge Acquisi-
tion in PROSTANET – A Bayesian Network for Di-
agnosing Prostate Cancer. In Goos, G., Hartmanis, J.,
van Leeuwen, J., Palade, V., Howlett, R. J., and Jain,
L., editors, Knowledge-Based Intelligent Information
and Engineering Systems, volume 2774, pages 1345–
1350. Springer Berlin Heidelberg, Berlin, Heidelberg.
Lloyd, S. (1982). Least squares quantization in PCM. IEEE
Transactions on Information Theory, 28(2):129–137.
Madsen, A. L. and Jensen, F. V. (1998). Lazy Propagation
in Junction Trees. In Proceedings of the Fourteenth
Conference on Uncertainty in Artificial Intelligence,
UAI’98, pages 362–369, San Francisco, CA, USA.
Morgan Kaufmann Publishers Inc.
McKendrick, I., Gettinby, G., Gu, Y., Reid, S., and Re-
vie, C. (2000). Using a bayesian belief network to
aid differential diagnosis of tropical bovine diseases.
47(3):141–156.
Na
¨
ım, P., Wuillemin, P.-H., Leray, P., Pourret, O., and
Becker, A. (2011). R
´
eseaux bay
´
esiens. Editions Ey-
rolles.
Pearl, J. (1982). 1982 - reverend bayes on inference en-
gines: A distributed hierarchical approach. page 4.
Pearl, J. (2009). Causal inference in statistics: An overview.
Statistics Surveys, 3:96–146.
Rebane, G. and Pearl, J. (1987). The Recovery of Causal
Poly-trees from Statistical Data. In Proceedings of the
Third Conference on Uncertainty in Artificial Intelli-
gence, UAI’87, pages 222–228, Arlington, Virginia,
United States. AUAI Press.
Rousseeuw, P. J. (1987). Silhouettes: A graphical aid to
the interpretation and validation of cluster analysis.
Journal of Computational and Applied Mathematics,
20:53–65.
Scutari, M. and Denis, J.-B. (2015). Bayesian Networks:
With Examples in R. Texts in Statistical Science.
Chapman & hall/crc edition.
Seidel, M., Breslin, C., Christley, R. M., Gettinby, G.,
Reid, S. W. J., and Revie, C. W. (2003). Compar-
ing diagnoses from expert systems and human experts.
76(2):527–538.
Smail, L. (2004). Algorithmique pour les r
´
eseaux bay
´
esiens
et leurs extensions.
Smail, L. and Raoult, J. P. (2005). Successive Restrictions
Algorithm in Bayesian Networks. In Famili, A. F.,
Kok, J. N., Pe
˜
na, J. M., Siebes, A., and Feelders,
A., editors, Advances in Intelligent Data Analysis VI,
Lecture Notes in Computer Science, pages 409–418.
Springer Berlin Heidelberg.
ICAART 2021 - 13th International Conference on Agents and Artificial Intelligence
654
