
A Machine Learning Approach for Real Time Prediction of Last
Minute Medical Appointments No-shows
Ricardo Almeida
1
, Nuno André Silva
2
and André Vasconcelos
1
1
INESC-ID, Instituto Superior Técnico, Lisbon, Portugal
2
Grupo Luz Saúde, Learning Health, Lisbon, Portugal
Keywords: No-show, Healthcare, Prediction Algorithms, Pre-processing, Machine Learning Techniques.
Abstract: A no-show is when a patient misses a previously scheduled appointment. No-shows cause an impact in the
healthcare sector, decreasing efficiency. When a patient misses an appointment the clinic resource are wasted,
postpones his or her chance to get treated for a medical condition and denies medical service to another patient.
In this research, machine learning techniques are used to find patterns in healthcare data and make no-show
predictions. A no-show prediction model is proposed to integrate machine learning techniques into a model
that supports the testing of predictions on different datasets. The model is integrated into an online medical
appointment booking platform to allow the models and predictions made, to be saved and integrated into a
real-time system. Machine learning techniques are tested using three datasets with different characteristics.
Through these tests, the model proposed can find the best features, which are similar in every dataset. The
results obtained are compared to other prediction algorithms and techniques.
1 INTRODUCTION
A no-show is when a patient misses an appointment
that was previously scheduled. This phenomenon
happens in all sorts of areas, where there is the need
to schedule patients or clients into a time slot. In this
paper, we focus on the healthcare area. No-shows
cause an impact in every hospital and clinic in the
world. Attenuating the effects of no-shows in the
healthcare area is something that can provide many
economic and social benefits. When a no-show
occurs there are two consequences, the first happens
to the patient who misses the appointment who
postpones his chance to be treated for a medical
condition. The second one affects the hospital and
other patients because there are other patients who
could have used that opportunity to be seen by the
doctor. This lost opportunity also means a loss of
revenue to the clinic or hospital.
Given the current high demand for healthcare,
wasting available resources is unacceptable,
contributing to the increase in the list of patients
waiting to receive assistance. To attenuate some of
these consequences it is important to figure out what
makes patients miss their appointments and, whether
or not there are identifiable patterns that allow us to
know how likely are patients to miss their
appointment.
In order to predict no show probability, the
appointment data stored by hospitals and clinics
around the world can be used. Using this data and
combining it with machine learning techniques it is
possible to find some of these patterns and obtain a
probability for how likely is a patient to no-show. If
these probabilities are high then specific actions can
be performed by the hospital, like scheduling another
patient for that time slot or contact the patient to try
to confirm the appointment.
1.1 Objectives
The objective of this research is to improve and keep
developing a no-show prediction system for a
company that intends to incorporate it in a scheduling
system for hospitals and clinics. The goal of this
system is to help clinics and hospitals mitigate the
negative effects of no-shows. There are three main
features of this system: The first one is to notify the
patients of the appointments and to confirm their
presence. The second one is a prediction algorithm
that uses machine learning techniques and will return
the probability of no-show for all appointments.
Finally, if the system detects a high probability of no-
328
Almeida, R., Silva, N. and Vasconcelos, A.
A Machine Learning Approach for Real Time Prediction of Last Minute Medical Appointments No-shows.
DOI: 10.5220/0010221903280336
In Proceedings of the 14th International Joint Conference on Biomedical Engineering Systems and Technologies (BIOSTEC 2021) - Volume 5: HEALTHINF, pages 328-336
ISBN: 978-989-758-490-9
Copyright
c
2021 by SCITEPRESS – Science and Technology Publications, Lda. All rights reserved

show it will automatically try to reschedule another
patient to that time slot. This research is focused on
the second one by testing and improving the current
machine learning techniques with real data from
hospitals and clinics. To achieve this goal this paper
focus on three main objectives:
• Create a prediction model that automatically
returns the no-show probability for an
appointment, and is able to efficiently test data
from many clinics and hospitals without the need
of an advanced user to tweak the system.
• To test many machine learning techniques and
find out which provide the best and most
consistent results across many datasets.
• To find out which features are more important to
obtain better results, which prediction algorithm
works best and how accurate can the predictions
be in large datasets from real-world clinics and
hospitals.
This work is expected to give a solid foundation
to allow the continuation of tests in the no-show
prediction system and give some answers to what
results are possible to obtain from these machine
learning methods to tackle the no-show problem.
This work is structured as follows. Section 2
includes a review on related work including previous
work developed with similar goals and its limitations.
Section 3 presents the prediction model developed.
Section 4 describes the results that were obtained
while comparing different techniques. Finally,
section 5 concludes the work.
2 RELATED WORK
No-shows are estimated to have a big financial impact
on hospitals and clinics and as such many studies can
already be found on analysing the impact of no-shows
(Neal et al., 2005), how to best deal with them and
using new ways to try to predict them. All of this to
reduce the level of impact they have in hospitals and
clinics worldwide.
Many of these studies try to pinpoint what are the
major causes of a patient no-show (George and
Rubin, 2003), whether they are involuntary or not.
They also focus on looking at what are the best
practices to reduce the impact of no-shows, this is
normally done by overbooking (LaGanga and
Lawrence, 2007), but has discussed in these articles
this practice may have some impact on waiting time
and client satisfaction. Machine learning is a
technology that has been emerging and being used in
several fields and, as such, some articles studied how
to take advantage of this to reduce no-shows (Turkcan
et al., 2013; Alaeddini et al., 2015; Rinder, 2012;
Ferreira, 2019).
2.1 Causes of No-shows
Finding causes for no-shows is a good starting point
to check if these causes can be prevented from
happening and, whether or not, they can be used as
ways of predicting no-shows.
Many studies give a lot of emphasis on finding out
what are the causes for a patient to not show to an
appointment. Missing an appointment can be a
voluntary or an involuntary act, this last one being
when the patient did not intend to miss the
appointment. There are many reasons for not showing
to an appointment these include forgetting the
appointment, other competing priorities or conflicts,
and the patient’s health status.
The most common reason is when a patient
forgets the appointment (Neal et al., 2005), for this,
many clinics have already implemented a phone or e-
mail reminder, which is reported to reduce no-shows
(Leong et al., 2006; Liew et al., 2009). Other reported
reasons for no-shows are the health of the patient
which may feel better and not need the appointment
anymore, other priorities like a work schedule change
or having to take care of another family member and
some scheduling problems due to bad quality of the
service can lead to wrong appointment information
and to problems in cancelling the appointment. The
weather can also be a factor if it is raining or snowing
people prefer to stay home and if the health problem
is not serious they can no-show (Norris et al., 2014).
Financial problems and lack of transportation were
also some of the reported reasons.
2.2 Features for No-show Prediction
To be able to predict whether a patient is going to no-
show to an appointment, it is required to have access
to many factors about the appointment and the
patient, which in conjunction leads to a prediction that
can be stronger by having access to many factors and
many similar cases. Many studies tackle this problem
in an attempt to make their prediction algorithms
better (Turkcan et al., 2013; Alaeddini et al., 2015;
Elvira et al., 2017; Daggy et al., 2010; Huang and
Hanauer, 2003). So there is already some information
to help figure out which features in the appointment
data of a clinic or hospital have more relevance to
predict a no-show.
These features can be divided into two categories:
some are relevant to the patient like gender, age,
A Machine Learning Approach for Real Time Prediction of Last Minute Medical Appointments No-shows
329

marital status and insurance status. The others are
relevant to the appointment like the day of the
scheduled appointment, the amount of time between
the day the appointment was scheduled and the actual
appointment day and the type of clinic.
The feature found, relevant to the patient, which
most articles conclude as having the most predictive
power is age, where younger patients seem to no
show to more appointments than other age groups
(Lee et al., 2005). In the patient category, other
features have some impact. These are being
unmarried, not having health insurance, the severity
of the illness and the scholarship level. The gender of
the patient was considered by most articles as having
very little impact, in other words, there are no
differences between men and women regarding their
attendance to previously arranged appointments
(Turkcan et al., 2013). In the appointment features, it
is found that the waiting time has a larger impact
(Dantas et al., 2018; Norris et al., 2014). Other
characteristics that also have an impact are the hour
of the day, whether it is the patient first appointment
(Bennet and Baxley, 2009), the medical speciality
chosen, the hospital centre, whether it is a weekday or
weekend, the type of appointment and the distance to
the clinic. Beyond all these features there is another
one that has a huge impact in predicting accurately if
a patient will no-show, which is the prior no-show
history, whether the patient has missed the last
scheduled appointments (Dantas et al., 2018; Norris
et al., 2014).
2.3 Last Minute Medical Appointments
No-show Management Previous
Research
There is already previous research that addressed the
goal of predicting last-minute no-shows in healthcare
and also contributed to the development of this
prediction system. One of the first research to address
this specific problem was developed by Daniel Sousa
(Sousa and Vasconcelos, 2020), which focused on
developing the algorithm to predict the no-shows and
creating a model to replace patients that have a higher
chance of not showing. There is another research by
Inês Ferreira (Ferreira and Vasconcelos, 2019), which
focused on testing other prediction algorithms and
also created a model to send notifications to patients
and update their respective no-show probability.
3 PREDICTION MODEL
This research proposes the creation of a prediction
model to automate the process of pre-processing
datasets and obtaining predictions from different
datasets. This prediction model allows data to come
from the API connected to the no-show prediction
system and from CSV files. This was done to allow
the system to be tested with real data from hospitals
and clinics, since due to data protection measures is
not possible to merge it in the API, in these early
stages of development.
The prediction model has two main models and
one model that supports the other two and provides a
configuration file for the user. These models are
discussed in the following subsections.
Figure 1: Models and their interaction in the Prediction
model.
3.1 Feature Configuration
Feature configuration is a support file to be used in
the build model and predict model phases. The goal
of this configuration file is to be able to use the
datasets from different clinics and hospitals that come
from CSV files, without the need to change the pre-
processing code every time. This configuration file is
basically a simple python file with a set of variables,
which need to be filled with the names of the features
of the specific dataset we are using. These variables
are then used by the Build Model to automatically
pre-process the dataset features into the ones that will
be used to train the dataset. This list of variables one
that is specific to the CSV file, where the path to the
CSV should be placed. The remaining features must
be matched with the corresponding feature name of
the dataset that will be used.
The variables chosen for the configuration file are
the most common features present in most healthcare
provider's datasets and to the features that possess
stronger predictive power. Other features that prove
to have a strong predictive power can be added in a
future stage so that they can be easily pre-processed.
Once the data comes solely from the API these
configuration files will not be required.
HEALTHINF 2021 - 14th International Conference on Health Informatics
330
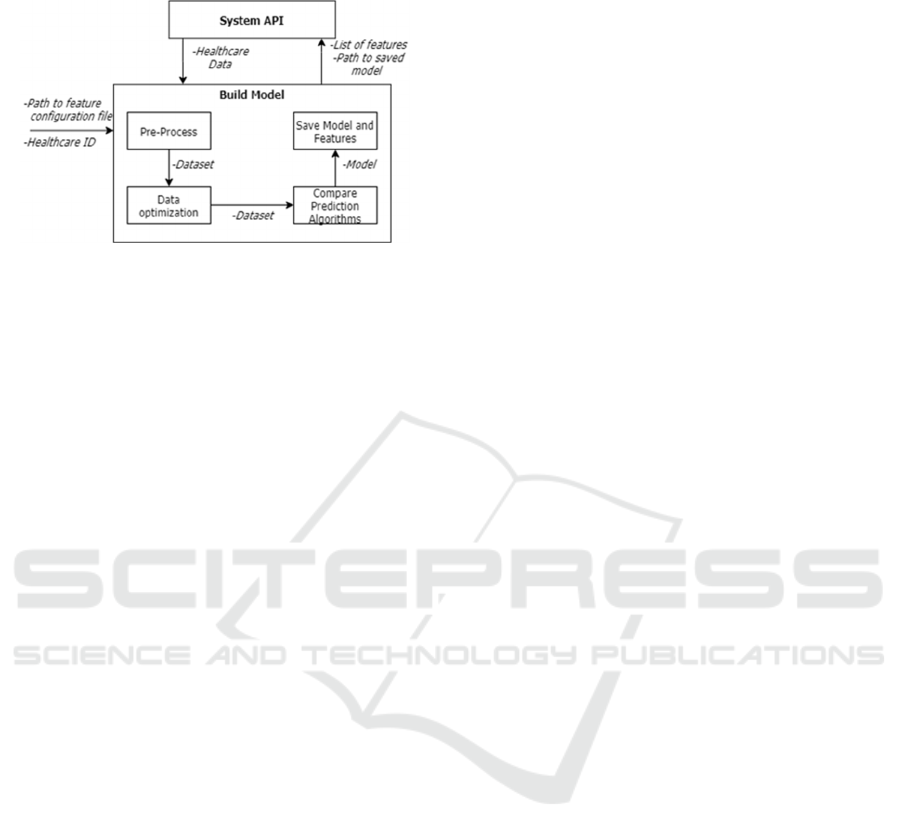
3.2 Build Model
Figure 2: Build model components.
Build Model builds the prediction model, which is
then used to obtain no-show predictions on the data.
This data can come from a CSV file or directly from
the system API. Build Model receives as arguments
the path to the feature configuration file to be used
and the healthcare Id of the associated healthcare
provider. The model is then divided into four phases:
• Pre-process: Pre-processing is where the data
from a specific healthcare provider is
transformed into data that can be used by the
prediction algorithms. This transformation adds
new features from the existing ones to give the
algorithms more information to learn from. It
also removes or replaces missing values and
transforms categorical variables with One-Hot
encoding into dummy variables with values of 1
if true and 0 for false. Beyond this, all the
numeric features are normalized into values in
the range of 1 to 0. This allows the algorithms to
learn better without giving too much weight to
features with high numerical values.
• Data Optimization: In this phase, the data will
be optimized to give the best predictions
possible. The first step is choosing only the
features that possess the strongest predictive
power. First variance threshold is used to remove
features that are almost constant since these
features will not contribute to the predictions.
The next step is using a feature selection
algorithm. The one chosen is Boruta (Kursa et
al., 2010) because it was more efficient than the
other feature selection algorithms tested. To
validate the features chosen by this algorithm, it
is used alongside a 10 fold cross-validation and
for each cross-validation fold, the features
chosen are registered and only the ones that
appear more than 80% of the time are chosen.
The final stage is to balance the data since most
of the data come imbalanced with more shows
than no-shows. This can cause the prediction
algorithms to classify appointments as shows to
have more accuracy. To mitigate this problem,
SMOTE with Edited Nearest Neighbours
(Gustavo et al., 2004) is used which balances the
data by generating data samples with SMOTE
and then using k Nearest Neighbours it removes
those samples that are misclassified by its
neighbours. After the data is balanced, it is now
ready to be fed to the prediction algorithms.
• Compare Prediction Algorithms: It is
impossible to find a prediction model that will be
better for every dataset, things like the size of the
dataset and the number of features can affect the
quality of the predictions for some algorithms.
To solve this problem, four prediction algorithms
are run on the dataset on cross-validation with 3
folds only, to prevent it from being very
computationally expensive. The four prediction
algorithms are Artificial Neural Network,
Gradient Boosting, Logistic Regression and
Random Forest. These algorithms were chosen
because they achieved the best results in previous
no-show researches. After running the prediction
algorithms, the one with the best overall score in
the metric f1-score is the one chosen. This metric
was chosen because it will be more important to
have the right balance between recall and
precision than having good accuracy. At a later
stage of the no-show prediction system, the
prediction algorithm that generally performs
better can be chosen. This will save computation
time which will be more important at that stage.
• Save Model and Features: After we have
chosen the model it must be saved, this is done
using a pickle which is a python module that
allows us to save the model in a file .dat. This file
can then be easily loaded to make predictions for
that healthcare provider. The name of the saved
file along with the features chosen in the data
optimization phase will be saved in the system
API to be used in the prediction phase. The
reason to save the features, as well, is that the
predictions need to be made with the same
features the model was trained on, otherwise it
will not work.
A Machine Learning Approach for Real Time Prediction of Last Minute Medical Appointments No-shows
331
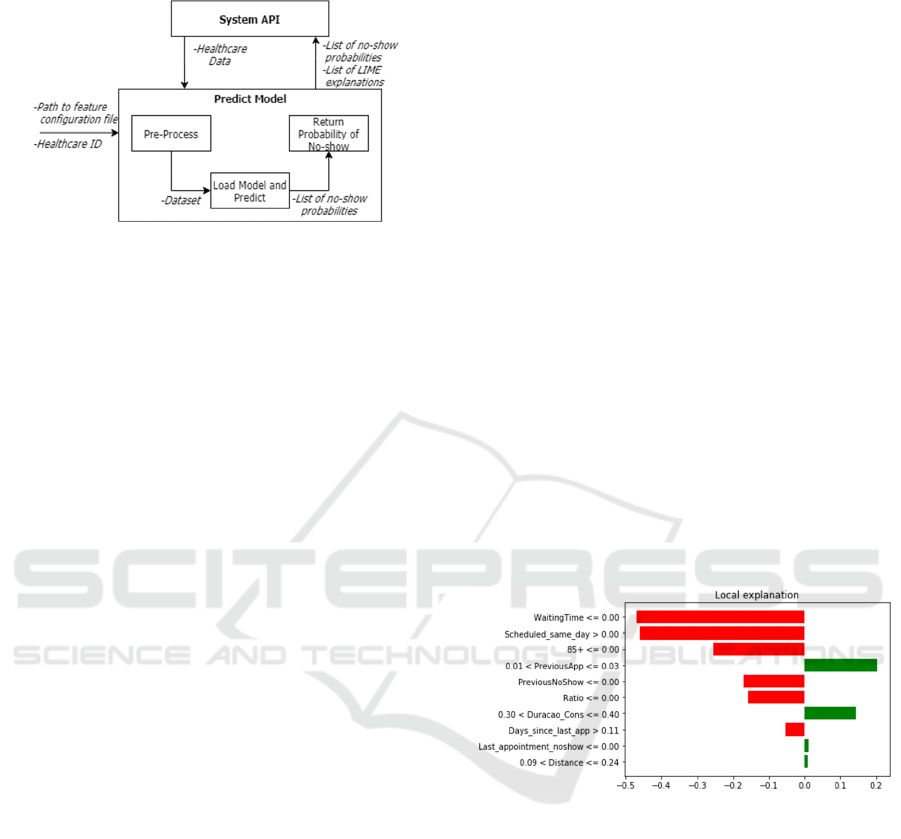
3.3 Predict Model
Figure 3: Predict model components.
The Predict model is the model used to obtain the
probability of a patient missing his or her
appointment. This model has two functions, one to
obtain the probability of no-show for all the
appointments scheduled, in every healthcare, and
another to obtain the probability of no-show for a
specific healthcare provider. The first one does not
receive any argument and only works for the
appointments in the API. This function is scheduled
to be executed every hour or less so that the
probabilities can be regularly updated and in the case,
new appointments are added, we can quickly figure
out what is the probability of no-show. This is
especially important when appointments are
scheduled for the same day or the next day.
The other function is to predict for single
healthcare, this function receives as arguments the
path to the feature configuration and the healthcare id.
This function also works for data in CSV, and in this
case, it should receive an extra argument with the
appointments we want to make predictions on. The
Predict model has three phases, which are:
• Pre-process: In the pre-processing phase, the
appointments to predict are joined with the
original dataset. This is done so that it is possible
for the new appointments to have all the features.
This is required to be able to put the right values
in features like the number of appointments and
the number of no-shows since this needs to be
calculated for the whole data. After this, the list
of features saved in the system API and
associated with this healthcare provider is
retrieved. The features that are not in this list of
features are removed from the appointments to
predict. The numeric values are also normalized
using MinMaxScaler so that everything is on the
same scale.
• Load Model and Predict: In this phase, the
name of the model used to train the data is
retrieved from the API and using python’s
module pickle, the model is loaded. Using the
loaded model the predictions for the probability
of no-show are obtained for all of the
appointments.
• Return Probability of No-show: If the
appointments come from the API, the list of
probabilities is uploaded to the API. Beyond this,
an explanation of how the algorithm obtained
that prediction is updated along with the
probability of no-show. This explanation is
obtained using LIME, which gives a value for
how relevant the features were to the prediction
and returns a list with the nine most relevant
features. An example of these explanations
plotted can be seen in figure 4, where the left red
bars are the features that contribute to being a
show and the right green bars are the features that
contribute to being a no-show. With this, it is
possible to have a better idea of how the
prediction algorithms are obtaining those
probabilities which is important in these early
stages. In case the appointments come from a
CSV file, the main process is the same but the
results are saved to a CSV file. This file will have
the appointments predicted with the original
dataset features and an extra feature with the
probability of no-show.
Figure 4: Plotted explanation obtained using LIME for the
MD Clínica dataset.
4 RESULTS ANALYSIS
In this section, the results obtained in each of the
different datasets are analysed. The prediction
algorithms and machine learning techniques were
tested in datasets from three different healthcare
providers. With this analysis, it was possible to see
which machine learning techniques and what
conducts are more efficient at predicting no-shows.
HEALTHINF 2021 - 14th International Conference on Health Informatics
332

4.1 Datasets Characteristics
The tests were made on three datasets, one from MD
Clínica, the second one from a Brazilian dataset and
the last one is from Hospital da Luz.
All these original datasets had to be transformed
to be tested with the prediction algorithms. The
features that were used in all datasets are the
following:
• The time between the day the appointment was
scheduled and the appointment itself in days.
• The number of previous appointments
• The number of previous no-shows.
• The ratio between the number of previous no-
shows and the number of previous appointments.
• Whether the patient scheduled his appointment
on the same day of his last appointment.
• Whether the appointment was scheduled on the
same day of the appointment.
• Whether the patient’s last appointment was a no-
show.
• Days since the patient had his last appointment
• A binary feature for each one of the months.
• A binary feature for each one of the weekdays.
• The age divided into 10 different age groups with
a binary feature for each one of them.
• Binary feature with gender.
The remaining characteristics of each of these
datasets, along with the unique features in them can
be seen in the following sub-sections.
4.1.1 MD Clínica
This dataset is from a dental clinic in Portugal and has
90 419 records. It comprises data from 1 January
2019 to 31 October 2019 with a no-show distribution
of 65% shows and 35% no-shows.
The features unique to this dataset were distance,
medic id, insurance id, part of the day and
appointment duration.
4.1.2 Brazil Dataset
This dataset was obtained online from Kaggle and
contains appointments from clinics in Brazil. It has
110 528 records and comprises data from 29 April
2016 to 8 June 2016 with a no-show distribution of
80% shows and 20% no-shows.
The unique features in this dataset are
neighbourhood, scholarship, hypertension, diabetes,
handicaps and SMS received.
4.1.3 Hospital da Luz
This dataset is from a private hospital in Portugal and
has 494 627 records. It comprises data from 2 January
2017 to 31 December 2017 with a no-show
distribution of 90% shows and 10% no-shows.
The unique features in this dataset are distance,
medic identifier, insurance identifier, part of the day,
district, speciality, whether it is the first appointment
or a follow-through and whether the appointment was
scheduled in person.
4.2 Prediction Algorithms
This section compares four prediction algorithms to
find out, which ones can provide more reliable
predictions. The four algorithms used are Artificial
Neural Network (ANN), Gradient Boosting (GB),
Logistic Regression (LR) and Random Forest (RF).
To compare the prediction algorithms, Boruta was
chosen as the feature selection algorithm. Boruta was
chosen because it uses the least amount of features
while achieving the same results has the other feature
selection techniques tested. Since most of these
datasets are imbalanced, a sampling technique for
balancing the datasets was used. This will allow the
prediction algorithms to find more no-shows and
increase recall at the cost of some precision. The
sampling technique chosen was SMOTE with Edited
Nearest Neighbours because this technique achieved
the best recall and f1-score than the other sampling
techniques tested. This algorithm was executed in a
10 fold cross-validation and the average scores for
each one of the prediction algorithms were obtained.
The results obtained for each dataset can be seen in
figures 5, 6 and 7, each one corresponding to a
different dataset.
No prediction algorithm was found to be better in
all the scenarios but the most consistent one is
Gradient Boosting. The ones with more precision are
Random Forest and Gradient Boosting while Logistic
Regression and Artificial Neural Network have more
recall. No prediction algorithm will be discarded with
the tests made, as larger datasets or different features
can change the type of results, this is especially the
case for Artificial Neural Network which needs many
data and computational power to learn efficiently.
A Machine Learning Approach for Real Time Prediction of Last Minute Medical Appointments No-shows
333
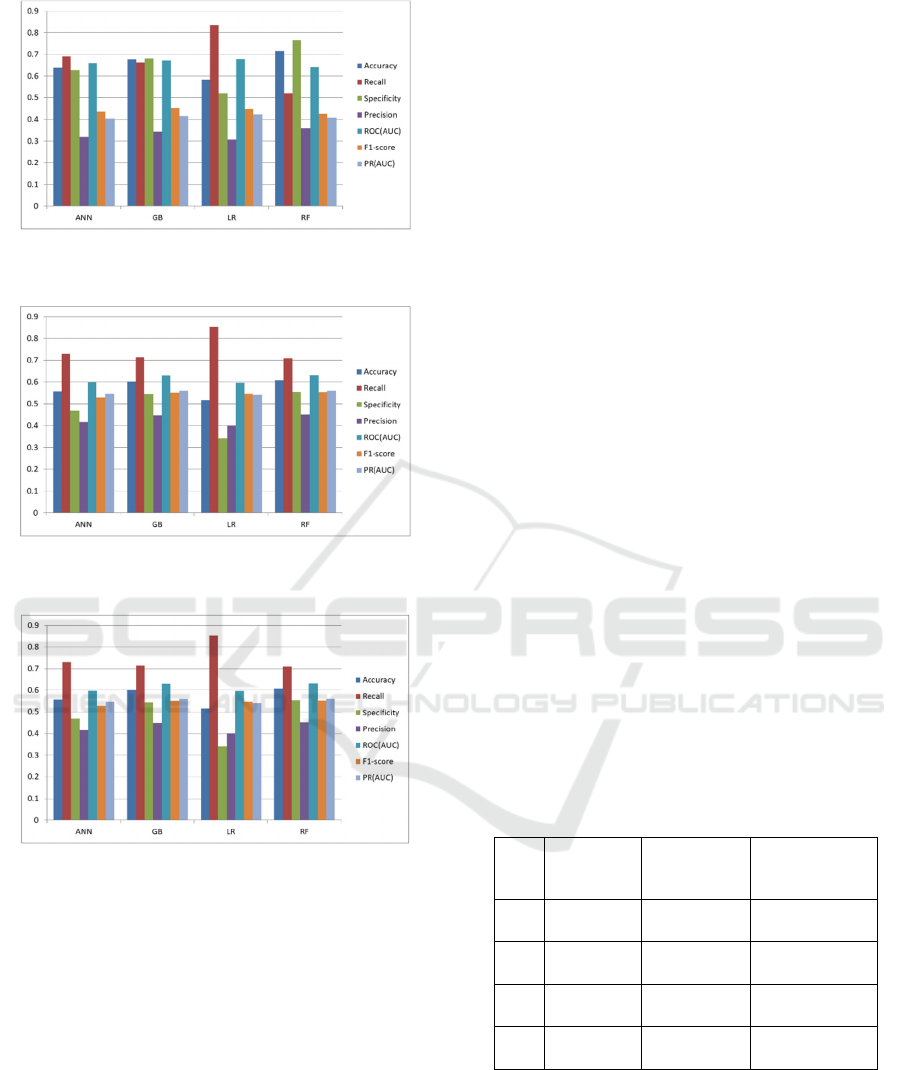
Figure 5: Results achieved by the prediction algorithms on
the dataset from Brazil.
Figure 6: Results achieved by the prediction algorithms on
the dataset from MD Clínica.
Figure 7: Results achieved by the prediction algorithms on
the dataset from Hospital da Luz.
4.3 Predicting Last Week of Dataset
This comparison was done using the last week of each
dataset for testing and the rest for training. A
threshold of 70% was also used, what this means is
that only no-shows with a probability of 70% or more
are considered no-shows. This is an attempt to mimic
a real-life scenario and find out how many no-shows
and misclassifications happen. The sampling
technique used was SMOTE with Edited Nearest
Neighbours and the feature selection was Boruta. In
the next table 1, we can see the comparison between
the confusion matrices for all datasets and prediction
algorithms. In all of the datasets, it is possible to see
that on average 50% of no-shows are found by the
prediction algorithms. The prediction algorithm that
finds more no-shows in all datasets is Artificial
Neural Network but it also has the highest number of
false positives. On the other hand, we have Random
Forest with the least number of false positives but the
least no-shows found, which translates to a more
conservative and precise approach.
In MD Clínica dataset we can see that on average for
every no-show found there is one false positive. The
prediction algorithm with the best results here is
Gradient Boosting since it finds almost as many no-
shows as Artificial Neural Network but at a much
smaller cost of false positives. The Random Forest
algorithm could also be used for a more conservative
approach, as it has the least amount of
misclassifications, making it the most precise of the
four.
In Brazil dataset, for every no-show found there is
slightly more than the double of false positives. The
prediction algorithms with the best results here are
Logistic Regression and Gradient Boosting with
similar results.
In the dataset from Hospital da Luz, there is almost
the triple of false positives compared to no-shows
found. It is possible to see that the more the original
dataset was imbalanced the more false positives are
to be expected. The best prediction algorithm here is
Gradient Boosting since it is even more precise than
Random Forest and finds more no-shows. Also, the
number of no-shows found is not that distant from
Artificial Neural Network but with less false
positives.
Table 1: Comparison of confusion matrices for all datasets
and prediction algorithms. The format is [TP FP][FN TN].
MD Clínica Brazil Hospital da Luz
ANN
[373 385]
[292 873]
[2285 5109]
[1785 12808]
[222 704]
[250 4335]
GB
[365 327]
[300 931]
[1981 4266]
[2089 13651]
[183 422]
[289 4617]
LR
[309 355]
[359 903]
[2088 4469]
[1982 13469]
[204 697]
[268 4342]
RF
[306 265]
[356 993]
[1755 4051]
[2315 13866]
[143 428]
[329 4611]
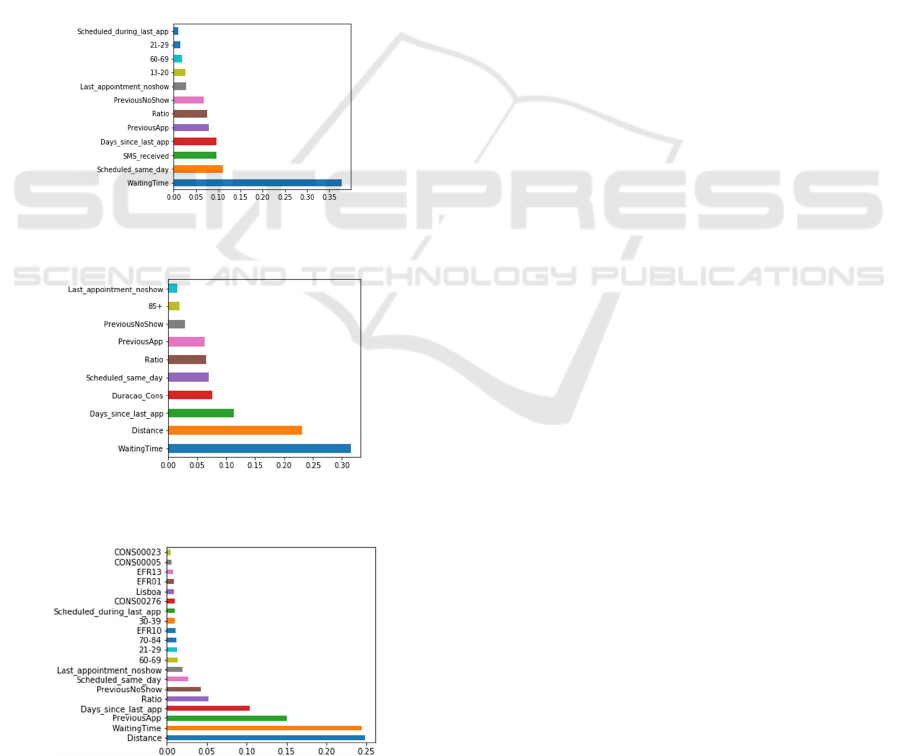
4.4 Feature Importance
After comparing the feature importance in each of the
datasets we can see that most of the chosen features
are similar. This means some constant features are
better at predicting no-shows. The most relevant
feature is waiting time, it seems the time from when
HEALTHINF 2021 - 14th International Conference on Health Informatics
334
the appointment was scheduled to the time of the
appointment is crucial to find no-shows. Another very
important feature is the distance, which has even
slightly more importance than waiting time in the
dataset from Hospital da Luz. This feature is the
distance between the postal code of residence and the
hospital.
Other relevant features are chosen in all the
datasets, which means these features are also very
important to accurately predict a no-show.
Some unique features of some datasets that got a
considerable value of importance are appointment
duration (Duracao_Cons), which is specific to the
appointments from MD Clínica and whether a
message was received (SMS_Received), which is
specific to the appointments from Brazil. These
features can lead to better results in the predictions
and, as such, an attempt should be made to make this
available on other datasets.
Figure 8: Feature importance graph for the dataset from
Brazil.
Figure 9: Feature importance graph for the dataset from MD
Clínica.
Figure 10: Feature importance graph for the dataset from
Hospital da Luz.
5 CONCLUSIONS
This research was done in the healthcare area
focusing on the no-show problem. It seeks to find and
implement a solution capable of reducing no-shows
and subsequently increase efficiency in the healthcare
providers. The three major contributions of this
research are next discussed.
The major contribution is the creation of a
prediction model to optimize and automate testing. A
prediction model was created to make the training of
new models and obtaining of predictions from
datasets easier and more efficient. Since all the
datasets come with different characteristics and
features, it would be required to change the code
every time. This way the pre-processing phase and
training phase were optimized, requiring a
configuration file only to train the model and to make
predictions. The prediction model was also integrated
into an online medical appointment booking platform
which is provided through an API.
Many new features were also added and tested in
an attempt to figure out which features are more
relevant and improve prediction results. Beyond this,
machine learning techniques were tested on different
datasets, in an attempt to find the techniques that
perform better overall.
The main conclusions that can be made come
from the results obtained. The first thing that can be
concluded is that the size of the dataset did not have
a large impact on results. What impacted more was
the type of features available and how much
imbalanced the dataset was.
The most important features are similar in every
dataset and the features that were considered more
important to identify no-shows are waiting time and
distance. Since all these datasets were imbalanced,
sampling techniques were used to counter this
problem. Using a sampling technique allowed the
prediction algorithms to find a much larger number of
no-shows, higher recall, but at the cost of being less
precise. Whether more precision is required or more
recall will depend upon the clinic or hospital strategy.
Some hospitals and clinics will want to keep waiting
time to a minimum and favour precision, while others
with less volume of patients might prefer higher
recall. Having a patient confirmation strategy
working alongside the no-show prediction system
will be very important to reduce many of these false
positives.
In the case of the prediction algorithms none of
them stands out but the one with more consistent
results overall was Gradient Boosting.
A Machine Learning Approach for Real Time Prediction of Last Minute Medical Appointments No-shows
335

The results obtained are far from ideal and more
features will be required to make these predictions
better. We conclude that these predictions can help
but are not still strong enough as a standalone strategy
and should be combined with other scheduling
strategies like patient confirmation.
ACKNOWLEDGMENTS
This work was supported by national funds through
Fundação para a Ciência e a Tecnologia (FCT) with
reference UIDB/50021/2020 and by the European
Commission program H2020 under the grant
agreement 822404 (project QualiChain).
The authors would like to acknowledge
MedClick for all the productive discussions and
insights given that shaped this work.
The authors would also like to express their
gratitude to Grupo Luz Saúde and MD Clínica for
providing access to their data which contributed
greatly to this research.
Last, the authors would also like to thank the
Information systems and technologies department
from Luz Saúde for their help.
REFERENCES
Sousa, D., Vasconcelos, A., 2020. ‘Last minute medical
appointments no-show management’. International
Journal of Healthcare Information Systems and
Informatics, Volume 15, Issue 4, ISSN: 1555-3396,
DOI: 10.4018/IJHISI.
Ferreira, I., Vasconcelos, A., 2019. “MedClick: Last
Minute Medical Appointments No-Show
Management”, 12th International Joint Conference on
Biomedical Engineering Systems and Technologies,
HEALTHINF (HEALTHINF 2019), Prague, Czech
Republic-"
Turkcan, A., Nuti, L., DeLaurentis, P.-C, Tian, Z., Daggy,
J., Zhang, L., Lawley, M., and Sands, L., 2013.
“Noshow modeling for adult ambulatory clinics”, in
Handbook of Healthcare Operations Management, pp.
251–288.
Alaeddini, A., Yang, K., Reeves, P., and Reddy, C. K.,
2015. “A hybrid prediction model for no-shows and
cancellations of outpatient appointments,” IIE
Transactions on Healthcare Systems Engineering, vol.
5, no. 1, pp. 14–32.
Elvira, C., Ochoa, A., Gonzálvez, J. C., and Mochón, F.,
2017. “Machine-Learning-Based No Show Prediction
in Outpatient Visits”, International Journal of
Interactive Multimedia and Artificial Intelligence, Vol.
4, Nº7.
Rinder, M. M., 2012. “An Integrated Decision-Support
Tool to Forecast and Schedule No-Show Appointments
in Healthcare”, Dissertation, Russ College of
engineering and Technology.
Neal, R. D., Hussain-Gambles, M., Allgar, V. L., Lawlor,
D. A., and Dempsey, O., 2005. “Reasons for and
consequences of missed appointments in general
practice in the UK: questionnaire survey and
prospective review of medical records.”.
Leong, K., Chen, W., Leong, K., Mastura, I., Mimi, O.,
Sheikh, M., Zailinawati, A., Ng, C., Phua, K. and Teng,
C., 2006. “The use of text messaging to improve
attendance in primary care: a randomized controlled
trial”.
Liew, S.-M., Tong, S., Lee, V., Ng, C., Leong, K. and Teng,
C., 2009. “Text messaging reminders to reduce
nonattendance in chronic disease follow-up: a clinical
trial”.
Daggy, J., Lawley, M., Willis, D., Thayer, D., Suelzer, C.,
DeLaurentis, P.-C., Turkcan, A., Chakraborty, S. and
Sands, L., 2010. “Using no-show modeling to improve
clinic performance”.
George, A. and Rubin, G., 2003: “Non-attendance in
general practice: a systematic review and its
implications for access to primary health care”.
Huang, Y. and Hanauer, D., 2014. “Patient no-show
predictive model development using multiple data
sources for an effective overbooking approach”,
Applied clinical informatics, vol. 5, pp. 836–60.
Dantas, L., Hamacher, S., Oliveira, F., Barbosa, S., Viegas,
F., 2018. “Predicting Patient No-show Behavior: a
Study in a Bariatric Clinic,” Obesity Surgery.
LaGanga LR, Lawrence SR, 2007. “Clinic overbooking to
improve patient access and increase provider
productivity,” Decis Sci. 38(2): 251–76.
Lee, V.J., Earnest, A., Chen, M.I., et al, 2005. “Predictors
of failed attendance in a multi-specialty outpatient
centre using electronic databases,” BMC Health Serv
Res. 5(1):51.
Bennett, K.J., Baxley, E.G, 2009. “The effect of a carve-out
advanced access scheduling system on no-show rates,”
Fam Med. ;41(1):51–6.
Norris, J.B., Kumar, C., Chand, S., et al, 2014. “An
empirical investigation into factors affecting patient
cancellations and no-shows at outpatient clinics,” Decis
Support Syst. 57:428–43.
Kursa, Miron B., Jankowski, A., Rudnicki, W., 2010.
“Boruta – A System for Feature Selection”,
Fundamenta Informaticae 101(4):271-285, DOI:
10.3233/FI-2010-288
Gustavo E. A. P. A. Batista, Ronaldo C. Prati, Maria
Monard, 2004. “A study of the behavior of several
methods for balancing machine learning training data”,
ACM SIGKDD Explorations Newsletter,
https://doi.org/10.1145/1007730.1007735.
HEALTHINF 2021 - 14th International Conference on Health Informatics
336
