
A Multi-level Rank Correlation Measure for Image Retrieval
Nikolas Gomes de S
´
a, Lucas Pascotti Valem and Daniel Carlos Guimar
˜
aes Pedronette
Department of Statistics, Applied Math. and Computing, S
˜
ao Paulo State University (UNESP), Rio Claro, Brazil
Keywords:
Content-based Image Retrieval, Rank Correlation, Unsupervised Learning, Information Retrieval.
Abstract:
Accurately ranking the most relevant elements in a given scenario often represents a central challenge in many
applications, composing the core of retrieval systems. Once ranking structures encode relevant similarity
information, measuring how correlated are two rank results represents a fundamental task, with diversified
applications. In this work, we propose a new rank correlation measure called Multi-Level Rank Correlation
Measure (MLCM), which employs a novel approach based on a multi-level analysis for estimating the cor-
relation between ranked lists. While traditional weighted measures assign more relevance to top positions,
our proposed approach goes beyond by considering the position at different levels in the ranked lists. The
effectiveness of the proposed measure was assessed in unsupervised and weakly supervised learning tasks for
image retrieval. The experimental evaluation considered 6 correlation measures as baselines, 3 different image
datasets, and multiple features. The results are competitive or, in most of the cases, superior to the baselines,
achieving significant effectiveness gains.
1 INTRODUCTION
Ranking tasks are ubiquitous in many aspects of
daily life: from arrangement of personal preferences
to modelling tool of priorities in enterprise environ-
ments (Webber et al., 2010). Many institutions keep
rankings of broad interest, aiming to guide decisions
in diversified domains, including books, universities,
artists, and many others. In fact, rankings represent
a powerful organization instrument in many scenar-
ios, allowing the definition of relationships among ob-
jects, according to a certain measure.
In artificial intelligence and information retrieval
applications, rankings have been widely used to rep-
resent the preferences of agents (humans or systems)
over a set of candidates (Xue et al., 2020). Due to
desired properties, as data reduction, independence
of scale and facilities for representation, rankings
and other ordinal data structures have been attract-
ing diverse applications (Farnoud Hassanzadeh and
Milenkovic, 2014).
As a result of the widely possibilities of applica-
tions, rankings are often needed to be compared. Such
comparisons often allow to infer the similarity of the
processes or systems which have generated the rank-
ings (Webber et al., 2010). Especially in information
retrieval, where information representation is often
supported by scores and ranked lists of items, the task
of performing comparison between two ranked lists
is of central importance (Yilmaz et al., 2008). This
relevance arises from distinct applications, includ-
ing comparison between rankings returned by dif-
ferent search engines, the lists of query recommen-
dation given by different algorithms (Vigna, 2015),
and complementarity between features in image re-
trieval (Valem and Pedronette, 2020).
In order to provide an objective and repeatable
comparison of ranked lists, it is needed to define a
rank correlation measure (Webber et al., 2010). In
fact, correlation coefficients are well-known statis-
tical tools, widely exploited in statistical analysis,
pattern recognition, and image processing. One of
the more traditional measures is the Pearson corre-
lation coefficient, which only measures linear depen-
dence relations (Couso et al., 2018). The rank cor-
relation measures or distances between permutations
have also a long and interdisciplinary history (Kumar
and Vassilvitskii, 2010; Fagin et al., 2004; Webber
et al., 2010).
The most popular rank correlation statistics are the
Kendall’s τ and Spearman correlation coefficient (Ku-
mar and Vassilvitskii, 2010). While the Spear-
man correlation is equivalent to L1 distance between
ranks, the Kendall’s τ between two ranked lists is pro-
portional to the number of pairwise inversions needed
to convert one ranking into the other (Yilmaz et al.,
2008; Kumar and Vassilvitskii, 2010). Both are orig-
inally non-weighted measures in the sense that they
370
Gomes de Sá, N., Valem, L. and Pedronette, D.
A Multi-level Rank Correlation Measure for Image Retrieval.
DOI: 10.5220/0010220903700378
In Proceedings of the 16th International Joint Conference on Computer Vision, Imaging and Computer Graphics Theory and Applications (VISIGRAPP 2021) - Volume 5: VISAPP, pages
370-378
ISBN: 978-989-758-488-6
Copyright
c
2021 by SCITEPRESS – Science and Technology Publications, Lda. All rights reserved

do not assign different weights to elements at top po-
sitions of ranked lists. With applications predomi-
nantly in information retrieval, various efforts have
been made in extending traditional measures to gen-
eralized weighted models (Couso et al., 2018; Okada
et al., 2015; Vigna, 2015).
In addition to weighted approaches of traditional
measures, many other rank correlation measures have
been proposed (Fagin et al., 2004; Tan and Clarke,
2015; Xue et al., 2020; Vigna, 2015). In a representa-
tive work (Fagin et al., 2004), the challenge of defin-
ing distance measures between top-k lists is addressed
considering different aspects. Various rank correla-
tion measures are presented under a unified frame-
work proposed to catalog them. The intersection met-
ric is firstly defined in this work, based on the size of
intersection between ranked lists at different depths.
This information is also exploited by the Rank-Biased
Overlap (RBO) measure (Webber et al., 2010). RBO
analyzes the overlap of two rankings at incrementally
increasing depths, considering a parameter that mod-
els the user persistence in considering the overlap at
the next level. The weight of the overlap measured at
each depth is computed based on these probabilities.
Other rank correlation measures were proposed
by exploiting information retrieval measures formu-
lations. In (Yilmaz et al., 2008), a rank correlation
measure based on the average precision (AP) is pro-
posed. In (Tan and Clarke, 2015), a family of rank
measures based on effectiveness is proposed, con-
sidering some analogies with RBO. The interest of
the research community on rank correlation measures
keeps active and novel measures have been proposed.
Recently, a novel framework (Xue et al., 2020) was
proposed based on the analysis of the consensus of
rankings by considering common patterns embedded
in a ranking set.
Among the diversified scenarios of applications,
image retrieval systems have been successfully em-
ploying rank-based analysis and rank correlation
measures in the last years (Qin et al., 2011; Chen
et al., 2014; Valem et al., 2018; Pedronette et al.,
2019). The rank correlation measures have been
mostly exploited in contextual distance/similarity
learning tasks. In fact, ranked lists represent a relevant
source of contextual information in retrieval tasks.
Different from traditional distance/similarity mea-
sures, which perform only pairwise analysis, ranked
lists establish relationships among sets of images.
In these scenarios, unsupervised learning algorithms
have been proposed to compute more effective dis-
tance/similarity measures based on comparisons of
ranked lists (Chen et al., 2014). Diverse rank corre-
lation measures have been used for this purpose and
studies have shown that the measure drastically im-
pacts the results (Okada et al., 2015).
This paper proposes a novel Multi-Level Correla-
tion Measure (MLCM) for rank comparisons in im-
age retrieval tasks. While weighted measures assign
more relevance to top positions, our proposed ap-
proach goes beyond by considering the position at
different levels in the ranked lists. A broad experi-
mental evaluation was conducted in order to assess
the effectiveness of the measure in image retrieval
tasks. The experiments were performed on three pub-
lic datasets considering different features and effec-
tiveness evaluation. Comparisons with traditional and
recent rank correlation measures were also conducted
and the proposed approach achieved the higher results
on most of the experiments.
The remaining of this paper is organized as fol-
lows. Section 2 describes the rank model used along
the paper, and Section 3 presents the rank correlation
measures proposed. Section 4 describes the exper-
imental evaluation and Section 5 discusses conclu-
sions and future work.
2 RANK MODEL DEFINITION
This section presents a formal definition of the rank-
ing model considered along the paper. Let C ={img
1
,
img
2
, . . . , img
n
} be an image collection, where n de-
notes the size of the collection.
A distance between two images img
i
, img
j
is de-
fined as ρ(i, j) and can be computed by different im-
age features. Based on the distance function ρ, a rank-
ing model can be derived. For a general image re-
trieval task, a ranked list τ
q
can be computed in re-
sponse to a query image img
q
, according to the dis-
tance function ρ. The top positions of ranked lists
are expected to contain the most relevant images with
regard to the query image, such that only the top-L
ranked images are considered, with L n.
The ranked list τ
q
can be formally defined as a
permutation (img
1
, img
2
, . . ., img
L
) of the subset
C
L
⊂ C , which contains the L most similar images
to a query image img
q
, such that |C
L
| = L. A per-
mutation τ
q
is a bijection from the set C
L
onto the
set [n
L
] = {1, 2, . . . , L}. The notation τ
q
(i) defines the
position (or rank) of image img
i
in the ranked list τ
q
.
Therefore, if img
i
is ranked before img
j
in the ranked
list of img
q
, i.e., τ
q
(i) < τ
q
( j), then ρ(q, i) ≤ ρ(q, j ).
Considering every image in the collection as a
query image, a set of ranked lists T = {τ
1
, τ
2
, . . . , τ
n
}
can be obtained. The ranked lists are used as input to
the rank correlation measures. The set T represents a
rich source of similarity information about the collec-
A Multi-level Rank Correlation Measure for Image Retrieval
371
tion, which can be exploited through rank correlation
measures in unsupervised learning tasks, as discussed
in the experimental evaluation.
3 MULTI-LEVEL CORRELATION
MEASURE
This section presents the proposed Multi-Level Cor-
relation Measure (MLCM). The key ideas and moti-
vations are introduced in Section 3.1. The formal def-
inition of MLCM is presented in Section 3.2, while
Section 3.3 discusses efficiency and complexity as-
pects.
3.1 Overview
In most of real-world information retrieval applica-
tions, both human and machines are interested in top-
k lists (Fagin et al., 2004). The size constraint allows
to handle the overhead of information and concentrate
on the essential. However, the definition of k often of-
fers a challenging trade-off. While small values can
ignore relevant information, large values can include
useless data or detrimental noise.
A natural way to reduce this problem is given by
weighted rank correlation measures (Vigna, 2015).
Assigning weights to top positions allows to consider
more information, once the low weights are assigned
to lower positions of ranked lists included in the anal-
ysis. Nevertheless, even for weighted measures, the
k continues to represent a binary boundary which
can exclude useful information right after the defined
threshold.
With the objective of proposing a novel alternative
to this problem, we propose a multi-level approach.
Firstly, the elements at the top-k positions of a ranked
list are considered. The co-occurrence of such ele-
ments are verified in the other ranked list, but con-
sidering a relaxed level, until the top-ck positions. In
the following, the same analysis is reciprocally per-
formed by inverting the ranked lists and the thresh-
olds. In this way, relevant elements at top-k positions
of one ranked list and just after k in the other ranked
list can also contribute positively to the correlation
analysis.
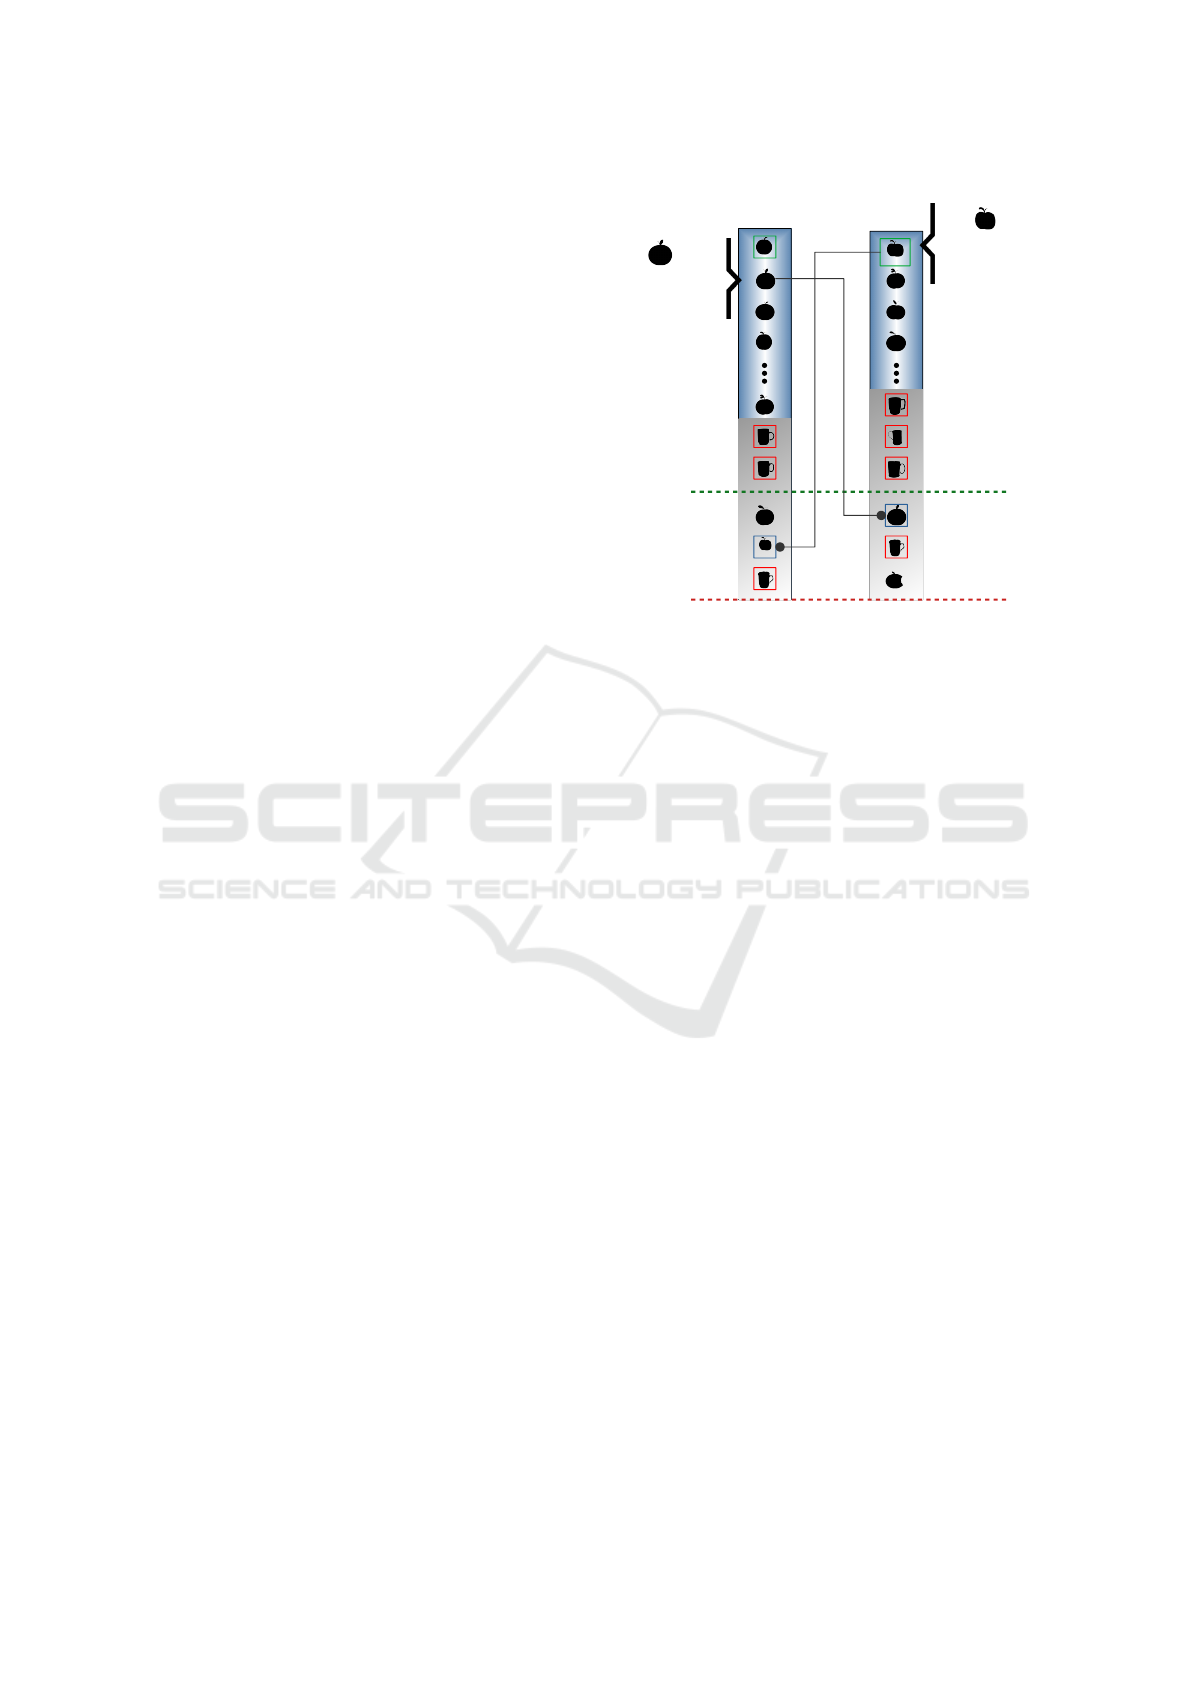
The proposed approach and its benefits are illus-
trated in Figure 1, representing the comparison be-
tween two ranked lists τ
i
and τ
j
. Analogous to typical
real-world ranked lists, the top positions present high-
effective results (in blue). In the following, a mixed
zone contains both relevant and non-relevant elements
(in gray). Both elements x and y are at top-k positions
y:
τ (y) = k+2ᵢ
τ (y)ⱼ = 1
k
x:
τ (x) = 2ᵢ
τ (x)ⱼ = k+1
ck
τj
τi
Figure 1: Multi-Level Correlation Measure (MLCM) ap-
plied to rank comparison between ranked lists τ
i
and τ
j
.
of one ranked list and at top-ck positions of the other
ranked list.
3.2 MLCM Formal Definition
This section formally defines the proposed MLCM
measure. The measure is computed considering the
top positions of ranked lists. Therefore, firstly we de-
fined a k-neighborhood set N (τ
i
, k), which contains
the k most similar images to img
i
. The set can be for-
mally defined according to our rank model as follows:
N (τ
i
, k) = {e : e ∈ S, S ⊆ C , |S| = k∧
∀x ∈ S, y ∈ (C − S ) : τ
i
(x) < τ
i
(y)}.
(1)
In order to characterize the multi-level behav-
ior of the measure, an extended intersection set
E(τ
i
, τ
j
, c, k) between ranked lists τ
i
and τ
j
is defined.
The set takes the ranked list τ
i
at a level of top-k po-
sitions, while takes the τ
j
at a lower level, of top-ck.
Formally, the set is defined as:
E(τ
i
, τ
j
, c, k) = N (τ
i
, k) ∩ N (τ
j
, c × k). (2)
The similarity between the ranked lists τ
i
and τ
j
is directly associated to the size of the extended in-
tersection set, once similar ranked lists are expected
to present co-occurrences at top positions. Beyond
that, the proposed MLCM measure assigns a weight
to each image in the set according to the position that
it appears in each ranked list.
An one-directional MLCM measure is defined by
the sum of products of weights assigned to each ele-
ment in the extended intersection set. The function µ
VISAPP 2021 - 16th International Conference on Computer Vision Theory and Applications
372

is formally defined as:
µ(τ
i
, τ
j
) =
∑
x∈E(τ
i
,τ
j
,c,k)
w
i
(x) × w
j
(x), (3)
where w
i
(x) denotes the weight of element img
x
in the
ranked list τ
i
. Higher weights are assigned to first po-
sitions, with an exponential formulation according to
the position of img
x
in the ranked list τ
i
. The function
is formally defined as:
w
i
(x) = p
τ
i
(x)
, (4)
where p is a parameter defined in the interval [0,1].
A low value of p reduces the weights of elements lo-
cated at lower positions of ranked lists.
The one-directional MLCM measure definition
given by the function µ(τ
i
, τ
j
, ) is not symmetric, due
to different levels defined in the ranked lists. There-
fore, we can verify that µ(τ
i
, τ
j
) 6= µ(τ
j
, τ
i
). In order
to solve this problem, making the function symmetric,
a bi-directional MLCM measure is defined as follows:
MLCM(τ
i
, τ
j
) = (1 − p) × µ(τ
i
, τ
j
) × µ(τ
j
, τ
i
). (5)
In addition to effectiveness, efficiency aspects are
crucial in real-world scenarios. The MLCM measure
can be also efficiently computed as discussed in the
next section.
3.3 Efficiency and Complexity Aspects
All the analysis computed by the MLCM measure are
constrained to the top-ck positions of ranked lists, and
therefore, independent of the collection size (n) or the
size of ranked lists (L). Such characteristic is crucial
to allow an efficient computation of the measure.
We consider a hash table data structure, for repre-
senting each ranked list. The structure allows to insert
and find elements in O(1) time complexity. Therefore
the construction of hash tables presents a complex-
ity of O(ck). In order to compute the extended in-
tersection set, for each element at top-k positions of
one ranked list, its presence in the other hash table
should be verified. Once each verification requires
O(1) complexity, the whole set can be computed in
O(k).
The computation of function µ (Equation 3) re-
quires to retrieve the position of each element in the
intersection set in both ranked lists. Again, using
the hash structure, the position can be computed in
O(1) for each element, totaling O(ck) for the whole
set. In this way, the MLCM can be fully computed
in O(ck), i.e, in linear time according to the extended
ck-neighborhood.
4 EXPERIMENTAL EVALUATION
This section presents a broad experimental evaluation
conducted to assess the effectiveness of the proposed
measure. Section 4.1 discusses aspects of the experi-
mental protocol, describing the datasets, features, and
the effectiveness measures considered in the exper-
iments. Section 4.2 evaluates the proposed MLCM
measure in weakly supervised scenarios, on the task
of identifying similarity relationships among images
of the same class. Section 4.3 evaluates MLCM in
unsupervised re-ranking tasks for image retrieval, in
comparison with other rank correlation measures.
4.1 Experimental Protocol
This subsection describes the experimental protocol
adopted in this work, including information about the
datasets, features, effectiveness measures, and param-
eter settings.
The experimental evaluation considered three
public datasets, with different characteristics and
sizes ranging from 1,360 to 5,000 images. The
datasets used were MPEG-7 (Latecki et al., 2000),
Flowers (Nilsback and Zisserman, 2008) and
Corel5k (Liu and Yang, 2013).
Multiple features were considered
1
, including
global, local, and deep learning ones. In the first set
of experiments, two features were used per dataset.
For the re-ranking evaluation, all the features were
considered. The employed Convolutional Neural
Networks (CNN) were all trained on the ImageNet
dataset. The implementations of these CNNs are pub-
licly available on the PyTorch framework
2
.
In the experimental evaluation, different well-
established effectiveness measures are considered,
such as Precision, Recall, F-Measure and Mean Av-
erage Precision (MAP).
4.1.1 Parameters Settings
The MLCM measure used the multi-level parameter
as c = 2 for all experiments. Regarding the similar-
ity relationships identification tasks (Section 4.2), the
MLCM measure used the parameter value as p=0.93.
The size of neighborhood k was used as k=10 for
MPEG-7 and k=50 for Corel5k and Flowers datasets.
The baseline measures used k=20 for MPEG-7 and
k=50 for the Corel5k and Flowers datasets.
For the unsupervised re-ranking tasks (Sec-
tion 4.3), the parameter p=0.96 was used in all ex-
1
For the MPEG-7 dataset, we have used the distances to
other images as features.
2
https://github.com/Cadene/pretrained-models.pytorch
A Multi-level Rank Correlation Measure for Image Retrieval
373

periments
3
. The neighborhood size k was defined as
k=20 for MPEG-7 and k=50 for Corel5k and Flow-
ers datasets. The re-ranking algorithm used T =2 for
MPEG7 and T =3 for Corel5k and Flowers datasets.
4.2 Similarity Relationships
Identification
This section presents the experimental evaluation of
MLCM measure on weakly supervised scenarios,
with the objective of identifying similar elements.
Section 4.2.1 describes the task while Section 4.2.2
presents the baselines. Section 4.2.3 discusses the re-
sults.
4.2.1 Task Description
In a weakly supervised scenario, where only a small
set of labeled images are available, identifying sim-
ilar images is of crucial relevance. In this way, we
evaluate the capacity of MLCM measure on identify-
ing similar elements (of the same class) in the dataset.
If two images have their ranked lists very correlated,
i.e, with a rank correlation measure greater than a cer-
tain threshold, we assume that they belong to the same
class. This assumption may be more or less accurate
depending on the effectiveness of each measure.
With the objective of analyzing the behavior of the
proposed measure, an experiment was conducted by
varying the threshold to evaluate the impact in the ef-
fectiveness measures. High values of threshold lead
to small or insignificant expansions. On the other
hand, as the values decrease, the number of images
contained in the expanded set also increases. How-
ever, it tends to incorporate incorrect images in this
set as well, which can be especially harmful to the ac-
curacy results. This trade-off can be analyzed through
Precision and Recall measures.
4.2.2 Compared Rank Correlation Measures
Six correlation measures often used in the lit-
erature were considered as baselines and have
their results compared to MLCM measure. The
measures used were Intersection (Fagin et al.,
2003), Jaccard (Levandowsky and Winter, 1971),
Jaccard
k
(Okada et al., 2015), Kendallτ (Fagin et al.,
2003), Spearman (Fagin et al., 2003) and RBO (Web-
ber et al., 2010).
3
Except for AIR features on the MPEG-7 dataset, which
used p=0.81
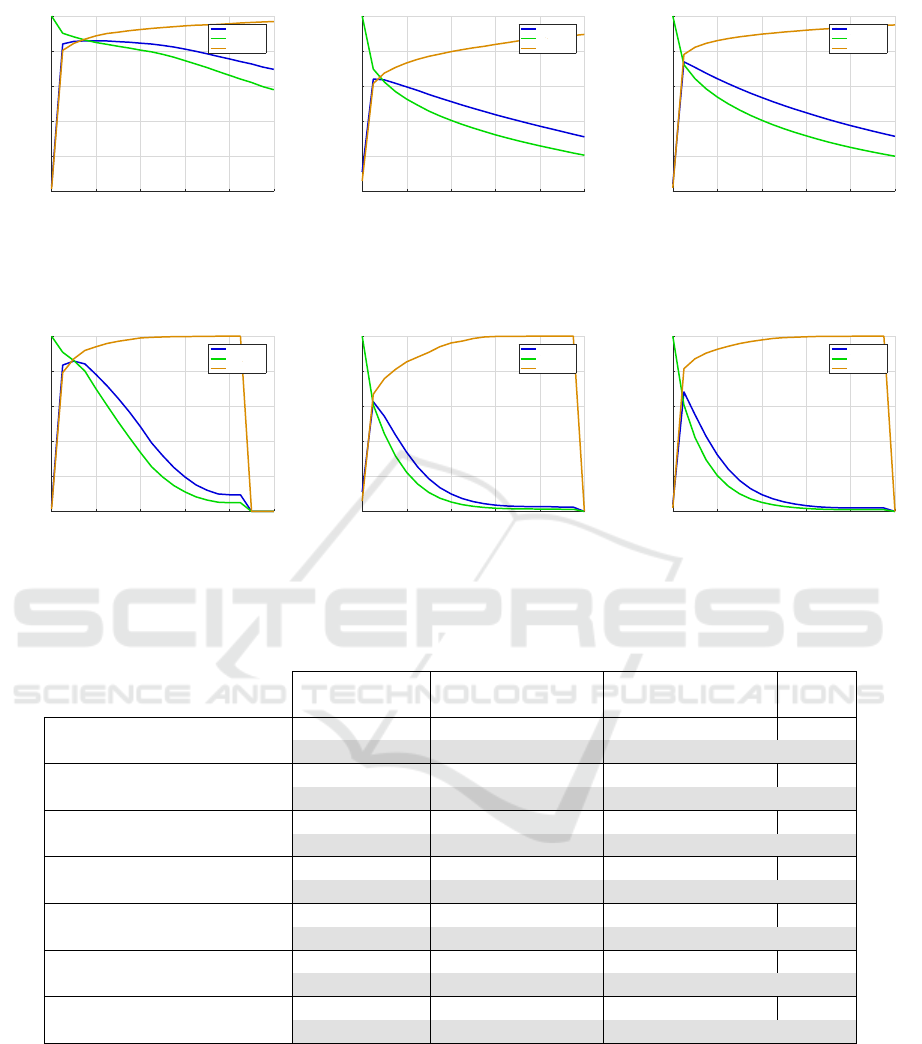
4.2.3 Results and Discussion
Firstly, we evaluate the impact of threshold varia-
tion on Precision, Recall, and F-Measure. The curves
were reported in according to the threshold variation
in the interval [0, 1]. Figures 2 and 3 report the results
for the datasets MPEG-7, Flowers and Corel5K. The
features used were ASC for MPEG-7 and RESNET
for Flowers, and Corel5K. For comparison purposes,
we also report the results obtained by RBO measures
considering the same scenario. We can observe that
MLCM results are more stable to threshold variations
when considering F-Measure. RBO often achieves
higher precision scores, but with smaller recall scores.
In opposite, MLCM combine better both measures,
which leads to higher F-Measure scores.
The threshold that achieved the highest F-measure
for each measure/feature/dataset is reported in Ta-
ble 1. The results with the two best F-Measure values
are highlighted in bold for each feature and dataset
with the corresponding threshold. As we can observe,
the results obtained by MLCM are very significant,
since F-Measure is practically always between the
two best results, which does not occur for any other
metric. The average F-measure is presented for each
measure and it is noticeable that MLCM presented
the highest mean as well. We can also observe that,
in comparison to the RBO measure, MLCM achieved
superior or comparable results in all the cases.
4.3 Unsupervised Re-ranking on Image
Retrieval Tasks
This section discusses the evaluation of MLCM mea-
sure on unsupervised re-ranking tasks of image re-
trieval. Section 4.3.1 provides more details about the
task. Section 4.3.2 discusses the results and 4.3.3
present some visual results.
4.3.1 Task Description
Despite the huge advances on image retrieval
achieved in last decades, mainly supported by deep
learning technologies, computing effective similar-
ity measures remains a challenging tasks. In this
scenario, various approaches have been proposed
for post-processing image similarities through more
global a contextual analysis. Such unsupervised re-
ranking approaches provides an attractive solution,
capable of significantly improving the retrieval results
without the use of any labeled data.
The RL-Sim* (Okada et al., 2015) method is an
unsupervised re-ranking algorithm that relies on a
VISAPP 2021 - 16th International Conference on Computer Vision Theory and Applications
374
0 0.2 0.4 0.6 0.8 1
0
0.2
0.4
0.6
0.8
1
Effectiveness Scores for Different Thresholds
Effectiveness Measure
Threshold
F Measure
Recall
Precision
0 0.2 0.4 0.6 0.8 1
0
0.2
0.4
0.6
0.8
1
Effectiveness Scores for Different Thresholds
Effectiveness Measure
Threshold
F Measure
Recall
Precision
0 0.2 0.4 0.6 0.8 1
0
0.2
0.4
0.6
0.8
1
Effectiveness Scores for Different Thresholds
Effectiveness Measure
Threshold
F Measure
Recall
Precision
(a) MPEG-7 (b) Flowers (c) Corel5k
Figure 2: Precision, Recall and F-Measure obtained for MLCM measure considering different thresholds. Results for MPEG-
7 - ASC, Flowers - RESNET, and Corel5k - RESNET, respectively.
0 0.2 0.4 0.6 0.8 1
0
0.2
0.4
0.6
0.8
1
Effectiveness Measure
Effectiveness Scores for Different Thresholds
F Measure
Recall
Precision
Threshold
0 0.2 0.4 0.6 0.8 1
0
0.2
0.4
0.6
0.8
1
Effectiveness Scores for Different Thresholds
Effectiveness Measure
Threshold
F Measure
Recall
Precision
0 0.2 0.4 0.6 0.8 1
0
0.2
0.4
0.6
0.8
1
Effectiveness Scores for Different Thresholds
Effectiveness Measure
Threshold
F Measure
Recall
Precision
(a) MPEG-7 (b) Flowers (c) Corel5k
Figure 3: Precision, Recall and F-Measure obtained for RBO measure considering different thresholds. Results for MPEG-7
- ASC, Flowers - RESNET, and Corel5k - RESNET, respectively.
Table 1: F-Measure results: maximum F-Measure achieved by each rank correlation measure on different datasets.
MPEG-7 Flowers Corel5k
Mean
ASC CFD ACC RESNET ACC RESNET
MLCM
F-Measure 0.859 0.849 0.247 0.641 0.287 0.739 0.6037
Threshold 0.2 0.15 0.05 0.05 0.05 0.05 —
Intersection
F-Measure 0.850 0.838 0.226 0.633 0.286 0.759 0.5987
Threshold 0.3 0.25 0.05 0.05 0.15 0.15 —
Jaccard
F-Measure 0.825 0.810 0.243 0.616 0.281 0.756 0.5885
Threshold 0.3 0.25 0.1 0.15 0.1 0.1 —
Jaccard
k
F-Measure 0.853 0.842 0.248 0.626 0.289 0.759 0.6028
Threshold 0.15 0.1 0.05 0.05 0.05 0.05 —
Kendalτ
F-Measure 0.809 0.802 0.241 0.618 0.27 0.697 0.5728
Threshold 0.4 0.4 0.3 0.35 0.3 0.35 —
RBO
F-Measure 0.858 0.849 0.232 0.626 0.268 0.682 0.5858
Threshold 0.1 0.1 0.05 0.05 0.05 0.05 —
Spearman
F-Measure 0.851 0.838 0.245 0.633 0.286 0.759 0.6020
Threshold 0.3 0.25 0.15 0.15 0.15 0.15 —
correlation measure in order to compute a new sim-
ilarity score among images by comparing their kNN
sets. In this section, the proposed MLCM measure
is evaluated on re-ranking tasks through the RL-Sim*
algorithm. The evaluation is conducted considering
several recent deep learning features. We used the
RL-Sim* implementation available on the Unsuper-
vised Distance Learning Framework (UDLF) (Valem
and Pedronette, 2017). The RBO measure was also
considered as a baseline for this evaluation.
4.3.2 Results and Discussion
Tables 2, 3, and 4 present the results for re-
ranking tasks on MPEG-7, Corel5k and Flowers
datasets. Different effectiveness measures are
A Multi-level Rank Correlation Measure for Image Retrieval
375

Table 2: Effectiveness evaluation of MLCM compared to RBO, considering different measures on MPEG-7 dataset.
MPEG-7 Effectiveness
Descriptors Measures P@10 P@15 P@20 P@30 P@50 P@100 Recall@40 MAP
AIR MLCM 0.96 0.953 0.939 0.657 0.4 0.2 1.0 0.969
(Gopalan et al., 2010) RBO 0.951 0.949 0.939 0.656 0.4 0.2 0.999 0.961
ASC MLCM 0.927 0.904 0.874 0.619 0.382 0.194 0.946 0.908
(Ling et al., 2010) RBO 0.924 0.903 0.878 0.617 0.381 0.194 0.946 0.907
BAS MLCM 0.842 0.786 0.734 0.536 0.341 0.179 0.834 0.778
(Arica and Vural, 2003) RBO 0.831 0.781 0.735 0.534 0.34 0.178 0.834 0.774
CFD MLCM 0.934 0.907 0.878 0.621 0.384 0.195 0.949 0.912
(Pedronette and da S. Torres, 2010) RBO 0.929 0.906 0.879 0.617 0.382 0.194 0.944 0.909
IDSC MLCM 0.91 0.875 0.845 0.605 0.373 0.191 0.925 0.882
(Ling and Jacobs, 2007) RBO 0.907 0.875 0.851 0.603 0.373 0.191 0.925 0.882
SS MLCM 0.55 0.478 0.424 0.332 0.227 0.13 0.539 0.458
(da S. Torres and Falc
˜
ao, 2007) RBO 0.538 0.465 0.417 0.328 0.224 0.128 0.531 0.451
Table 3: Effectiveness evaluation of MLCM compared to RBO, considering different measures on Corel5k dataset.
Corel5k Effectiveness
Descriptors Measure P@10 P@15 P@20 P@30 P@50 P@100 Recall@40 MAP
CNN-BnInception MLCM 0.895 0.882 0.872 0.855 0.823 0.716 0.336 0.739
(Ioffe and Szegedy, 2015) RBO 0.887 0.871 0.858 0.837 0.801 0.691 0.328 0.712
CNN-DPNet MLCM 0.905 0.893 0.885 0.87 0.846 0.776 0.343 0.807
(Chen et al., 2017) RBO 0.899 0.886 0.876 0.859 0.831 0.754 0.338 0.785
CNN-FBResNet MLCM 0.924 0.914 0.906 0.895 0.872 0.804 0.354 0.836
(He et al., 2016) RBO 0.913 0.9 0.891 0.878 0.855 0.776 0.347 0.809
CNN-ResNet MLCM 0.923 0.912 0.904 0.891 0.867 0.794 0.352 0.829
(He et al., 2016) RBO 0.919 0.905 0.895 0.879 0.854 0.771 0.347 0.808
CNN-ResNeXt MLCM 0.921 0.911 0.904 0.891 0.869 0.795 0.352 0.827
(Xie et al., 2017) RBO 0.915 0.903 0.894 0.878 0.852 0.771 0.346 0.804
CNN-VGGNet MLCM 0.874 0.858 0.846 0.824 0.788 0.678 0.322 0.705
(Liu and Deng, 2015) RBO 0.863 0.844 0.83 0.806 0.765 0.657 0.314 0.679
CNN-Xception MLCM 0.891 0.877 0.867 0.851 0.82 0.723 0.335 0.737
(Chollet, 2017) RBO 0.883 0.866 0.853 0.834 0.8 0.7 0.327 0.714
Table 4: Effectiveness evaluation of MLCM compared to RBO, considering different measures on Flowers dataset.
Flowers Effectiveness
Descriptors Measure P@10 P@15 P@20 P@30 P@50 P@100 Recall@40 MAP
CNN-BnInception MLCM 0.863 0.845 0.829 0.801 0.749 0.578 0.387 0.71
(Ioffe and Szegedy, 2015) RBO 0.853 0.834 0.817 0.791 0.748 0.58 0.386 0.704
CNN-DPNet MLCM 0.85 0.832 0.817 0.791 0.747 0.577 0.385 0.702
(Chen et al., 2017) RBO 0.842 0.818 0.805 0.779 0.735 0.58 0.379 0.69
CNN-FBResNet MLCM 0.871 0.854 0.841 0.819 0.774 0.591 0.398 0.734
(He et al., 2016) RBO 0.857 0.838 0.824 0.802 0.76 0.594 0.391 0.72
CNN-ResNet MLCM 0.857 0.838 0.825 0.802 0.759 0.587 0.391 0.723
(He et al., 2016) RBO 0.851 0.831 0.818 0.795 0.753 0.592 0.387 0.715
CNN-ResNeXt MLCM 0.852 0.839 0.825 0.804 0.766 0.593 0.392 0.727
(Xie et al., 2017) RBO 0.844 0.827 0.812 0.789 0.748 0.589 0.384 0.709
CNN-VGGNet MLCM 0.779 0.755 0.735 0.702 0.646 0.487 0.338 0.591
(Liu and Deng, 2015) RBO 0.775 0.749 0.728 0.695 0.639 0.487 0.333 0.583
CNN-Xception MLCM 0.826 0.803 0.788 0.761 0.713 0.559 0.368 0.677
(Chollet, 2017) RBO 0.819 0.796 0.777 0.748 0.7 0.555 0.361 0.665
considered: Precision, Recall and MAP. It can be
observed that MLCM achieved the best results in
most of the evaluated features and effectiveness mea-
sures. The MLCM measure also reaches the
highest MAP scores for the three datasets.
VISAPP 2021 - 16th International Conference on Computer Vision Theory and Applications
376

(a) Re-Ranking by RBO measure.
(b) Re-Ranking by MLCM measure.
Figure 4: Visual results before and after RL-Sim* Re-Ranking computed by RBO and MLCM measures on MPEG-7 dataset.
4.3.3 Visual Results
Visual retrieval results for MPEG-7 dataset are illus-
trated on Figure 4. The figure shows the results before
and after the application RL-Sim* re-ranking algo-
rithm considering both the RBO and MLCM rank cor-
relation measures. The query image is illustrated in a
green board. The ranked lists obtained are presented
on the right, with incorrect images in red borders. Re-
markable effectiveness gains can be observed.
5 CONCLUSIONS
In this work, a novel rank correlation measure is pro-
posed, capable of exploiting multi-level information
of ranked lists. A diversified experimental evaluation
showed that the proposed MLCM measure achieves
results comparable or superior to other relevant mea-
sures. As future work, we intend to evaluate other re-
trieval scenarios (e.g. video, sound, and text retrieval
for example).
ACKNOWLEDGEMENTS
The authors are grateful to S
˜
ao Paulo Research
Foundation - FAPESP (grants #2018/15597-6,
#2017/25908-6, #2019/11104-8, and #2020/11366-
0), Brazilian National Council for Scientific
and Technological Development - CNPq (grant
#308194/2017-9) and Microsoft Research.
REFERENCES
Arica, N. and Vural, F. T. Y. (2003). BAS: a perceptual
shape descriptor based on the beam angle statistics.
Pattern Recognition Letters, 24(9-10):1627–1639.
Chen, Y., Li, J., Xiao, H., Jin, X., Yan, S., and Feng, J.
(2017). Dual path networks. In Guyon, I., Luxburg,
U. V., Bengio, S., Wallach, H., Fergus, R., Vish-
wanathan, S., and Garnett, R., editors, Advances in
Neural Inf. Processing Systems, pages 4467–4475.
Chen, Y., Li, X., Dick, A., and Hill, R. (2014). Ranking
consistency for image matching and object retrieval.
Pattern Recognition, 47(3):1349 – 1360.
Chollet, F. (2017). Xception: Deep learning with depthwise
separable convolutions. In 2017 IEEE Conference
on Computer Vision and Pattern Recognition (CVPR),
pages 1800–1807.
Couso, I., Strauss, O., and Saulnier, H. (2018). Kendall’s
rank correlation on quantized data: An interval-valued
approach. Fuzzy Sets and Systems, 343:50 – 64.
da S. Torres, R. and Falc
˜
ao, A. X. (2007). Contour Salience
Descriptors for Effective Image Retrieval and Analy-
sis. Image and Vision Computing, 25(1):3–13.
Fagin, R., Kumar, R., Mahdian, M., Sivakumar, D., and
Vee, E. (2004). Comparing and aggregating rankings
with ties. In 23th ACM SIGMOD Symposium on Prin-
ciples of Database Systems (PODS’04), pages 47–58.
Fagin, R., Kumar, R., and Sivakumar, D. (2003). Compar-
ing top k lists. In SODA’03, pages 28–36.
Farnoud Hassanzadeh, F. and Milenkovic, O. (2014). An
axiomatic approach to constructing distances for rank
comparison and aggregation. IEEE Transactions on
Information Theory, 60(10):6417–6439.
Gopalan, R., Turaga, P., and Chellappa, R. (2010).
Articulation-invariant representation of non-planar
shapes. In ECCV’2010, volume 3, pages 286–299.
He, K., Zhang, X., Ren, S., and Sun, J. (2016). Deep resid-
ual learning for image recognition. In IEEE CVPR
2016, pages 770–778.
Ioffe, S. and Szegedy, C. (2015). Batch normalization: Ac-
celerating deep network training by reducing internal
covariate shift. In ICML’2015, pages 448–456.
Kumar, R. and Vassilvitskii, S. (2010). Generalized dis-
tances between rankings. In Proceedings of the 19th
International Conference on World Wide Web, WWW
’10, page 571–580.
Latecki, L. J., Lakmper, R., and Eckhardt, U. (2000). Shape
descriptors for non-rigid shapes with a single closed
contour. In CVPR, pages 424–429.
A Multi-level Rank Correlation Measure for Image Retrieval
377

Levandowsky, M. and Winter, D. (1971). Distance between
sets. Nature, 243:34 – 35.
Ling, H. and Jacobs, D. W. (2007). Shape classification
using the inner-distance. PAMI, 29(2):286–299.
Ling, H., Yang, X., and Latecki, L. J. (2010). Balancing de-
formability and discriminability for shape matching.
In ECCV, volume 3, pages 411–424.
Liu, G.-H. and Yang, J.-Y. (2013). Content-based image
retrieval using color difference histogram. Pattern
Recognition, 46(1):188 – 198.
Liu, S. and Deng, W. (2015). Very deep convolutional
neural network based image classification using small
training sample size. In ACPR 2015, pages 730–734.
Nilsback, M.-E. and Zisserman, A. (2008). Automated
flower classification over a large number of classes.
Computer Vision, Graphics and Image Processing,
pages 722–729.
Okada, C. Y., Pedronette, D. C. G., and da S. Torres,
R. (2015). Unsupervised distance learning by rank
correlation measures for image retrieval. In ACM
ICMR’2015, pages 331–338.
Pedronette, D. C. G. and da S. Torres, R. (2010). Shape
retrieval using contour features and distance optmiza-
tion. In VISAPP, volume 1, pages 197 – 202.
Pedronette, D. C. G., Valem, L. P., Almeida, J., and da S.
Torres, R. (2019). Multimedia retrieval through un-
supervised hypergraph-based manifold ranking. IEEE
Trans. on Image Processing, 28(12):5824–5838.
Qin, D., Gammeter, S., Bossard, L., Quack, T., and van
Gool, L. (2011). Hello neighbor: Accurate object re-
trieval with k-reciprocal nearest neighbors. In CVPR,
pages 777 –784.
Tan, L. and Clarke, C. L. A. (2015). A family of rank simi-
larity measures based on maximized effectiveness dif-
ference. IEEE Transactions on Knowledge and Data
Engineering, 27(11):2865–2877.
Valem, L. P., Oliveira, C. R. D., Pedronette, D. C. G. a., and
Almeida, J. (2018). Unsupervised similarity learning
through rank correlation and knn sets. ACM Trans.
Multimedia Comput. Commun. Appl., 14(4).
Valem, L. P. and Pedronette, D. C. G. (2020). Unsupervised
selective rank fusion for image retrieval tasks. Neuro-
computing, 377:182–199.
Valem, L. P. and Pedronette, D. C. G. a. (2017). An un-
supervised distance learning framework for multime-
dia retrieval. In ACM on International Conference on
Multimedia Retrieval, ICMR ’17, pages 107–111.
Vigna, S. (2015). A weighted correlation index for rankings
with ties. In International Conf. on World Wide Web,
WWW ’15, page 1166–1176.
Webber, W., Moffat, A., and Zobel, J. (2010). A similarity
measure for indefinite rankings. ACM Transactions on
Information Systems, 28(4):20:1–20:38.
Xie, S., Girshick, R., Doll
´
ar, P., Tu, Z., and He, K. (2017).
Aggregated residual transformations for deep neural
networks. In IEEE CVPR 2017.
Xue, Z., Lin, Z., Wang, H., and McClean, S. (2020). Quan-
tifying consensus of rankings based on q-support pat-
terns. Information Sciences, 518:396 – 412.
Yilmaz, E., Aslam, J. A., and Robertson, S. (2008). A new
rank correlation coefficient for information retrieval.
In ACM SIGIR 2008, page 587–594.
VISAPP 2021 - 16th International Conference on Computer Vision Theory and Applications
378
