
Interpretation of Human Behavior from Multi-modal Brain MRI Images
based on Graph Deep Neural Networks and Attention Mechanism
Refka Hanachi
1 a
, Akrem Sellami
2 b
and Imed Riadh Farah
1,3 c
1
RIADI Laboratory, ENSI, University of Manouba, Manouba, 2010, Tunisia
2
LORIA Laboratory, University of Lorraine and INRIA/CNRS, UMR 7503, Campus Scientifique,
615 Rue du Jardin-Botanique, F-54506 Vandœuvre-l
`
es-Nancy, France
3
ITI Department, IMT Atlantique, 655 Avenue du Technop
ˆ
ole, F-29280 Plouzan
´
e, France
Keywords:
Brain MRI Images, Dimensionality Reduction, Feature Extraction, Multi-view Graph Autoencoder, Behavior
Human Interpretation.
Abstract:
Interpretation of human behavior by exploiting the complementarity of the information offered by multi-
modal functional magnetic resonance imaging (fMRI) data is a challenging task. In this paper, we propose
to fuse task-fMRI for brain activation and rest-fMRI for functional connectivity with the incorporation of
structural MRI (sMRI) as an adjacency matrix to maintain the rich spatial structure between voxels of the
brain. We consider then the structural-functional brain connections (3D mesh) as a graph. The aim is to
quantify each subject’s performance in voice recognition and identification. More specifically, we propose
an advanced multi-view graph auto-encoder based on the attention mechanism called MGATE, which seeks
at learning better representation from both modalities task- and rest-fMRI using the Brain Adjacency Graph
(BAG), which is constructed based on sMRI. It yields a multi-view representation learned at all vertices of
the brain, which be used as input to our trace regression model in order to predict the behavioral score of
each subject. Experimental results show that the proposed model achieves better prediction rates, and reaches
competitive high performances compared to various existing graph representation learning models in the state-
of-the-art.
1 INTRODUCTION
Human beings were born differently when two brains
do not cross in response to a given task, such as
reading words, voice recognition, intelligence, etc.
This distinction constitutes the pursuit of neuroscien-
tists for which they are concerned in analyzing the
complex human brain activity related to such tasks,
characterizing and mapping then individual differ-
ences to provide a specific relationship between brain
and behavior that could be interpreted using only
brain imaging techniques that have dominated the
neuroscience research from the Electroencephalog-
raphy (EEG) modality to the current state-of-the-art
Magnetic Resonance Imaging (MRI) modality yield-
ing in two categories of analysis: structural MRI
(sMRI) that describes the pathology and the structure
of the brain to provide static anatomical information
a
https://orcid.org/0000-0001-8244-3574
b
https://orcid.org/0000-0003-1534-1687
c
https://orcid.org/0000-0001-9114-5659
(M Symms and Yousry, 2004) and functional MRI
(fMRI) which depicts brain activity by detecting the
associated changes in brain hemodynamics (Liu et al.,
2015).
Recent advances, crucially fMRI has been key to
our understanding of the brain functions by mapping
neural activity when an explicit task is being per-
formed (task-fMRI) and its dysfunctions assessing re-
gional interactions or functional connectivity that oc-
cur in a resting or task-negative state (rest-fMRI). In
this regard, several studies have been conducted, in
which primary methods (Mihalik et al., 2019), (Kiehl
and VD, 2008) rely on univariate correlation analy-
sis to make such a relationship between a single MRI
modality and a behavioral score in the assessment of
individual differences. Collecting multi-modal brain
MRI from the same subject can effectively capitalize
on the intensity of each imaging modality and provide
a comprehensive perspective into the brain (Sui et al.,
2012), (Sui et al., 2015) for which fMRI has enabled a
wide-ranging analysis in examining individual differ-
56
Hanachi, R., Sellami, A. and Farah, I.
Interpretation of Human Behavior from Multi-modal Brain MRI Images based on Graph Deep Neural Networks and Attention Mechanism.
DOI: 10.5220/0010214400560066
In Proceedings of the 16th International Joint Conference on Computer Vision, Imaging and Computer Graphics Theory and Applications (VISIGRAPP 2021) - Volume 4: VISAPP, pages
56-66
ISBN: 978-989-758-488-6
Copyright
c
2021 by SCITEPRESS – Science and Technology Publications, Lda. All rights reserved

ences in numerous application areas such as the face
selectivity (Saygin et al., 2012), the clinical initiative
to classify individual subjects either as patients or as
controls (Du W, 2012), etc.
However, the noisy nature and vast amount of
multi-modal imaging data pose various challenges to
accurate analysis for which the dimensionality may
become awkward. A rigorous approach to this con-
sists of applying dedicated dimensionality reduction
methods to increase comprehensibility and improve
the model’s performance by disposing of unusable
and irrelevant features (Sellami et al., 2019), (Sell-
ami et al., 2020). To tackle such a challenge, various
studies (Du W, 2012), (Tavor et al., 2016) performed
feature extraction based on standard methods such as
Principal Component Analysis (PCA), Independent
Component Analysis (ICA) operating on regular data
in a grid-sampled structure. Nevertheless, with the
development of technology and the huge amount of
data available in real-world applications, representa-
tion learning has gained significant attention, which
is based on neural networks in order to learn a func-
tion for a better representation of data that facilitates
the extraction of functional information when design-
ing predictive models.
In this paper, we present a new multi-modal graph
representation learning method that seeks at learning
a latent space from the combination of the activation-
based information (task-fMRI), connectivity (rest-
fMRI), and spatial structure (sMRI) estimated from
brain MRI images in order to improve the inter-
pretation of human behavior. To do so, we opted
for an advanced multi-view graph autoencoder based
on attention mechanism (MGATE) that automatically
learns latent representation extracted from both fMRI
modalities by considering the brain adjacency graph
(BAG) in order to deal with the non-Euclidean nature
of neuroimaging data. This multi-view representation
learned at all vertices of the bain has been used as
input to our predictive model that quantifies the be-
havioral score of each subject.
The remainder of the paper is organized as fol-
lows: Section 2 describes related work on multi-view
graph representation learning methods. Section 3 re-
veals in detail our proposed method based on the
multi-view graph attention autoencoder and the pre-
dictive trace regression model. Section 4 presents our
experimental protocol and discusses obtained results
over the InterTVA dataset. Finally, Section 5 con-
cludes our findings.
2 RELATED WORK
In this section, we briefly review some of the numer-
ous models dedicated to studying multi-modal repre-
sentation learning based on deep feed-forward neural
networks operating on Euclidean and non-Euclidean
data (graph).
2.1 Representation Learning based on
Euclidean Data
With the advances of deep learning applications, vari-
ous methods have justified the use of the complemen-
tarity in existing data, exposing essential dependency
unable to monitor with a single modality. Multi-
view representation learning is a key research topic
that integrates the derived information from specific
unimodal data into a single compact representation
where it is presumed that such a latent representa-
tion space is descriptive enough to reconstruct the
corresponding views (Li et al., 2019) (Zhao et al.,
2017). Hence, we discern three major neural network
approaches: Autoencoder (AE), Canonical Correla-
tion Analysis (CCA), and Convolutional Neural Net-
work (CNN). The AE is used for the reconstruction
of a given input from its latent representation. Com-
pared to single-view AE, learning latent representa-
tion through multiple modalities (views) has become
a growing interest for which, (Ngiam et al., 2011)
proposed a multi-modal deep autoencoder (MDAE)
that extracts shared representations via training a bi-
modal deep autoencoder. It consists of two separate
inputs X , Y , and outputs
ˆ
X,
ˆ
Y views (audio and video),
where each view is allocated separate hidden layers
and then uses the concatenated final hidden layer of
both views as input and maps them to a common rep-
resentation layer. CCA seeks to learn separate repre-
sentations for the input modalities while maximizing
their correlation (Yang et al., 2017). Moreover, a deep
CCA (DCCA) technique has been developed to take
into account the non-linearity of data (Andrew et al.,
2013). It consists of multiple stacked layers of two
Deep Neural Network (DNN) f and g to compute rep-
resentations and extract non-linear features for each
view X, and Y . Furthermore, CNN has shown suc-
cessful results for computer vision and image process-
ing for which multi-view CNN is designed to learning
features other multiple modalities, allowing separate
representation learning for each view and then map-
ping them into a shared space (Li et al., 2019).
Interpretation of Human Behavior from Multi-modal Brain MRI Images based on Graph Deep Neural Networks and Attention Mechanism
57

2.2 Graph Representation Learning
Learning how to extract relevant information from
the non-linear data structure (graphs) has posed an
intriguing challenge for which the process of trans-
fer of representation learning from Euclidean to non-
Euclidean data is crucial for addressing numerous ma-
chine learning methods. In this regard, various ap-
proaches have been proposed in the literature, which
maps nodes into a latent representation space in which
such p-dimensional space is considered to be suffi-
ciently informative to preserve the original network
structure. To do so, some of them use random walks
(Perozzi et al., 2014), (Dong et al., 2017), (Grover
and Leskovec, 2016) to directly obtain the embed-
ding for each node, while others are defined under
the Graph Neural Network (GNN) model which ad-
dresses the network embedding problem based on ad-
jacency matrix computation, through the Graph au-
toencoder (GAE) model (Wu et al., 2020) as well as
GraphSage (Hamilton et al., 2017): a Convolutional
GNNs (ConvGNNs) spatial-based model. The fol-
lowing two sections detail these approaches and pro-
vide a distinction between random walks based ap-
proaches and GNN based approaches.
2.2.1 Random Walk based Approaches
The key idea behind these approaches is to optimize
node embedding by quantifying similarity between
nodes by their co-occurrence over the graph on short,
random walks (Khosla et al., 2020). The three popu-
lar methods are:
• DeepWalk (Perozzi et al., 2014): it is based on two
major steps. The first addresses the neighborhood
relations by randomly selecting the first node and
traverses then the network to identify its related
nodes. The second step uses a SkipGram algo-
rithm (Mikolov et al., 2013) to update and learn
node representations by optimizing node similari-
ties that share the same information.
• Node2vec (Grover and Leskovec, 2016): an ad-
vanced version of DeepWalk, that considers two
biased random walks p and q to identify the neigh-
borhood of nodes. p controls the likelihood of im-
mediately revisiting a node in the walk (Grover
and Leskovec, 2016) and q controls the likelihood
of exposed parts of the graph is not explored.
• Metapath2vec (Dong et al., 2017): it was pro-
posed to handle the network’s heterogeneity by
maximizing its probability. It uses a meta-path
random walk that determines the node type or-
der within which the random walker traverses the
graph to ensure that the semantic relationships be-
tween nodes type are incorporated into SkipGram.
2.2.2 GNN based Approaches
Both surveys (Wu et al., 2020) and (Zhang et al.,
2018) define various models based on GNN such as
ConvGNNs and GAE, etc.
• ConvGNNs: it was proposed to manage convolu-
tion operations on graph domains in generating
a node v’s representation by aggregating neigh-
bors’ features x
u
with its own features x
v
, where
u ∈ N(v) (Wu et al., 2020). It covers two main
approaches: spectral-based in which, the convo-
lution operation is defined over the entire graph,
and spatial-based that defines convolution by tak-
ing each node into account, and aggregates neigh-
borhood information. One of the most applied
spatial-based approaches is namely, GraphSage
(SAmple and aggreGatE) (Hamilton et al., 2017).
It first defines the set of the neighborhood for each
node by fixing a parameter k ∈
{
1,...,K
}
that con-
trols the neighborhood depth, then, it trains a set
of aggregator functions to learn the node’s rep-
resentation given its feature and local neighbor-
hood: for each node, it generates a neighborhood
representation with an aggregator function and
concatenates it to the current node representation
through which a fully connected layer is fed with
a nonlinear activation function (Hamilton et al.,
2017).
• GAE: it encodes nodes/graphs into a latent vec-
tor space and reconstructs graph data from the en-
coded information (Wu et al., 2020). Its architec-
ture consists of two networks: an encoder enc()
to extract a node’s feature information by using
graph convolutional layers and a decoder dec() to
reconstruct the graph adjacency matrix
ˆ
A while
preserving the graph topological information (Wu
et al., 2020) based on a learning function which
computes the distance between a node’s inputs
and its reconstructed inputs.
Previous multi-view representation learning mod-
els based on Euclidean-data can not tackle the com-
plex structure of graphs for which several challenges
have been raised in extending deep learning ap-
proaches to graph data (Wu et al., 2020). There
has been a growing interest in learning about non-
Euclidean data whose structures (graph) have not
been defined before and with unknown properties.
This alternative covers the contribution of our re-
search topic in which we examine the structural
modality (sMRI) as an adjacency matrix to preserve
VISAPP 2021 - 16th International Conference on Computer Vision Theory and Applications
58

the rich spatial relational information between vox-
els and where anatomical-functional brain connec-
tions as a graph can be more reflective. More specifi-
cally, GAE has marked an increasing potential in sev-
eral tasks such as node clustering (Pan et al., 2018),
(Wang et al., 2017), link prediction (Kipf and Welling,
2016), etc. The key reason behind it is the projection
of a graph into a latent representation space based
on encoding-decoding networks in which such low-
dimensional space is considered to be sufficiently in-
formative to preserve the original graph structure. In
this regard, we include this empirical benefit to bet-
ter learn a latent representation of both fMRI modali-
ties based on sMRI. The aim is to build a multi-modal
graph representation learning that seeks at extracting
relevant features from multi-modal fMRI data to en-
hance the prediction task.
3 PROPOSED METHOD
In this section, we present our proposed method,
which seeks to predict the behavioral score y of each
subject using learned multi-view latent representa-
tions Z obtained by multi-view graph autoencoder
based on attention mechanism (MGATE). Figure 1 re-
ports the general overview of the proposed methodol-
ogy which covers three key phases:
1. Data Preprocessing: the aim is to apply standard
pipelines for the analysis of both fMRI modalities
(task and rest-fMRI) in which data acquisition re-
sults in 3-D brain scans containing ∼ 20–40 thou-
sand voxels. For the sMRI modality, we extract
the cortical surface by obtaining the 3-D mesh in-
cluding the voxels to be used then as a graph de-
noted G. From this 3-D mesh, we therefore create
the two graphs G
t
and G
r
, each of which is com-
posed of a set of X
i
each associated with a fea-
ture vector (X
ti
∈ R
D
t
and X
ri
∈ R
D
r
) estimated at
each vertex of the mesh, where D
t
and D
r
> 100
features. Moreover, we extract an activation ma-
trix, denoted by X
t
from task-fMRI, which repre-
sents the beta value of each voxel. Finally, from
the rest-fMRI, a correlation matrix denoted by X
r
will be extracted in order to compute the correla-
tion between each voxel v
i
and region of interest
(ROI).
2. Multi-view Graph Representation Learning:
it consists of building an MGATE model, which
takes as input two Brain Adjacency Graphs
(BAGs), i.e, G
t
and G
r
. The goal is to learn lo-
cally a latent representation of the multi-modal in-
formation by considering the neighborhood infor-
mation between the voxels of the 3D-mesh.
3. Behavior Score Interpretation: it involves solv-
ing the regression problem, that is, predicting the
behavioral score measuring each subject’s perfor-
mance in a cognitive task using the latent repre-
sentation Z with a trace regression model operat-
ing at the subject level.
3.1 Brain Adjacency Graph (BAG)
Construction
This section presents the refined view of the sMRI
preprocessing in which, we explore the BAG con-
struction from the triangulated mesh 3-D, where the
number of centroid neighborhoods is well addressed.
sMRI was used to present the connections of each ver-
tex from which we obtain a triangulated 3-D mesh
representing the cortex surface denoted by G(V , E)
where V refers to the set of vertices
{
v
1
,...,v
n
}
and E
represents it’s connectivity with respect to the edges
of the graph
{
e
1
,...,e
E
}
(e
i
∈ V × V ). Motivated by
the need for a structural representation of the basic
topological information provided by G to traverse the
triangulation, an efficient approach is to store the set
of edges E in an adjacency matrix A ∈ R
n×n
where n
the number of voxels. The adjacency matrix A of the
graph G is generated using the following formula:
A(v, e
i
) =
(
1, if v ∈ e
i
0, otherwise
(1)
The entire BAG construction process is illustrated
by Algorithm 1. The adjacency matrix A allows each
connection between voxels to be projected in a 2-D
structure, where each voxel specifies its five vertices
from V for a current neighborhood size k = 1.
3.2 Multi-modal Graph Auto-encoder
based on the Attention Mechanism
(MGATE)
This section presents our proposed MGATE model,
which seeks at learning better representation from
both modalities task-fMRI and rest-fMRI using the
BAG constructed based on sMRI. We report firstly
an introduction about the dimensionality reduction,
which gives a generic overview of it. Secondly, we
present the feature extraction process of both fMRI
modalities by the GATE model based on BAG. Fi-
nally, we describe the multi-view GATE (MGATE)
by defining different fusion layers, including max-
pooling(), mean-pooling(), and inner-product() oper-
ators.
Interpretation of Human Behavior from Multi-modal Brain MRI Images based on Graph Deep Neural Networks and Attention Mechanism
59
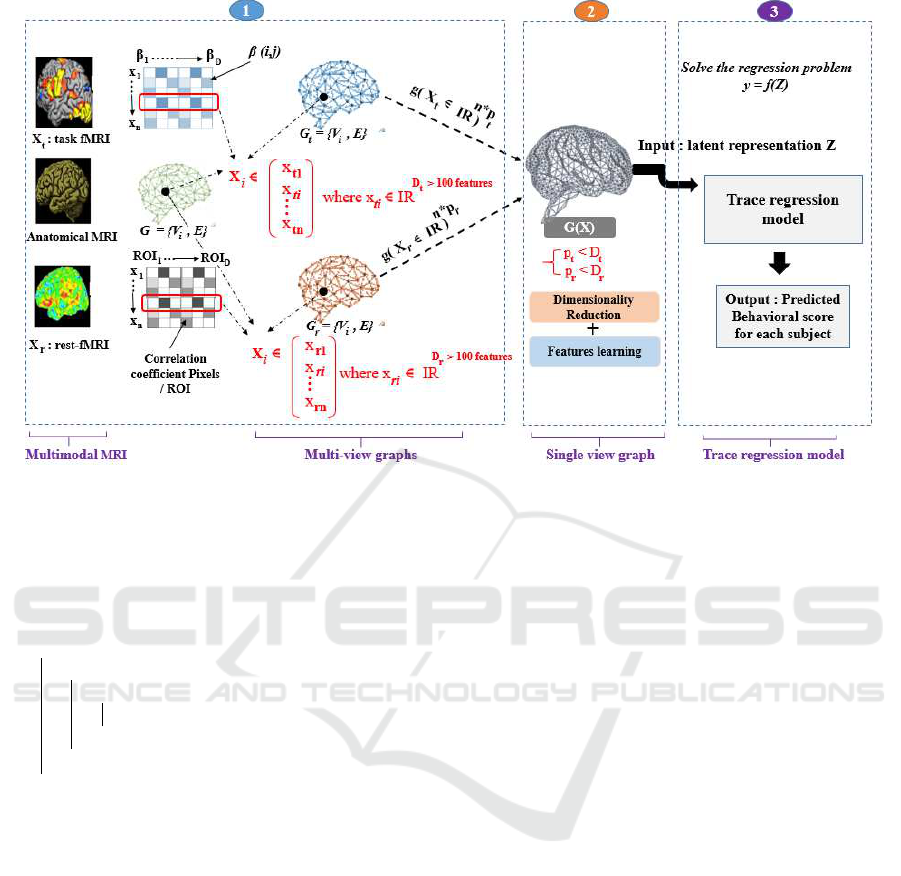
Figure 1: General overview of the proposed multi-modal graph deep learning method.
Input: 3-D mesh M, scalar k, activation
matrix X
t
, and correlation matrix X
r
,
/* Generate A from the mesh */
initialization;
A = 0, k = 1 ;
for i ← 1 to n do
for j ← 1 to n do
if M
i, j
∈ N
k
(M) are connected then
A(i, j) ← 1;
end
end
end
/* Generate G
t
, G
r
using A, X
t
and
X
r
*/
G
t
← (V , E,X
t
) ;
G
r
← (V , E,X
r
)
Algorithm 1: BAG construction.
3.2.1 Dimensionality Reduction: Overview
Usually, dimensionality reduction aims at extracting
useful features denoted by Z ∈ R
n×p
from a high di-
mensional data X ∈ R
n×D
, where n is the number of
samples, D is the number of initial features, and p is
the number of extracted features. Formally, the main
goal of the dimensionality reduction is given as fol-
lows (Sellami et al., 2019) (Sellami and Farah, 2018)
‘
Z = f (X) (2)
where f is a transformation function, which can be
linear or non-linear. The linear transformation seeks
to project the initial data vector X ∈ R
n×D
on a newly
transformed function space Z ∈ R
n×p
and allows all
the features to be taken into account while retain-
ing as much information as possible in the reduced
subspace. While non-linear transformation methods
take into consideration the non-linearity of the origi-
nal data when processing with transformation.
3.2.2 GATE Model based on BAG
One key challenge in using a voxel-based predictive
model for brain imaging applications rely on its high
dimensional data in terms of the number of features
per voxel in the brain of each subject which greatly
surpassed the number of training samples. It is cru-
cial then to admit only the relevant features contribut-
ing to better data. Therefore, we propose a GATE
model as a dimensionality reduction method where
the main intuition behind it lies in its ability to recon-
struct the graph adjacency matrix by estimating the
loss function (A −
ˆ
A) practically converges to 0. Tak-
ing advantage of this point, we build a graph represen-
tation learning network based on AE and the attention
mechanism. It makes it possible to find a latent sub-
space able to reconstruct the input features X. The
main architecture of the GATE model consists of two
networks: Graph Encoder G
Enc()
and Graph Decoder
G
Dec()
for each modality.
Graph Encoder G
Enc()
: it aims to generate new
latent representations of vertices by considering the
graph structure. Each graph encoder layers seeks to
VISAPP 2021 - 16th International Conference on Computer Vision Theory and Applications
60

aggregate the information from the neighboring ver-
tices of a target vertex. It consists of a stack of single
graph encoder layers, each of which seeks to aggre-
gate the information from the neighboring vertices of
a target vertex. To allocate learnable weights to the
aggregation, an attention mechanism is implemented.
The weights can therefore be directly expressed by
attention coefficients between nodes and provide in-
terpretability. Formally, a single graph layer of G
Enc()
based on the attention mechanism can be defined as
follows
h
l
i
= σ((
∑
j∈N
i
α
(l)
i j
W
(l)
h
(l−1)
j
)) (3)
where h
l
i
is the new representation of vertex i in the
l −th layer. N
i
is the set of vertex i’s neighbors. α
i j
is
the aggregation weight, which measures how impor-
tant vertex j to vertex i, and σ denotes the activation
function. In our case, we use the attention mechanism
in order to compute aggregation weight, i.e., to mea-
sure the relevance between vertices and their neigh-
bors. Formally, it can be expressed as
α
i j
=
exp(σ(~a
T
[W
~
h
i
||W
~
h
j
]))
∑
k∈N
i
exp(σ(~a
T
[W
~
h
i
||W
~
h
k
]))
(4)
where ~a denotes the weigh vector of the mechanism
attention, and || is the concatenation operation.
Graph Decoder G
Dec()
: it allows to reconstruct and
recover the input data,
ˆ
X = G
Dec
(X,(A)). Each graph
decoder layer seeks to reconstruct the node repre-
sentations by considering the representations of their
neighbors according to their importance and rele-
vance, which allows capturing the hidden represen-
tation of vertices containing the rich features. As
G
Enc()
, the G
Dec()
specifies the same number of lay-
ers in which each graph decoder layer seeks to reverse
the process of its corresponding graph encoder layer.
Formally, a single graph layer of G
Dec()
based on the
attention mechanism can be defined as follows
ˆ
h
l
i
= σ((
∑
j∈N
i
α
(l)
i j
ˆ
W
(l)
h
(l−1)
j
)) (5)
Loss Function L: it seeks to minimize the re-
construction error of node features using the mean
squared error (MSE) as follows
L =
N
∑
i=1
||xi − ˆx
i
||
2
(6)
3.2.3 MGATE with Fusion Layer
In order to learn a better representation from multiple
input modalities, i.e. both fMRI modalities based on
BAG, an MGATE is designed which shares with the
GATE model, the two networks: G
Enc()
and G
Dec()
per modality, i.e., GAT E
t
and GAT E
r
. In fact, they
take as inputs their correspond BAG, i.e., G
t
= (X
t
,
A), and G
r
= (X
r
, A) respectively. The two GATEs
GAT E
t
and GATE
r
transform the multi-modal in-
puts into a basically lower-dimensional representa-
tion (every cortical locations in both fMRI modalities)
X
t
∈ R
n×D
t
and X
r
∈ R
n×D
r
and project them into a la-
tent space representation Z
t
∈ R
n×p
t
and Z
r
∈ R
n×p
r
.
Moreover, both latent representations Z
t
and Z
r
will
be fused in order to find a common shared space. In
this context, various types of fusion operations can
be used to get compressed latent representations of
both input modalities. These operations include max-
pooling() which takes the maximum of Z
t
and Z
r
,
mean-pooling() which is the average between Z
t
and
Z
r
, concat() which concatenates Z
t
and Z
r
, and inner-
product() that is a generalization of the dot prod-
uct operation between samples in both Z
t
and Z
r
.
The MGATE seeks then to reconstruct each modal-
ity using the common latent representation Z, i.e.,
ˆ
X
t
= MGAT E
Dec
(Z), and
ˆ
X
r
= MGAT E
Dec
(Z). Fig-
ure 2 reports the main architecture of the proposed
MGATE.
3.3 Regression Model
Increased research on neuroimaging analysis target-
ing prediction or classification tasks based on multi-
modal MRI data has been widely investigated in
which their methodologies have yielded the greatest
success in various clinical interventions for predicting
future outcomes, behavioral response, etc. Therefore,
the objective of our model consists of predicting the
behavioral score of each subject reflecting its perfor-
mance in a cognitive task (in a voice recognition task)
using the fused latent representation Z ∈ R
n∗p
. This
prediction is carried out to solve the regression prob-
lem basically performed with the well-known linear
regression model to predict a scalar response from a
vector-valued input, which can be defined as follows
y
i
= β
T
Z
i
+ ε
i
, i = 1, ...,N
where y is the predicted variable, β refers to the re-
gression coefficients, Z is the independent variable,
ε is a vector of values ε
i
that add noise to the lin-
ear y − Z relation, and β
T
Z
i
is the inner product be-
tween Z
i
and β. Although this approach was a rea-
sonable compromise when predicting a scalar behav-
Interpretation of Human Behavior from Multi-modal Brain MRI Images based on Graph Deep Neural Networks and Attention Mechanism
61
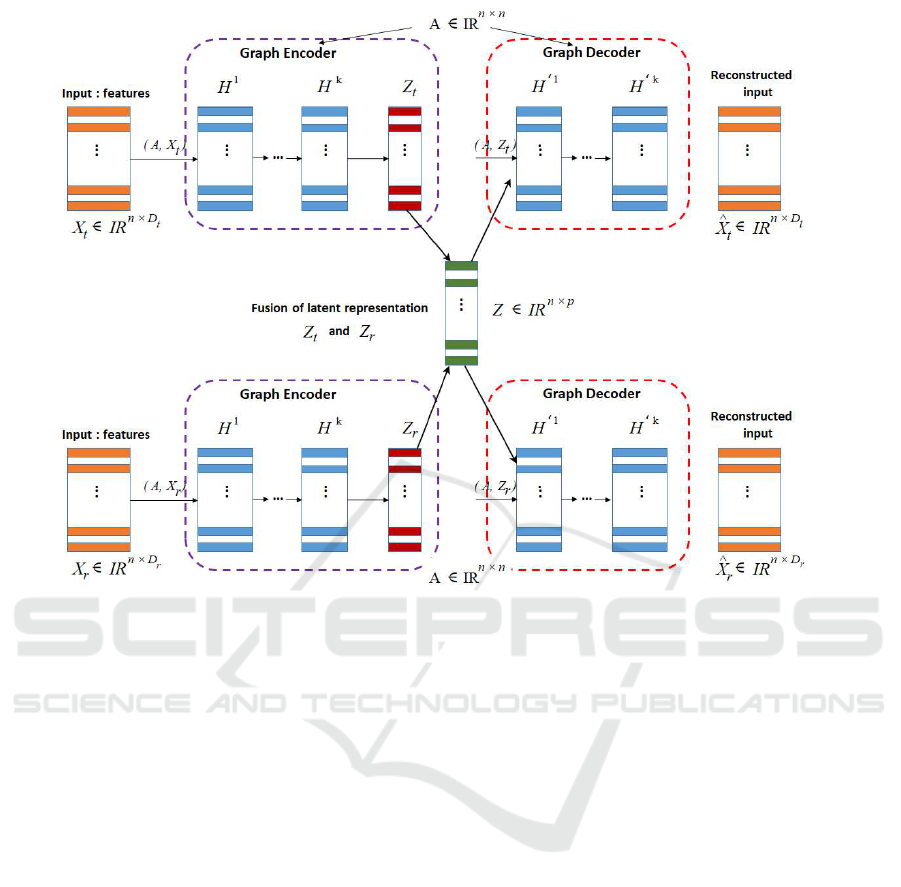
Figure 2: MGATE architecture that learns a better representation from the fused multiple input views Z.
ioral score from a vector-valued fMRI data input, it is
nevertheless necessary, in our case, to learn a model
capable of handling the explanatory variables of the
matrix provided by the fused latent representation Z
for which the trace regression model has gained ris-
ing interest. It is a generalization of the linear regres-
sion model that operates on matrix-valued input and
attempts to project it into real-valued outputs (Slawski
et al., 2015), defined as follows
y = tr(
ˆ
β
T
Z) + ε
where tr(.) is the trace and
ˆ
β is the matrix of re-
gression coefficients. Numerous studies (Koltchinskii
et al., 2011), (Fan et al., 2019) opted for the regular-
ized least squares to determine an estimation of
ˆ
β as
follows
ˆ
β = argmin
β
n
∑
i=1
(y
i
−tr(β
T
Z
i
))
2
+ λk(β)k (7)
where λk(β)k is the trace norm to explore the low-
rank structure of
ˆ
β. In our case, by considering the
3-D mesh, we use a manifold regularization based on
Graph Laplacian G. To empower the nodes with the
same importance as their neighbors, we use two regu-
larization terms where the first is defined based on the
Laplace matrix L of G
λ
1
(β) = ηtr(β
T
Lβ) (8)
where
L = D − W
D is a diagonal matrix of node degrees, D =
diag(d
1
,...,d
n
), W is the weighted adjacency matrix
of G defined as W = (w
i j
)
i, j=1,...,n
with w
i j
= w
ji
≥
0, where w
i j
= 0 refers that the vertices v
i
and v
j
are
disconnected. The second lies on the group-sparsity
regularization strategy which takes the form
λ
2
(β) = α
∑
j
kβ
j
k
2
(9)
Hence, the predictive model is carried out to solve the
trace regression problem with the two previous regu-
larization terms
λ(β) = ηtr(β
T
Lβ)/2 + α
∑
j
kβ
j
k
2
(10)
4 EXPERIMENTAL RESULTS
This section discusses the experimental protocol of
our proposed method to illustrate its efficiency in the
VISAPP 2021 - 16th International Conference on Computer Vision Theory and Applications
62
clinical initiative for predicting individual differences
in new subjects. It first presents the applied InterTVA
dataset to address then the relative results of each
methodological phase.
4.1 InterTVA Data Preprocessing
Our experiments were conducted on the InterTVA
dataset (https://openneuro.org/datasets/ds001771.),
which aims at studying the inter-individual differ-
ences using multi-modal MRI data on 40 healthy
subjects. An event-related voice localizer has been
used in which participants were asked to close their
eyes while passively listening to 72 vocal sounds and
72 non-vocal sounds, with inter-stimulus intervals
in the range of 4 - 5s. For the rest-fMRI, subjects
were asked to rest quit while lying in the scanner
for a duration of 12mn. Moreover, anatomical scans
(3D T1 images) were acquired for each subject.
The main pipeline for analysis of both fMRI modal-
ities (task- and rest-fMRI) includes slice-timing
correction and motion’s correction using SPM12
(www.fil.ion.ucl.ac.uk/spm). Then, statistical analy-
sis based on GLM has been performed on all voxels.
For task-fMRI, the estimation of the parameters of
the GLM model results in a set of features that consist
of the pattern of β-values induced by hearing each of
144 sounds. This allows therefore, constructing the
feature vector X
t
∈ R
D
t
where D
t
= 144. Rest-fMRI
was performed using FreeSurfer to identify the set
of voxels whose time series correlated with the time
series of each ROIs. These correlations constitute
therefore, the feature vector X
r
∈ R
D
r
where D
r
=
150. The goal of our experiments was to predict each
participant’s Glasgow Voice Memory Test (GVMT)
score by exploiting the activation and connectivity
features based on the spatial information from the
mesh 3-D using the predictive model trained on 36
samples.
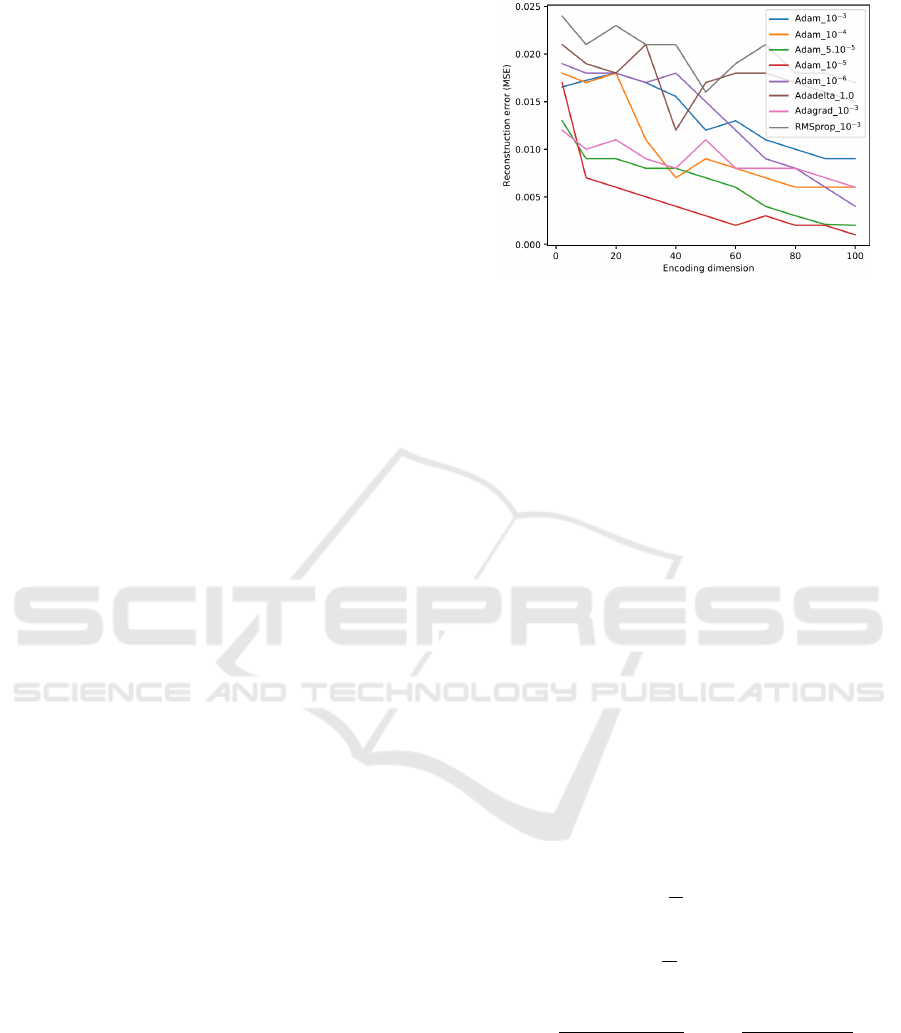
4.2 Parameters Tuning
The two models GATE/MGATE were implemented
using the Keras framework and learned over 500
epochs with a batch size of 300 training samples. In
order to find the best optimizer, we assessed different
optimizers with different learning rates based on the
reconstruction error (MSE), including Adam, Ada-
grad, and RMSprop. Figure 3 reports the obtained
MSE of the reconstruction phase. We can see then
that Adam optimizer gives the best MSE with a learn-
ing rate is equal to 10
−
5.
Each model was built using three hidden layers for
each fMRI modality: [D
t
, 130, 110, enc, 110, 130,
Figure 3: Reconstruction error obtained using different op-
timizers, and learning rate, including, Adam, Adagrad, RM-
Sprop.
D
t
] for task-fMRI and [D
r
, 130, 110, enc, 110, 130,
D
r
] for rest-fMRI in which ten dimensions of the la-
tent representation enc have been developed from 2 to
100 features. Moreover, we opted for (relu, linear) as
an activation functions for the hidden layers and the
output layer respectively.
4.3 Performance Evaluation Metrics
In order to evaluate our trace regression model, three
performance metrics were computed, i.e., mean ab-
solute error (MAE), mean square error (MSE), and
R-squared score, i.e., R
2
(coefficient of determina-
tion). MAE seeks to measure the average magnitude
of the errors in a set of predictions, without consider-
ing their direction. MSE basically measures the aver-
age squared error of our predictions. R
2
is the percent
of variance explained by the model. It is always go-
ing to be between −∞ and 1. Usually, it shows how
closely the model estimations match the true values.
These metrics can be defined as follows
MAE =
1
N
N
∑
i=1
|y
i
− ˆy
i
| (11)
MSE =
1
N
N
∑
i=1
(y
i
− ˆy
i
)
2
(12)
R
2
= 1 −
MSE(model)
MSE(baseline)
= 1 −
∑
N
i=1
(y
i
− ˆy
i
)
2
∑
N
i=1
(y
i
− ¯y
i
)
2
(13)
where N is the number of subjects, y is the true values
(score of behavior), ˆy is the predicted values, and ¯y is
the mean of the true values.
4.4 Prediction Performance
In this section, we provide both quantitative and qual-
itative evaluation of the proposed predictive model
Interpretation of Human Behavior from Multi-modal Brain MRI Images based on Graph Deep Neural Networks and Attention Mechanism
63
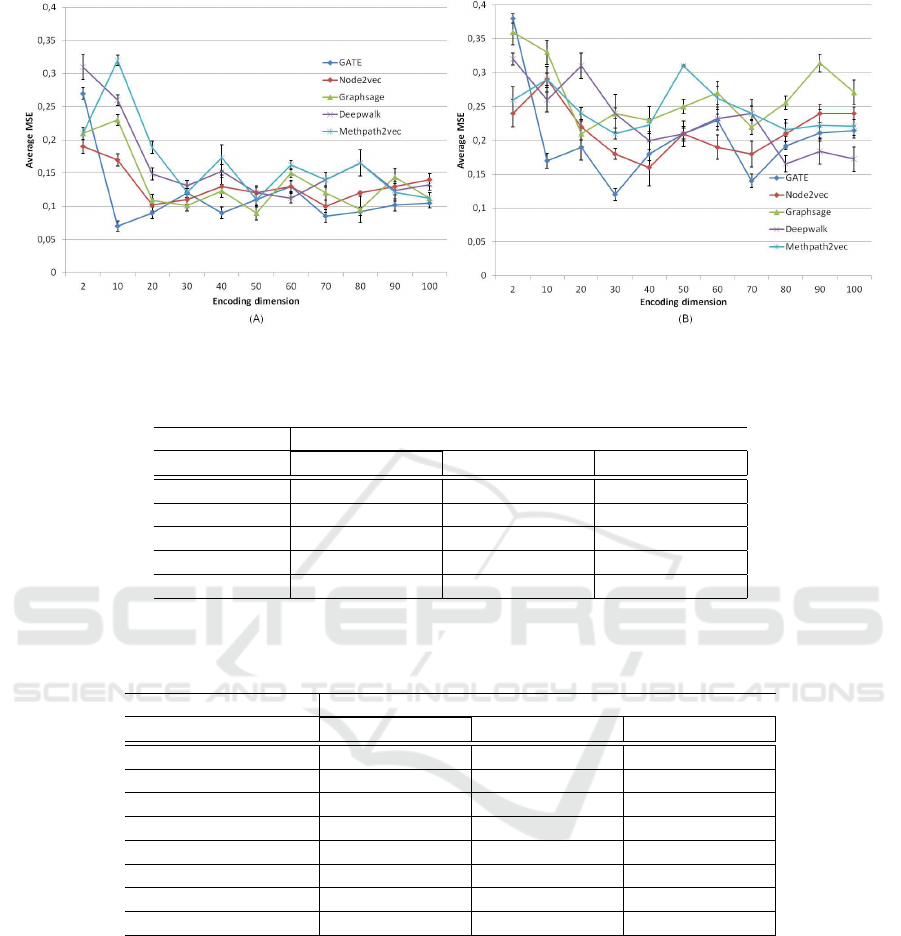
Figure 4: Average MSE versus encoding dimension across 10-fold cross validation using (A) task-fMRI and (B) rest-fMRI.
Table 1: Best average MSE, MAE, and R
2
(± standard deviation) using concatenated inputs estimated on trace regression
model based on Node2vec, Graphsage, Deepwalk, Metapath2vec, and MGATE models.
X
t
+ X
r
Model MSE MAE R
2
Node2vec 0.114 (± 0.026) 0.112 (± 0.019) 0.120 (± 0.014)
Graphsage 0.099 (± 0.010) 0.097 (± 0.021) 0.141 (± 0.017)
Deepwalk 0.122 (± 0.013) 0.119 (± 0.010) 0.117 (± 0.025)
Metapath2vec 0.103 (± 0.012) 0.099 (± 0.020) 0.142 (± 0.016)
MGATE 0.057 (± 0.009) 0.057 (± 0.010) 0.281 (± 0.010)
Table 2: Best average MSE, MAE, and R
2
(± standard deviation) using concatenated latent representation estimated on trace
regression model based on Node2vec, Graphsage, Deepwalk, Metapath2vec, MGATE (Avg()), MGATE (Max()), MGATE
(Concat()), and MGATE (Product()) models.
Z
t
+ Z
r
Model MSE MAE R
2
Node2vec 0.103 (± 0.032) 0.09 (± 0.081) 0.122 (± 0.014)
Graphsage 0.098 (± 0.042) 0.091(± 0.073) 0.145 (± 0.009)
Deepwalk 0.119 (± 0.023) 0.104 (± 0.154) 0.102 (± 0.013)
Metapath2vec 0.098 (± 0.010) 0.092(± 0.123) 0.136 (± 0.016)
MGATE (Avg()) 0.056 (± 0.015) 0.052 (± 0.093) 0.284 (± 0.019)
MGATE (Product()) 0.051 (± 0.009) 0.049 (± 0.008) 0.296 (± 0.008)
MGATE (Concat()) 0.054 (± 0.009) 0.052 (± 0.010) 0.289 (± 0.009)
MGATE (Max()) 0.061 (± 0.025) 0.058 (± 0.012) 0.274 (± 0.019)
reporting the experimental results using monomodal
data performed with the GATE model and multi-
modal data with the MGATE model comparing to
other graph representation learning models and dis-
cuss the visual interpretation of our predictive model.
4.4.1 Quantitative Evaluation
We trained different graph representation learning
models over 10-fold cross-validation, i.e., Node2vec,
GraphSage, DeepWalk, and Metapath2vec in order to
demonstrate the effectiveness of our proposed GATE.
Therefore, we opted for the MSE loss function to
compute the prediction error between the true behav-
ioral score and the expected one estimated by the pre-
dictive model and we reported then the average MSE
compared to the encoding dimension using task- and
rest-fMRI data (Figure 4) for each method. Thus, we
can interpret that our proposed GATE is the appro-
priate one for learning representation from both fMRI
data with an MSE value equal to 0.07 with an encod-
ing dimension = 10 for task fMRI and 0.12 for en-
coding dimension = 30 for rest-fMRI. Next, we find
for task-fMRI, the GraphSage model with a difference
of 0.02 learned on 50 features, Node2vec reached
an MSE value = 0.01 on 20 features, then, Metap-
VISAPP 2021 - 16th International Conference on Computer Vision Theory and Applications
64
ath2vec and DeepWalk had the same value = 0.11
with different encoding dimensions: 50 and 60 re-
spectively. Consequently, we can see that the perfor-
mances obtained by all the models using task-fMRI
are marginally better than those using rest-fMRI since
it matches the task performed with the behavioral
GVMT test compared to the rest-fMRI with mini-
mal information about the entire brain functional con-
nectivity (MSE
task− f MRI
< MSE
rest− f MRI
) in which
Node2vec gained the second better MSE value =
0.165 on 40 features, DeepWalk, GraphSage, and
Metapath2vec are the next ones. As we go deeper,
we can deduce that the best MSE value is obtained
between 10 and 20 features for both task- and rest-
fMRI.
To further investigate our experiments, we also in-
troduced another architecture, for each method, which
takes the concatenation of inputs (X
t
, X
r
) to sub-
sequently compare them with the performances ob-
tained in the case of mid-level fusion using MSE,
MAE, and R
2
evaluation metrics tested on different
fusion operations including: AVG(), Max(), Product()
and Concat(). Therefore, Tables 1 and 2 summarize
the best average evaluation metrics learned on encod-
ing dimensions across 10-fold cross-validation using
concatenated inputs and concatenated latent represen-
tation respectively. Hence, we can deduce that the
best performance for the first concatenation is reached
when using the MGATE model with the same value
for MSE and MAE = 0.057 and R
2
= 0.281. Similarly
to the second architecture with the best MSE value
= 0.051, MAE = 0.049 and R
2
= 0.296 using inner-
product operator obtained on 20 features, where 10
features extracted from task-fMRI and 10 features ex-
tracted from rest-fMRI. Here, we can justify the ef-
fectiveness of the complementarity of the informa-
tion offered by the two modalities based on BAG
constructed from the sMRI image compared to the
monomodal modality (MSE
Z
t
+Z
r
< MSE
task− f MRI
)
and (MSE
X
t
+X
r
< MSE
rest− f MRI
) and that the mid-
level fusion is more appropriate for achieving our ob-
jective in predicting the behavioral score.
4.4.2 Qualitative Evaluation
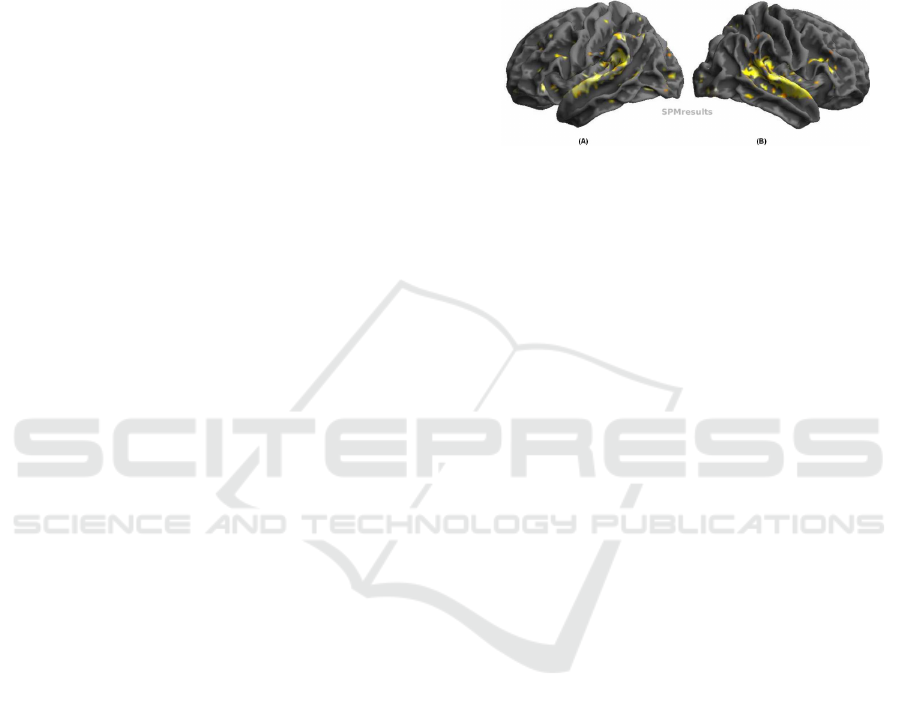
The aim here is to project estimated beta maps
ˆ
beta
on the white cortical mesh in order to get a visual
interpretation. Therefore, Figure 5 reports the ob-
tained average beta maps estimated using MGATE
and trace regression model. In fact, in order to ex-
tract significant regions, we use a statistical tests,
including t − test and p − value, where t = 1.973
and p < 0.003,. We obtained then satisfactory re-
sults, which confirm the performance of the proposed
method. Moreover, we can see that the MGATE
model can provide several significant regions, which
could be induced by improved robustness of the in-
formation present in the latent representation of the
fused task- and rest-fMRI data. Further experimental
results on other datasets like the HCP dataset will be
conducted in future work to confirm this high perfor-
mance of the proposed MGATE model.
Figure 5: Average weight maps
ˆ
β estimated using best
MGATE model, thresholded after a test for statistical sig-
nificance (t > 1.973, p < 0.003). Significant regions appear
in yellow color. (A) left hemisphere mesh (B) right hemi-
sphere mesh.
5 CONCLUSION
A new multi-modal graph deep learning method was
proposed in this paper, which leads to a better inter-
pretation of human behavior from the combination
of both fMRI modalities using the BAG constructed
based on sMRI. Three main phases were illustrated
including our proposed MGATE model that seeks at
learning a fused representation estimated at the corti-
cal location level to be used then as input to our trace
regression predictive model that quantifies the behav-
ioral score of each subject in voice recognition and
identification task. Over and above this approach’s in-
novation, it was able to handle the irregular structure
provided by neuroimaging data. Our experimental re-
sults show the effectiveness and performance of our
model than other graph representation learning mod-
els of the state-of-the-art.
REFERENCES
Andrew, G., Arora, R., Bilmes, J., and Livescu, K. (2013).
Deep canonical correlation analysis. In Dasgupta, S.
and McAllester, D., editors, Proceedings of the 30th
International Conference on International Conference
on Machine Learning, volume 28 of Proceedings of
Machine Learning Research, pages 1247–1255, At-
lanta, Georgia, USA. PMLR.
Dong, Y., Chawla, N. V., and Swami, A. (2017). Meta-
path2vec: Scalable representation learning for het-
erogeneous networks. In Proceedings of the 23rd
ACM SIGKDD International Conference on Knowl-
edge Discovery and Data Mining, pages 135—-144,
Interpretation of Human Behavior from Multi-modal Brain MRI Images based on Graph Deep Neural Networks and Attention Mechanism
65

New York, NY, USA. Association for Computing Ma-
chinery.
Du W, Calhoun VD, L. H. e. a. (2012). High classifica-
tion accuracy for schizophrenia with rest and task fmri
data. Front Hum Neurosci, 6.
Fan, J., Gong, W., and Zhu, Z. (2019). Generalized high-
dimensional trace regression via nuclear norm regular-
ization. Journal of Econometrics, 212(1):177—-202.
Grover, A. and Leskovec, J. (2016). Node2vec: Scal-
able feature learning for networks. In Proceedings of
the 22nd ACM SIGKDD International Conference on
Knowledge Discovery and Data Mining, pages 855—-
864, New York, NY, USA. Association for Computing
Machinery.
Hamilton, W., Ying, Z., and Leskovec, J. (2017). Inductive
representation learning on large graphs. In Guyon, I.,
Luxburg, U. V., Bengio, S., Wallach, H., Fergus, R.,
Vishwanathan, S., and Garnett, R., editors, Advances
in Neural Information Processing Systems 30, pages
1024–1034. Curran Associates, Inc.
Khosla, M., Setty, V., and Anand, A. (2020). A comparative
study for unsupervised network representation learn-
ing. IEEE Transactions on Knowledge and Data En-
gineering, pages 1—-1.
Kiehl, KA, P. G. and VD, C. (2008). A review of
challenges in the use of fmri for disease classifica-
tion/characterization and a projection pursuit applica-
tion from a multi-site fmri schizophrenia study. Brain
Imaging Behav, 2(3):147–226.
Kipf, T. and Welling, M. (2016). Variational graph auto-
encoders. ArXiv.
Koltchinskii, V., Lounici, K., and Tsybakov, A. B. (2011).
Nuclear-norm penalization and optimal rates for noisy
low-rank matrix completion. The Annals of Statistics,
39(5):2302—-2329.
Li, Y., Yang, M., and Zhang, Z. (2019). A survey of multi-
view representation learning. IEEE Transactions
on Knowledge and Data Engineering, 31(10):1863–
1883.
Liu, S., Cai, W., Liu, S., Zhang, F., Fulham, M., Feng, D.,
Pujol, S., and Kikinis, R. (2015). Multimodal neu-
roimaging computing: a review of the applications in
neuropsychiatric disorders. Brain Inf, 2:167—-180.
M Symms, HR Jager, K. S. and Yousry, T. (2004). A re-
view of structural magnetic resonance neuroimaging.
J Neurol Neurosurg Psychiatry, 75:235—-1244.
Mihalik, A., Ferreira, F. S., and et al, R. (2019). Brain-
behaviour modes of covariation in healthy and clini-
cally depressed young people. Scientific reports, 9:1–
11.
Mikolov, T., Chen, K., Corrado, G., and Dean, J. (2013).
Efficient estimation of word representations in vector
space.
Ngiam, J., Khosla, A., Kim, M., Nam, J., Lee, H., and Ng,
A. Y. (2011). Multimodal deep learning. In Proceed-
ings of the 28th International Conference on Inter-
national Conference on Machine Learning, ICML’11,
pages 689—-696, Madison, WI, USA. Omnipress.
Pan, S., Hu, R., Long, G., Jiang, J., Yao, L., and Zhang, C.
(2018). Adversarially regularized graph autoencoder.
CoRR.
Perozzi, B., Al-Rfou, R., and Skiena, S. (2014). Deepwalk.
Proceedings of the 20th ACM SIGKDD international
conference on Knowledge discovery and data mining
- KDD ’14.
Saygin, Z., Osher, D. E., Koldewyn, K., Reynolds, G.,
Gabrieli, J., and Saxe, R. (2012). Anatomical connec-
tivity patterns predict face-selectivity in the fusiform
gyrus. Nature neuroscience, 15:321–327.
Sellami, A., Abbes, A. B., Barra, V., and Farah, I. R. (2020).
Fused 3-d spectral-spatial deep neural networks and
spectral clustering for hyperspectral image classifica-
tion. Pattern Recognition Letters, 138:594–600.
Sellami, A. and Farah, M. (2018). Comparative study of
dimensionality reduction methods for remote sensing
images interpretation. In 2018 4th International Con-
ference on Advanced Technologies for Signal and Im-
age Processing (ATSIP), pages 1–6. IEEE.
Sellami, A., Farah, M., Farah, I. R., and Solaiman, B.
(2019). Hyperspectral imagery classification based on
semi-supervised 3-d deep neural network and adap-
tive band selection. Expert Systems with Applications,
129:246–259.
Slawski, M., Li, P., and Hein, M. (2015). Regularization-
free estimation in trace regression with symmet-
ric positive semidefinite matrices. In Cortes, C.,
Lawrence, N. D., Lee, D. D., Sugiyama, M., and Gar-
nett, R., editors, Advances in Neural Information Pro-
cessing Systems 28, pages 2782–2790. Curran Asso-
ciates, Inc.
Sui, J., Adali, T., Yu, Q., Chen, J., and Calhoun, V. D.
(2012). A review of multivariate methods for multi-
modal fusion of brain imaging data. Journal of Neu-
roscience Methods, 204(1):68–81.
Sui, J., Pearlson, G. D., Du, Y., Yu, Q., Jones, T. R., Chen,
J., Jiang, T., Bustillo, J., and Calhoun, V. D. (2015).
In search of multimodal neuroimaging biomarkers of
cognitive deficits in schizophrenia. Biological Psychi-
atry, 78(11):794–804.
Tavor, I., Jones, O. P., Mars, R. B., Smith, S. M., Behrens,
T. E., and Jbabdi, S. (2016). Task-free mri predicts in-
dividual differences in brain activity during task per-
formance. Science, 352:216–220.
Wang, C., Pan, S., Long, G., Zhu, X., and Jiang, J. (2017).
Mgae: Marginalized graph autoencoder for graph
clustering. Proceedings of the 2017 ACM on Confer-
ence on Information and Knowledge Management.
Wu, Z., Pan, S., Chen, F., Long, G., Zhang, C., and Yu,
P. S. (2020). A comprehensive survey on graph neural
networks. IEEE Transactions on Neural Networks and
Learning Systems, pages 1–21.
Yang, X., Ramesh, P., Chitta, R., Madhvanath, S., Bernal,
E. A., and Luo, J. (2017). Deep multimodal represen-
tation learning from temporal data. IEEE Conference
on Computer Vision and Pattern Recognition (CVPR),
pages 5066–5074.
Zhang, Z., Cui, P., and Zhu, W. (2018). Deep learning on
graphs: A survey. CoRR.
Zhao, J., Xie, X., Xu, X., and Sun, S. (2017). Multi-view
learning overview: Recent progress and new chal-
lenges. Information Fusion, 38:43––54.
VISAPP 2021 - 16th International Conference on Computer Vision Theory and Applications
66
