
Point Cloud Upsampling and Normal Estimation using Deep Learning
for Robust Surface Reconstruction
Rajat Sharma
1
, Tobias Schwandt
1
, Christian Kunert
1
, Steffen Urban
2
and Wolfgang Broll
1
1
Ilmenau University of Technology, Virtual Worlds and Digital Games Group, Ehrenbergstraße 29, Ilmenau, Germany
2
Carl Zeiss AG, Corporate Research and Technology, Carl-Zeiss-Promenade 10, Jena, Germany
Keywords:
Point Cloud Upsampling, Surface Normal Estimation, Surface Reconstruction, Deep Learning.
Abstract:
The reconstruction of real-world surfaces is on high demand in various applications. Most existing reconstruc-
tion approaches apply 3D scanners for creating point clouds which are generally sparse and of low density.
These points clouds will be triangulated and used for visualization in combination with surface normals esti-
mated by geometrical approaches. However, the quality of the reconstruction depends on the density of the
point cloud and the estimation of the surface normals. In this paper, we present a novel deep learning archi-
tecture for point cloud upsampling that enables subsequent stable and smooth surface reconstruction. A noisy
point cloud of low density with corresponding point normals is used to estimate a point cloud with higher
density and appendant point normals. To this end, we propose a compound loss function that encourages the
network to estimate points that lie on a surface including normals accurately predicting the orientation of the
surface. Our results show the benefit of estimating normals together with point positions. The resulting point
cloud is smoother, more complete, and the final surface reconstruction is much closer to ground truth.
1 INTRODUCTION
Point clouds are one special representation of objects
in 3D space. The recent availability of large range 3D
scanner devices has led to the research and develop-
ment in many areas of point cloud processing (Wein-
mann, 2016). Classically, large amounts of hand-
crafted features were extracted from the point clouds
(e.g., eigenvalues or entropy), making sophisticated
neighborhood and feature selection necessary. Al-
though in the area of deep learning, there has not
been much done in the early years. But since the
adaption of PointNet (Qi et al., 2016) and PointNet++
(Qi et al., 2017) much work has been done on point
clouds. These deep networks are trained to alleviate
the process of feature engineering and selection and
have done very well in the area of object classification
and segmentation. The feature extraction and classi-
fication accuracy is further improved with new archi-
tectures like Graph-CNNs (Zhang and Rabbat, 2018)
using graph convolution and Dynamic Graph-CNNs
(Wang et al., 2019) which also extracts edge features
using edge convolution.
In the case of deep learning, the representation of
a 3D object in space is very important as this basi-
cally determines the network structure as well as in-
put and output representations. In case of volumetric
representation, the network is applied to a 3D voxel
grid structure demonstrated in VoxNet (Maturana and
Scherer, 2015), OctnetFusion (Riegler et al., 2017b).
In our work, we use point based representation
to perform point cloud densification. Approaches
such as PU-Net (Yu et al., 2018b), EC-Net (Yu et al.,
2018a) etc. considers the problem of upsampling the
point clouds. All of these approaches consider only
point cloud as output but we also estimate the nor-
mals by upsampling. Surface normals are also an im-
portant property of point clouds. It has applications
in surface reconstruction, rendering as well as light-
ing calculations of 3D model which motivates us to
estimate point cloud with normals. We compare our
results with some of the mentioned approaches in this
paper. In conclusion our main contributions are:
• the extraction of features from 3D point cloud
patches to upsample a input point cloud using fea-
ture reshaping.
• being one of the first approaches for an accurate
prediction of surface normals along with upsam-
pled point clouds using a neural network.
• a novel loss function consisting of point and nor-
mal loss for a more accurate upsampling.
70
Sharma, R., Schwandt, T., Kunert, C., Urban, S. and Broll, W.
Point Cloud Upsampling and Normal Estimation using Deep Learning for Robust Surface Reconstruction.
DOI: 10.5220/0010211600700079
In Proceedings of the 16th International Joint Conference on Computer Vision, Imaging and Computer Graphics Theory and Applications (VISIGRAPP 2021) - Volume 5: VISAPP, pages
70-79
ISBN: 978-989-758-488-6
Copyright
c
2021 by SCITEPRESS – Science and Technology Publications, Lda. All rights reserved

This paper is structured as follows: in section 1, a
brief introduction into the research topic is provided
with some specific related work in section 2. Sub-
sequently in section 3, the network architecture as
well as the feature embedding and reshaping is em-
phasized. Section 4 describes the changes of the loss
function made to the architecture. The result of the
new provided approach is shown in section 5 in com-
parison to other related approaches. Inside section 6,
the findings and limitations are discussed. Next, all
findings are concluded in section 7 with a brief dis-
cussion and some possible future work.
2 RELATED WORK
In this section, we will review existing approaches
based on upsampling of point clouds and how they are
different from our approach. After discussing classic
optimization based methods, we will then look into
methods based on deep learning.
Early work on denoising point clouds is done in
Parameterization-free Projection for Geometry Re-
construction (Lipman et al., 2007) which uses the Lo-
cally Optimal Projection (LOP) operator for surface
prediction. In addition, this method introduces a reg-
ularization term to move the point near to the surface.
(Huang et al., 2009) proposes weighted LOP (WLOP)
to get a denoised and evenly distributed point cloud.
In addition, it also estimates the point normals. Since
these methods work well but fail at very sharp edges,
(Huang et al., 2013) introduces edge aware resam-
pling to preserve the features at sharp edges. It first
resamples points away from edges and calculate the
normals. Based on these reliable points and normals,
it progressively resamples towards the edges. L0 Min-
imization (Sun et al., 2015) takes point cloud and nor-
mals as input and resamples it such that all point lies
on the surface with correct normals.
Initially, volumetric approaches were used to
make high resolution voxel grids using deep learn-
ing for accurate surface reconstruction. VoxNet (Mat-
urana and Scherer, 2015) uses 3D convolution on
voxel grids for the classification tasks but the ap-
proach is limited to a 32
3
resolution. However, the
Octnet (Riegler et al., 2017b) approach utilizes the
convolution operation up to a level of 256
3
using
space partitioning by converting 3D voxel grids into
small octree structures. Based on Octnet, OctnetFu-
sion (Riegler et al., 2017a) takes low resolution Trun-
cated Signed Distance Function (TSDF) volume and
estimates higher resolution TSDF volume. Similarly,
other approaches like (H
¨
ane et al., 2019) also use oc-
trees instead of 3D volumes. Depending on this con-
crete data structure, these approaches suffer from per-
formance issue like memory and timing requirements
when increasing the input resolution.
In the point cloud domain, PU-Net (Yu et al.,
2018b) introduced a first point upsampling network.
They divide the mesh into small patches and group
the point w.r.t. different radii values and extract fea-
tures. Subsequently, all features are concatenated
and reshaped to yield upscaled point features. Based
on this architecture, they introduced another network
that preserves sharp edges called EC-Net (Yu et al.,
2018a). There is another network based on Gen-
erative Adversarial Networks (GANs) (Goodfellow
et al., 2014), PU-GAN (Li et al., 2019). All these
methods directly employ neural network on point
cloud. Recent work PUGeo-Net (Qian et al., 2020)
uses surface parameterization to map 3D surface to
2D parametric domain. They also estimates the nor-
mals with upsampled points. In contract to this
method, our method is directly employed on point
cloud.
Some work was also done on generating point
clouds from single images such as PointSetGenera-
tion (Fan et al., 2016) and DensePCR (Mandikal and
Babu, 2019). In addition, DensePCR also upsamples
the generated point cloud using multiple stages . But
all these above networks only consider point clouds
as output. Point normals are also an important prop-
erty for many applications from surface reconstruc-
tion to rendering. Using classical techniques, normal
calculation are subjective to noise and outliers. In this
paper, we propose to predict not only the point posi-
tions but also the corresponding normals using deep
learning.
Similarly for normals prediction, as of now PCP-
NET (Guerrero et al., 2018) and Nesti-Net (Ben-
Shabat et al., 2018) are existing deep learning ap-
proaches. PCPNET uses multi-level patches based
on different scale and predicts normals. Similarly,
Nesti-Net modifies the representation of point clouds
to multi-scale point statistics (MuPS) which is then
fed as input to CNN network. These networks only
predict normals w.r.t. corresponding point clouds. In
our work, we are upsampling the point clouds and
predict normals for each point with higher accuracy.
3 NETWORK ARCHITECTURE
For a given point cloud, our deep learning archi-
tecture upsamples the applied input and predicts the
point normals such that all points lie on the under-
lying surface with uniform distribution. Our deep
learning network includes feature embedding, feature
Point Cloud Upsampling and Normal Estimation using Deep Learning for Robust Surface Reconstruction
71
i) Input points
X
n
Input points
with normals
n x 6
ii) Local Feature Extraction Module
Input points
with normals
n x 6
Circles containing
neighbor points
mlp(32, 64, 128)
shared
Neighborhood feature
max pooling
X
l
n x 512
local features
iii) Global Feature Extraction Module
Input points
with normals
mlp(32, 64, 64, 128, 256, 512)
shared
n x 512
max
pool
X
g
512
global features
iv) Concatenated
features
X
n
X
l
X
g
n x (6 + 128 + 512)
mlp(512, 256, 128)
shared
n x 128
v) Features
reshaping - I
2n x 64
mlp(64, 32)
shared
2n x 32
vi) Features
reshaping - II
4n x 16
mlp(16, 6)
4n x 6
vii) Dense Point Cloud
with normals
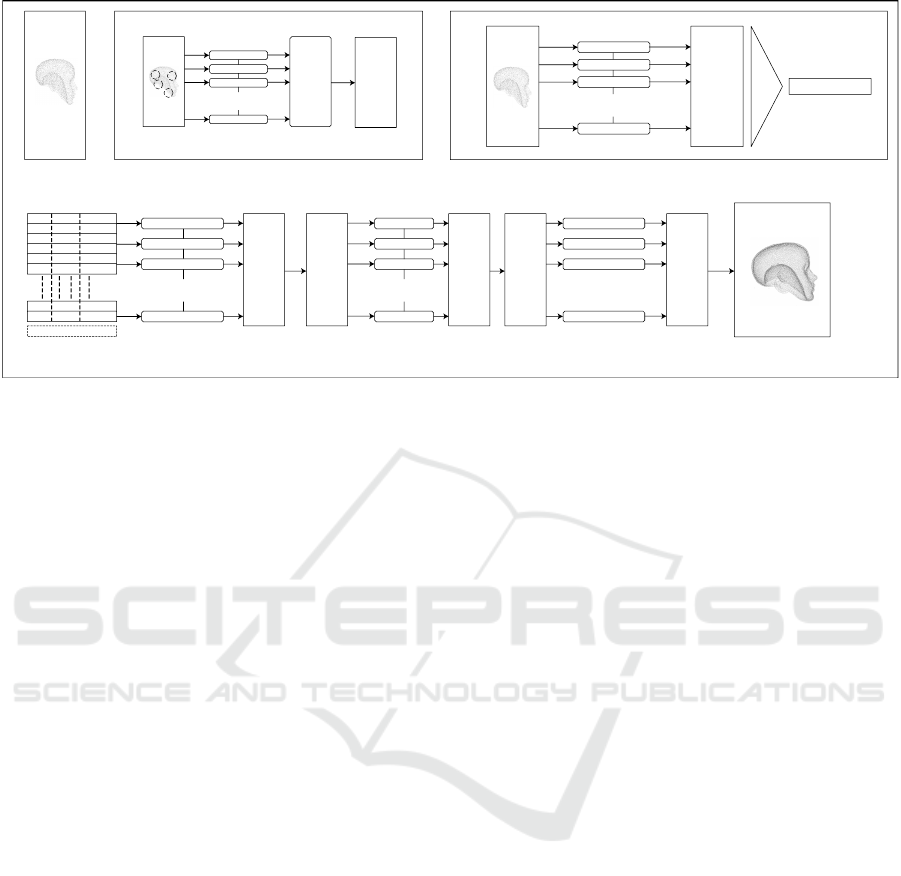
Figure 1: Proposed network architecture for point cloud upsampling and normal estimation i) Input point cloud with normals
ii) Local feature extraction iii) Global feature extraction iv) Feature concatenation v) Feature reshaping in points dimension
by factor of 2 followed by series of shared MLPs vi) Feature reshaping in points dimension by factor of 2 followed by series
of shared MLPs vii) Output point cloud with normals.
reshaping (expansion in point dimension), and point
coordinate regression. The transformation of the in-
put point cloud to feature space is discussed in 3.1.
Here, feature extraction and concatenation is done.
The reshaping of features in point dimensions to up-
sample points is discussed in section 3.2. After fea-
ture expansion, a series of shared Multi Layer Percep-
trons (MLPs) with shared weights regresses the out-
put point clouds with normals which is discussed in
section 3.3. All these components allow us to cap-
ture upsampled point clouds with point normals. The
detailed architecture is depicted in Figure 1.
3.1 Feature Embedding
The main intent of the network is to capture the salient
features of the input point cloud to learn its neighbor
points. This is done by transforming the input points
to high level vector space (called features). In our
network, we use a combination of global and local
feature extraction to better capture the properties of
the point cloud.
3.1.1 Global Features
The knowledge of global features gives the network
a better understanding of the object as a whole, e.g.,
features such density and spacing are model specific.
The PointNet (Qi et al., 2016) architecture uses a se-
ries of shared MLPs with shared weights to extract
the global features for classification and segmentation
tasks. We also uses the same network to extract global
features. For a input point cloud X
p
with shape n × 6,
the output of global features X
g
is 1×g where g is the
number of features extracted in the last MLP layer.
3.1.2 Local Features
Global features only capture the overall property of
an object but do not contain information about local
properties. Local features are the most essential part
of this network. The local features carry the neigh-
borhood properties as well as surface properties such
as normals. Local features prove to be very helpful in
tasks like point cloud segmentation or surface estima-
tion. We have PointNet (Qi et al., 2016) that extracts
features per point by using a series of MLPs. But it
does not induce local features based on distance met-
rics. An improvement to PointNet, PointNet++ (Qi
et al., 2017) captures patches of neighborhood points
for every point in the input set and performs a series
of MLPs on every patch and captures local informa-
tion. We use a series of sample and grouping modules
at different scales like in PointNet++ to extract hier-
archical features and combine all those information
into a single feature layer. This is also called multi-
resolution grouping. For an input point cloud X
p
with
shape n × 6, the output of local features X
l
is n × l
where l is the number of features extracted in the last
MLP layer of local features module.
3.1.3 Feature Concatenation
We concatenate all the learned features, i.e., global as
well as local features with input features (i.e., input
point cloud) along the feature dimension. The output
VISAPP 2021 - 16th International Conference on Computer Vision Theory and Applications
72
after concatenation is n × (6 + l + g). Then again we
uses a series of MLPs on these concatenated features
before doing feature reshaping. The output shape af-
ter these operation is n × d where d is multiple of the
scaling factor(=up_ratio, which is 4 in our case).
3.2 Feature Reshaping
Feature reshaping is used to expand features in point
dimension space. Since both points and features are
interchangeable this means that the learned features
can also be the neighbor points. Taking this idea, we
reshape our features in point dimension to upscale the
points. The new shape of point features after this op-
eration is (n×up_ratio)×(d ÷up_ratio). Reshap-
ing is always done by a factor of 2.
3.3 Coordinates Regression
After feature reshaping, we use series of MLPs lay-
ers to regress point cloud outputs with correspond-
ing normals. The shape of output point cloud is
(n × up_ratio) × 6. The validation of the final out-
put w.r.t. the ground truth is done by a compound loss
function which is discussed in the next section.
4 LOSS FUNCTION
We propose a compound loss function that consists of
point and normal losses. The point loss is presented
in section 4.1 and the normal loss in section 4.2.
4.1 Point Loss
For point clouds, the Chamfer Distance (CD) (Fan
et al., 2017) and Earth Mover’s Distance (EMD)
(Rubner et al., 2000) are the most suitable cost func-
tions. CD tries to find the minimum distance between
two sets of points, i.e., in our case the ground truth
and the estimated point clouds. In the following, let
the ground truth point cloud be X
p
and the network
output be
b
X
p
. The CD is defined as:
d
cd
(
b
X
p
, X
p
) =
∑
x∈
b
X
p
min
y∈X
p
k
x − y
k
2
2
+
∑
y∈X
p
min
x∈
b
X
p
k
x − y
k
2
2
(1)
EMD tries to solve an optimization problem. The
mathematical equation of EMD for output
b
X
p
and
ground truth X
p
is shown in Eq. (2) where φ :
b
X
p
→ X
p
is a bijection:
d
emd
(
b
X
p
, X
p
) = min
φ:
b
X
p
→X
p
∑
x∈
b
X
p
k
x − φ(x))
k
2
(2)
Both functions are fully differentiable. A Com-
parison of both functions can be seen in (Fan et al.,
2017). However, EMD is more accurate than the CD.
EMD is more computationally intensive and requires
more time and memory for high density point clouds.
In our network, we choose CD as a cost function for
the point loss.
It may happen that the predicted points lie too
close to their neighbor points and this may lead to a
non-uniform gathering of points in the point cloud.
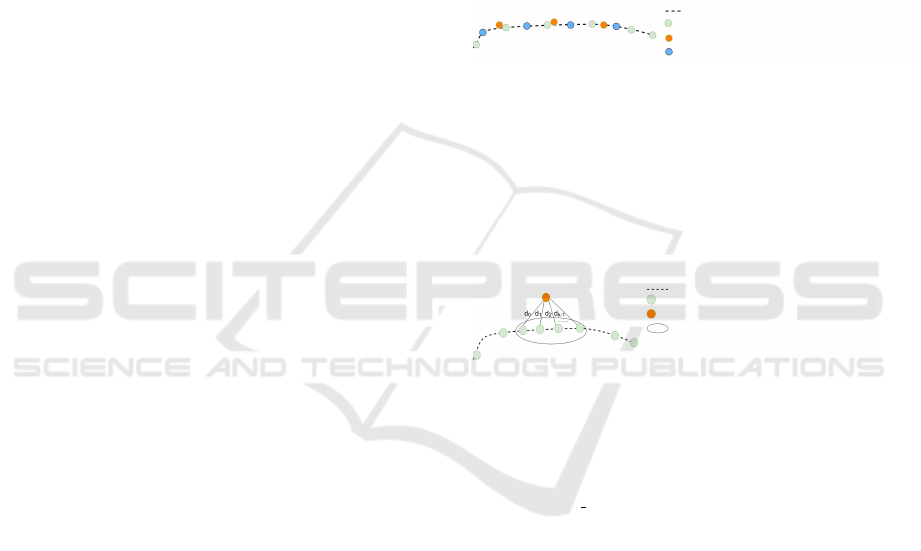
This behavior is depicted in Figure 2
Underlying surface
Original points on underlying surface
Predicted points
Expected points on surface
Figure 2: Non-Uniform gathering of predicted points
around the original points in the case of optimization using
the chamfer distance CD.
Therefore, we also include point neighbor loss as
shown in Figure 3. This ensures that the new points
are not only closer to the ground truth but also to K
nearest points in the predicted points. The nearest
neighbor loss is shown in Eq. (3). For our training,
Underlying surface
Original points on underlying surface
New points
Containing k neighbor points P
0
to P
k−1
knn points
Figure 3: Uniform distribution on underlying surface using
knn point distance minimization.
we set k = 15.
d
point knn
(
b
X
p
, X
p
) = min
x∈
b
X
p
k−1
∑
i=0
k
x − y
i
k
2
2
(3)
where: y
i
∈ X
p
are the k nearest neighbors to x.
Hence, the overall loss function for points is a
combination of both CD and nearest neighbor loss.
4.2 Normal Loss
For predicting accurate normals, we use a compound
loss function too. For all predicted points in the up-
sampled point cloud, the corresponding point normals
should be close to the ground truth and the adjacent
points. This also ensures that surface reconstruction
(e.g., using Poisson Reconstruction) is robust. Hence,
we use an euclidean distance metric to calculate the
deviation between estimated and ground truth point
normals. The normal loss between predicted normals
b
N
p
and ground truth normals N
p
is shown in Eq. (4).
Point Cloud Upsampling and Normal Estimation using Deep Learning for Robust Surface Reconstruction
73

l
normal
(
b
N
p
, N
p
) = min
∑
b
nε
b
N
p
,n∈N
p
k
b
n − n
k
2
2
(4)
In addition, we need to take care that the esti-
mated normals are orthogonal to the underlying sur-
face. Since normals are perpendicular to the surface,
we measure the cosine similarity which is shown in
Eq. (5).
l
normal
orth
(
b
X
p
,
b
N
p
) = min
k−1
∑
i=0
h
p
l
− p
i
, n
l
i
k
p
l
− p
i
kk
n
l
k
(5)
where: p
i
, p
l
∈ X
p
, p
i
are knn to p
l
and n
l
normal to
p
l
,
h
P, N
i
is a dot product.
Moreover, we took the assumption that for every k
nearest point the normals should be the same. There-
fore, we try to minimize this difference for each esti-
mated normal. This term acts as an additional regu-
larization on normal estimation and enforces a smooth
neighborhood. For our training, we set k = 15. The
loss is shown in Eq. (6).
l
normal knn
(
b
N
p
) = min
x∈
b
N
p
k−1
∑
i=0
k
x − y
i
k
2
2
(6)
where: y
i
∈
b
N
p
are knn normals to x.
4.2.1 Overall Loss
The overall loss function is a combination of both
point loss and normal loss. Since the main objective
is that new points are close to the input points, more
weight is given to the point CD loss. The final loss
function for training the network is given below with
their corresponding weights. For our training we set
w
1
= 1,w
2
= 0.1, w
3
= 0.05, w
4
= 0.0001, w
5
= 0.0001.
We set larger values for the weights of point loss as
compared to normal loss. The weights used by the
loss function are selected based on ablation study. We
visualized the effect of different weights on the out-
put results and thus, came up with these weights. The
knn loss for normal shows more error in case of sharp
edges thus have very small weight.
loss = w
1
d
cd
+ w
2
d
point knn
+ w
3
l
normal
+w
4
l
normal orth
+ w
5
l
normal knn
(7)
5 EVALUATION
5.1 Implementation Details and
Network Training
We implemented our network shown in Figure 1 using
the PyTorch framework. The architecture is based on
the PyTorch implementation of pointnet++
1
for our
network. Our code is open-source and available on-
line
2
.
However, the input point cloud size is set to 4096
points. We use the Adam optimizer (Kingma and Ba,
2014) with a learning rate of 1e − 3 and a weight de-
cay of 1e − 5. The batch size is set to 20 and we train
the network for 500 epochs. For inference, we do
not feed the entire input to the network. We create
patches of input point clouds and process each patch
individually. Merging all upsampled patches results
in very large number of points in the final result and
points may be too closer in the overlapping region.
Therefore, we use farthest point sampling to sample
the merged point cloud patches to exactly four times
of the size of the input point cloud.
5.2 Datasets
Since there are no datasets directly available for point
cloud upsampling with normal inference, we create
them artificially by downsampling point clouds from
existing point cloud datasets. We use the PU-Net (Yu
et al., 2018b) dataset providing point cloud patches
segmented from large meshes. The dataset consists
of 4000 patches containing 4096 points in each point
cloud with corresponding normals. We use non-
uniform downsampling to extract 1024 points from
each point cloud to feed them as input to the net-
work. To avoid overfitting, we apply on-the-fly data
augmentation using random shifting, rotation, scal-
ing, and adding random Gaussian noise.
5.3 Results and Comparisons
In this section, we will compare the results from our
network w.r.t. to other upsampling networks PU-Net
(Yu et al., 2018b), EC-Net (Yu et al., 2018a). We use
chamfer distance CD and Hausdorff Distance (HD)
(Berger et al., 2013) for the evaluation of the network
output. All methods have been tested with an upsam-
pling ratio of 4. Figure 4 shows our results w.r.t. other
approaches. It can be clearly seen from the figure that
PU-Net results are more noisy on the surface as com-
pared to EC-Net. But our results clearly outperform
both PU-Net and EC-Net and are less prone to noise.
The quantitative results for Figure 4 is shown in Table
1. It can be infered from the table that the values of
CD and HD for our network are small when compared
to PU-Net and EC-Net.
For normal evaluation, we compare the final sur-
face reconstruction based on the predicted normals
1
https://github.com/erikwijmans/Pointnet2\ PyTorch
2
https://github.com/rjtshrm/point-normals-upsampling
VISAPP 2021 - 16th International Conference on Computer Vision Theory and Applications
74
pc-1
pc-2
pc-3
pc-4
i) Input
ii) PU-Net iii) EC-Net iv) Ours v) Ground truth
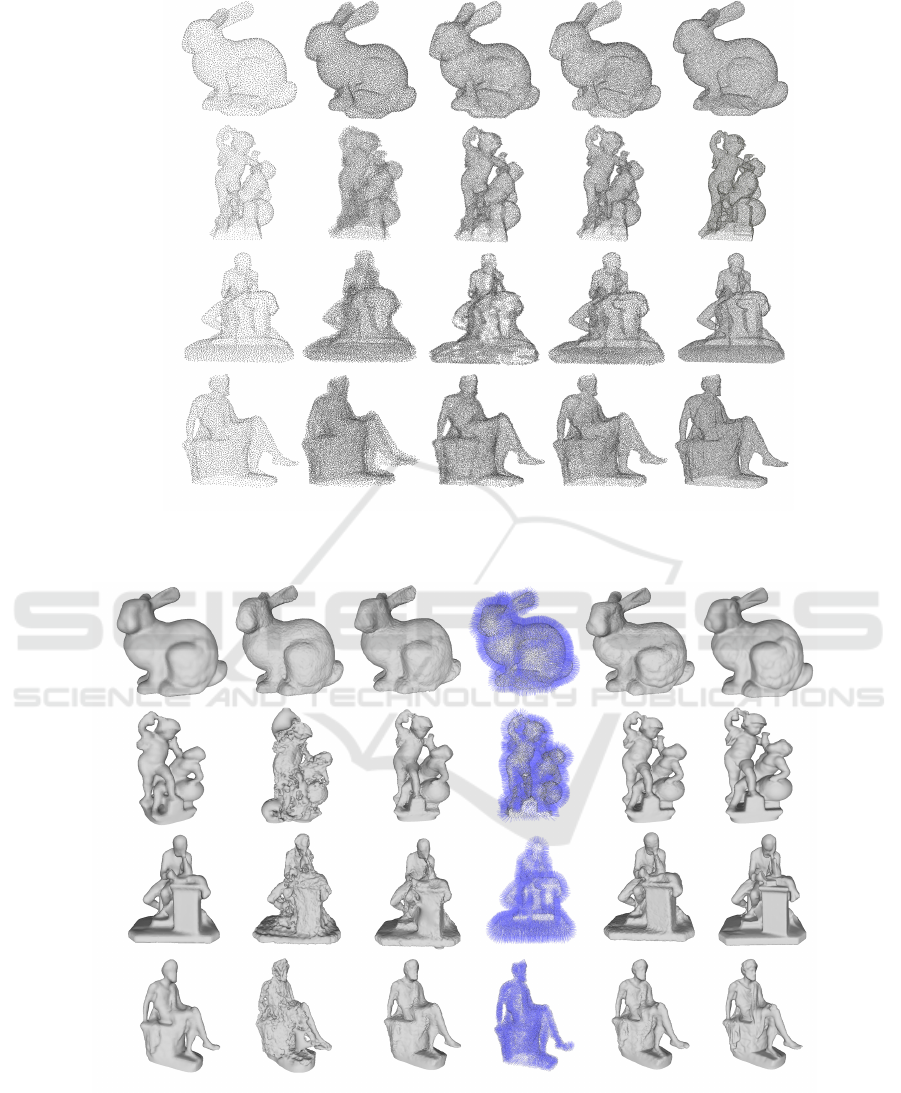
Figure 4: Upsampled point clouds from different methods with input of 5000 point clouds i) Input ii) PU-Net results iii)
EC-Net results iv) Our results v) Ground truth.
pc-1
pc-2
pc-3
pc-4
i) Input
ii) PU-Net iii) EC-Net iv) Our Normals v) Our reconstruction vi) Ground truth
Figure 5: Reconstruction results from different methods with input of 5000 point clouds i) Input ii) PU-Net results iii) EC-Net
results iv) Our normals v) Our reconstruction vi) Ground truth.
Point Cloud Upsampling and Normal Estimation using Deep Learning for Robust Surface Reconstruction
75
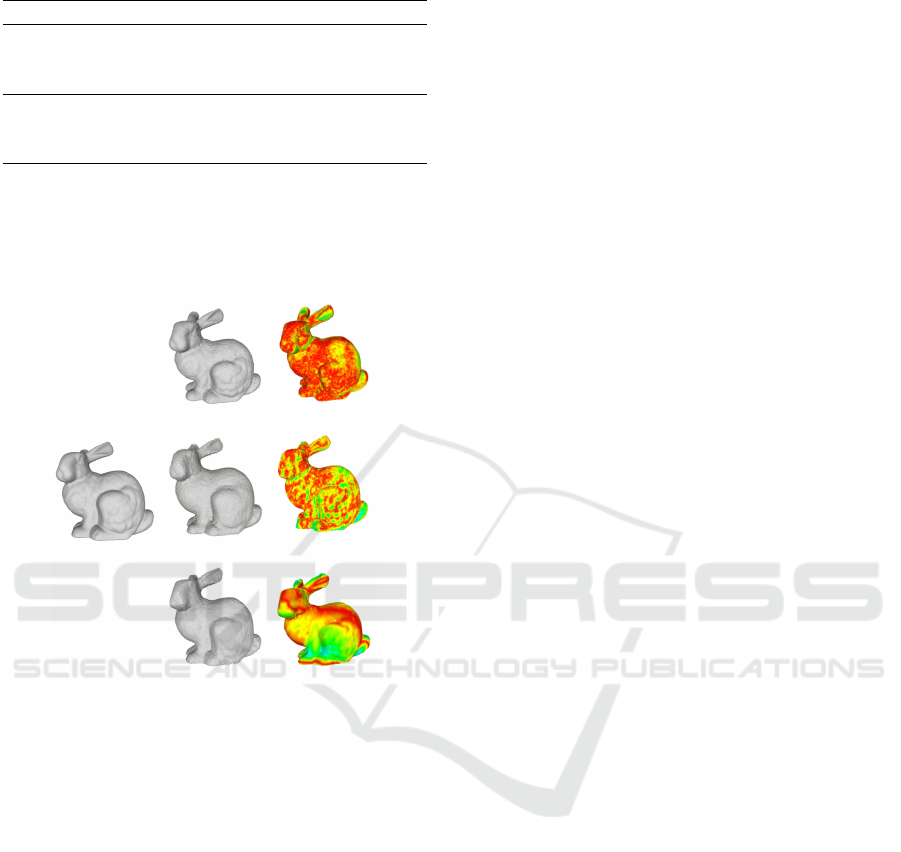
Table 1: Quantitative result with n=5000 points.
10
−3
Method pc-1 pc-2 pc-3 pc-4
CD
PU-Net 0.26 0.22 0.19 0.15
EC-Net 0.20 0.058 0.13 0.03
Ours 0.18 0.06 0.036 0.028
HD
PU-Net 10.63 10.04 10.14 8.84
EC-Net 9.37 4.01 4.65 4.00
Ours 9.02 3.76 4.00 3.86
and ground truth meshes. We use meshlab (Cignoni
et al., 2008) to reconstruct the point cloud to a 3D
model. The final Poisson Reconstructions for the pre-
dicted point clouds as shown in Figure 4 are depicted
in Figure 5.
i) Ground truth ii) PU-Net
iii) Quality (PU-Net)
w.r.t. ground truth
ii) Ours
iii) Quality (Ours)
w.r.t. ground truth
ii) EC-Net
iii) Quality (EC-Net
w.r.t. ground truth
Figure 6: Quality of our result w.r.t. ground truth for bunny
dataset containing 20000 point clouds i) Ground truth ii)
Our, PU-Net, EC-Net results (4x upsampling with input
of 5000 point clouds) iii) Vertex Quality mapper (devi-
ation from ground truth using red-green-blue color map)
Red=zero error, Blue=high error.
Figure 6 shows the deviation of the final mesh
compared to the ground truth using RGB color cod-
ing. Red color represents the zero error, blue repre-
sents maximum error and the transition from red to
blue has increasing error values. It can be seen that
our results for the bunny dataset are better when com-
pared to PU-Net and EC-Net. Figure 7 depicts some
additional results of our method compared to state-of-
the-art approaches. In the first row (head point cloud),
PU-NET creates multiple layers on the surface which
leads to wrong surface reconstructions. Similarly EC-
NET estimates a point cloud that is more noisy than
ours. Unlike these networks, our network also pre-
dicts the normals which can be seen in last column
Figure 7. The reconstruction based on these normals
is shown in Figure 8.
6 DISCUSSION AND
LIMITATIONS
Point clouds are an important representation for 3D
objects. They have a wide range of applications from
visualization and rendering to surface reconstruction.
These applications also consider surface normals in
addition to the points. Therefore, our approach addi-
tionally estimates surface normals along with the up-
sampled point cloud. We showed that both global fea-
tures as well local features are required to learn the
geometry of an input point cloud. The output point
cloud based on our feature extraction and concatena-
tion is more accurate and estimated surface normals
are mostly oriented in the correct direction. It can be
seen from the results that our method predicts more
consistent and less noisy point clouds compared to the
state of the art (PU-Net and EC-Net). The final sur-
face reconstruction based on the output point normals
is also better.
But our network also has some limitations. One
of the limitations is that our network does not work
well on very sparse inputs. Our results can be seen
in Figure 9 w.r.t. to the ground truth. The normals
predicted for sparse inputs are also not oriented in the
right direction which is why the final reconstruction is
also distorted. We also apply a patch based approach
for the inference and this may result in misalignments
at the patch borders. Hence, the Poisson Reconstruc-
tion is not perfectly smooth in areas where patches
overlap. Also, our network is not capable of shape
completion, i.e., it does not synthesize missing parts
in shapes. Our main focus in this paper was to up-
sample point clouds. Shape completion is a separate
problem, requiring further research.
7 CONCLUSION
In this paper, we presented a deep learning network
to not only upsample the point cloud but also to es-
timate corresponding surface normals. Our network
uses input features, local, and global features to learn
the final estimation of point cloud data. We intro-
duced feature reshaping in point dimension to upsam-
ple the point clouds. We also introduced a compound
loss function combining point and normal loss. It en-
sures that new points are on underlying surfaces and
the normals estimated are orthogonal to surfaces with
correct orientations. Moreover, we showed that pre-
dicting normals results in smoother and more consis-
tent upsampled point clouds. This is especially ben-
eficial for tasks like surface reconstruction. In this
work, we focused on raw point clouds with normals.
VISAPP 2021 - 16th International Conference on Computer Vision Theory and Applications
76
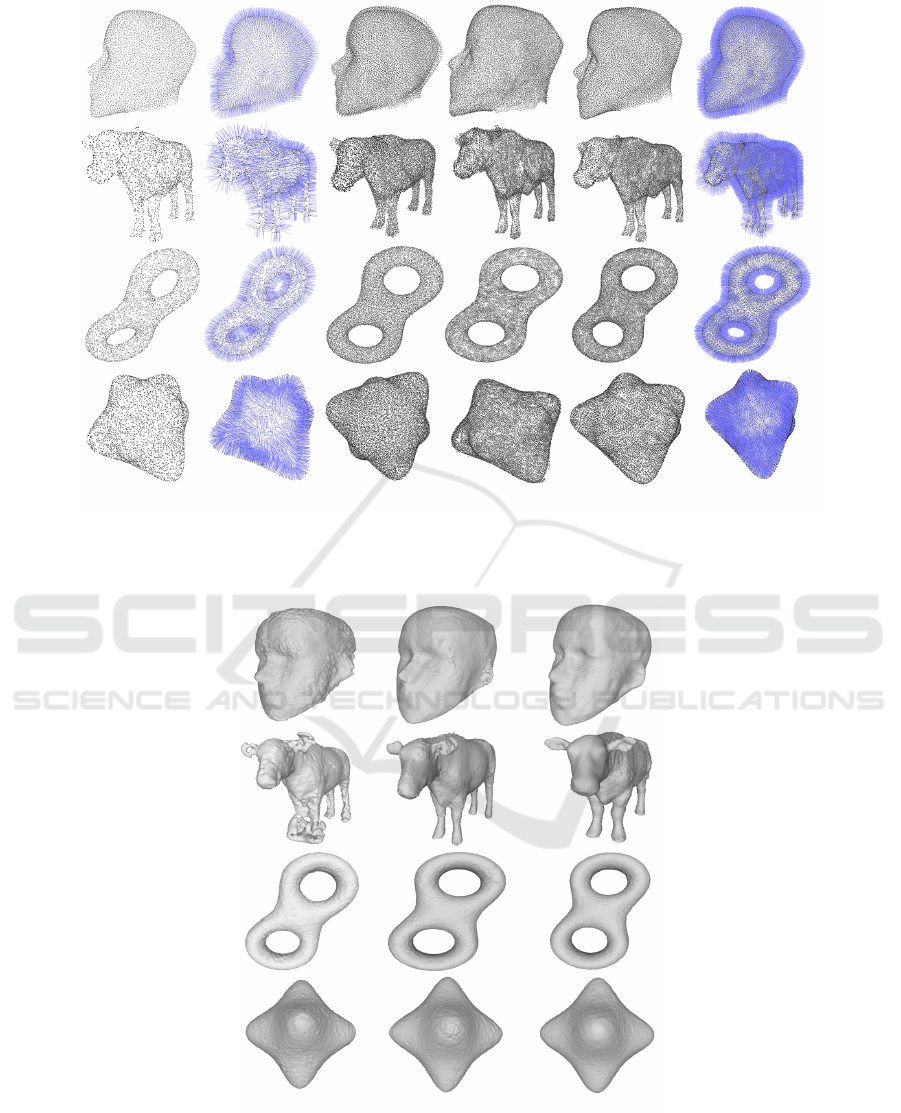
i) Input ii) Input normals
iii) PU-Net iv) EC-Net v) Ours vi) Our with normals
Figure 7: Additional results: Upsampled point clouds from different method w.r.t. to others (Input 5000 points and 4x
upsampled output) i) Input point cloud ii) Input normals iii) PU-Net results iv) EC-Net results v) Our results (point cloud) vi)
Our results (point cloud normals).
i) PU-Net ii) EC-Net iii) Ours
Figure 8: Additional results: Surface reconstruction result comparisons of different architecture w.r.t. to others (Input 5000
points and 4x upsampled output) i) PU-Net ii) EC-Net iii) Ours.
Point Cloud Upsampling and Normal Estimation using Deep Learning for Robust Surface Reconstruction
77
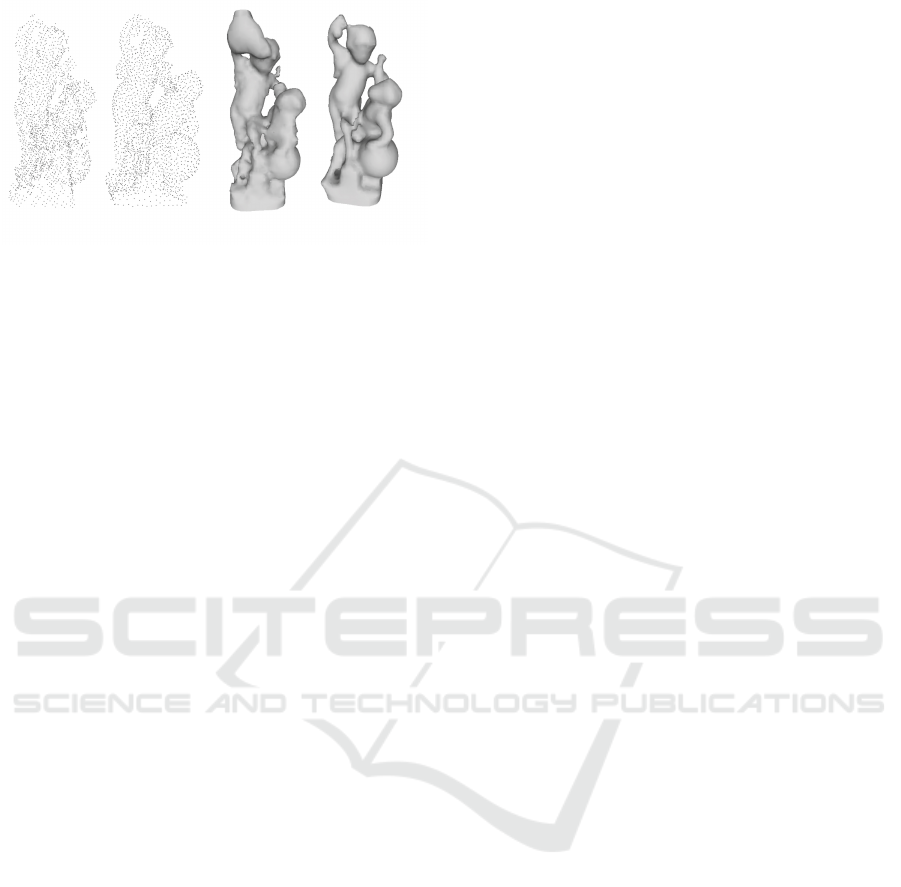
i) Ours ii) GT iii) Our reconstruction iv) GT reconstruction
Figure 9: Upsampling results of sparse point cloud (input =
625 points and output = 25000 points).
In future work we will also extend the network to in-
clude colored point clouds and estimate the color for
each upsampled point. Another direction of future
work is looking into shape completion to fill in holes
in the input point cloud, which often result from real
world scans.
ACKNOWLEDGEMENTS
The underlying research of these results has been par-
tially funded by the Free State of Thuringia with the
number 2015 FE 9108 and co-financed by the Euro-
pean Union as part of the European Regional Devel-
opment Fund (ERDF).
REFERENCES
Ben-Shabat, Y., Lindenbaum, M., and Fischer, A. (2018).
Nesti-net: Normal estimation for unstructured 3d
point clouds using convolutional neural networks.
arXiv preprint arXiv:1812.00709.
Berger, M., Levine, J. A., Nonato, L. G., Taubin, G., and
Silva, C. T. (2013). A benchmark for surface recon-
struction. ACM Trans. Graph., 32(2):20:1–20:17.
Cignoni, P., Callieri, M., Corsini, M., Dellepiane, M.,
Ganovelli, F., and Ranzuglia, G. (2008). MeshLab:
an Open-Source Mesh Processing Tool. In Scarano,
V., Chiara, R. D., and Erra, U., editors, Eurographics
Italian Chapter Conference. The Eurographics Asso-
ciation.
Fan, H., Su, H., and Guibas, L. J. (2016). A point set gen-
eration network for 3d object reconstruction from a
single image. CoRR, abs/1612.00603.
Fan, H., Su, H., and Guibas, L. J. (2017). A point set gener-
ation network for 3d object reconstruction from a sin-
gle image. In Proceedings of the IEEE conference on
computer vision and pattern recognition, pages 605–
613.
Goodfellow, I., Pouget-Abadie, J., Mirza, M., Xu, B.,
Warde-Farley, D., Ozair, S., Courville, A., and Ben-
gio, Y. (2014). Generative adversarial nets. In
Advances in neural information processing systems,
pages 2672–2680.
Guerrero, P., Kleiman, Y., Ovsjanikov, M., and Mitra, N. J.
(2018). PCPNet: Learning local shape properties
from raw point clouds. Computer Graphics Forum,
37(2):75–85.
H
¨
ane, C., Tulsiani, S., and Malik, J. (2019). Hierarchical
surface prediction. TPAMI.
Huang, H., Li, D., Zhang, H., Ascher, U., and Cohen-Or, D.
(2009). Consolidation of unorganized point clouds for
surface reconstruction. ACM SIGGRAPH Asia 2009
papers on - SIGGRAPH Asia ’09, page 1.
Huang, H., Wu, S., Gong, M., Cohen-Or, D., Ascher, U.,
and Zhang, H. R. (2013). Edge-aware point set resam-
pling. ACM Transactions on Graphics, 32(1):1–12.
Kingma, D. P. and Ba, J. (2014). Adam: A
method for stochastic optimization. arXiv preprint
arXiv:1412.6980.
Li, R., Li, X., Fu, C.-W., Cohen-Or, D., and Heng, P.-A.
(2019). Pu-gan: a point cloud upsampling adversarial
network. In IEEE International Conference on Com-
puter Vision (ICCV).
Lipman, Y., Cohen-Or, D., Levin, D., and Tal-Ezer, H.
(2007). Parameterization-free projection for geome-
try reconstruction. ACM Transactions on Graphics,
26(3):22.
Mandikal, P. and Babu, R. V. (2019). Dense 3d point cloud
reconstruction using a deep pyramid network. In Win-
ter Conference on Applications of Computer Vision
(WACV).
Maturana, D. and Scherer, S. (2015). Voxnet: A 3d con-
volutional neural network for real-time object recog-
nition. In 2015 IEEE/RSJ International Conference
on Intelligent Robots and Systems (IROS), pages 922–
928. IEEE.
Qi, C. R., Su, H., Mo, K., and Guibas, L. J. (2016). Pointnet:
Deep learning on point sets for 3d classification and
segmentation. arXiv preprint arXiv:1612.00593.
Qi, C. R., Yi, L., Su, H., and Guibas, L. J. (2017). Point-
net++: Deep hierarchical feature learning on point sets
in a metric space. In Guyon, I., Luxburg, U. V., Ben-
gio, S., Wallach, H., Fergus, R., Vishwanathan, S., and
Garnett, R., editors, Advances in Neural Information
Processing Systems 30, pages 5099–5108. Curran As-
sociates, Inc.
Qian, Y., Hou, J., Kwong, S., and He, Y. (2020). Pugeo-
net: A geometry-centric network for 3d point cloud
upsampling. arXiv, pages arXiv–2002.
Riegler, G., Ulusoy, A. O., Bischof, H., and Geiger, A.
(2017a). Octnetfusion: Learning depth fusion from
data. In Proceedings of the International Conference
on 3D Vision.
Riegler, G., Ulusoy, A. O., and Geiger, A. (2017b). Octnet:
Learning deep 3d representations at high resolutions.
In Proceedings of the IEEE Conference on Computer
Vision and Pattern Recognition.
Rubner, Y., Tomasi, C., and Guibas, L. J. (2000). The earth
mover’s distance as a metric for image retrieval. In-
ternational journal of computer vision, 40(2):99–121.
VISAPP 2021 - 16th International Conference on Computer Vision Theory and Applications
78

Sun, Y., Schaefer, S., and Wang, W. (2015). Denoising point
sets via L0 minimization. Computer Aided Geometric
Design, 35-36:2–15.
Wang, Y., Sun, Y., Liu, Z., Sarma, S. E., Bronstein, M. M.,
and Solomon, J. M. (2019). Dynamic graph cnn
for learning on point clouds. ACM Transactions on
Graphics (TOG).
Weinmann, M. (2016). Reconstruction and Analysis of 3D
Scenes: From Irregularly Distributed 3D Points to
Object Classes. Springer Publishing Company, Incor-
porated, 1st edition.
Yu, L., Li, X., Fu, C.-W., Cohen-Or, D., and Heng, P.-A.
(2018a). Ec-net: an edge-aware point set consolida-
tion network. In ECCV.
Yu, L., Li, X., Fu, C.-W., Cohen-Or, D., and Heng, P.-A.
(2018b). Pu-net: Point cloud upsampling network. In
Proceedings of IEEE Conference on Computer Vision
and Pattern Recognition (CVPR).
Zhang, Y. and Rabbat, M. (2018). A graph-cnn for 3d point
cloud classification. In International Conference on
Acoustics, Speech and Signal Processing (ICASSP),
Calgary, Canada.
Point Cloud Upsampling and Normal Estimation using Deep Learning for Robust Surface Reconstruction
79
