
Clustering Pathologic Voice with Kohonen SOM and Hierarchical
Clustering
Alessa Anjos de Oliveira
1,2
, Maria Eugênia Dajer
2
and João Paulo Teixeira
1
1
Research Centre in Digitalization and Intelligent Robotics (CEDRI), Instituto Politecnico de Braganca,
Campus Sta. Apolonia, 5301 857, Braganca, Portugal
2
Federal University of Technology of Paraná, Campus Cornélio Procópio, 86300 000, Cornélio Procópio, Brazil
Keywords: Acoustic Parameters, Clustering, Hierarchical Clustering, Kohonen's Self-Organizing Maps, Unsupervised
Artificial Neural Networks, Voice Pathologies.
Abstract: The main purpose of clustering voice pathologies is the attempt to form large groups of subjects with similar
pathologies to be used with Deep-Learning. This paper focuses on applying Kohonen's Self-Organizing Maps
and Hierarchical Clustering to investigate how these methods behave in the clustering procedure of voice
samples by means of the parameters absolute jitter, relative jitter, absolute shimmer, relative shimmer, HNR,
NHR and Autocorrelation. For this, a comparison is made between the speech samples of the Control group
of subjects, the Hyper-functional Dysphonia and Vocal Folds Paralysis pathologies groups of subjects. As a
result, the dataset was divided in two clusters, with no distinction between the pre-defined groups of
pathologies. The result is aligned with previous result using statistical analysis.
1 INTRODUCTION
Pathologies related with the human phonation
apparatus can affect the characteristics of the voice,
and can be very limitative for the patients, depending
on the pathology and its degree of evolution. Some
pathologies impose serious limitation on voice and
consequentially on daily living, in addition to causing
serious damage on patient’s health (Teixeira, Alves
and Fernandes, 2020). Some of the most common
pathologies are: Carcinoma, Chronic Laryngitis,
Cysts, Granuloma, Intubation Granuloma,
Hypopharyngeal Tumor, Laryngeal Tumor, Reinke’s
Edema, Vocal Fold Paralysis, Vocal Fold Polyps,
Functional Dysphonia, Hyper-functional Dysphonia,
Hypofunctional Dysphonia, Hypotonic Dysphonia
and Psychogenic Dysphonia (Teixeira J. P.,
Fernandes, Teixeira F., Fernandes, 2018).
The traditional diagnostic exams can be very
cumbersome and expensive for the patient.
Vocal acoustic analysis techniques can allow a
screening test or pre-diagnose that can avoid the
traditional exams to several patients. These
techniques may also be used as a valuable tool for the
otolaryngologist exam. In the area of rehabilitation,
well-designed tools can be useful for the evaluation
of the recover after the treatment.
Support decision system for voice pathologies
diagnose and identification based on acoustic analysis
have been under research recently as alternative to
invasive technics like endoscopy, laryngoscopy and
stroboscopic exams (Martínez, Lleida, Ortega,
Miguel and Villalba, 2012), (Teixeira J. P.,
Fernandes, and Alves, 2017).
With this different approach we are able to do the
classification between healthy or pathologic voices or
even the identification of the pathology. Anyhow, the
length of the available dataset for each voice
pathology has shown as the bottleneck to use more
sophisticated and powerful Deep Learning tools such
as LSTM recurrent Deep Neural Networks (DNN), 1-
D Convolutional DNN or transfer learning
techniques, because of the higher dimension of the
dataset required (Guedes, Junior, Teixeira F.,
Fernandes J. and Teixeira J. P, 2018), (Teixeira F.,
and Teixeira J. P., 2020). This paper intends to step
forward searching the solution for the scarcity of the
existent speech datasets to classify the pathology and
not simply classify between healthy or control. The
main idea is to cluster similar pathologies based on
the traditional acoustic parameters used for voice
158
de Oliveira, A., Dajer, M. and Teixeira, J.
Clustering Pathologic Voice with Kohonen SOM and Hierarchical Clustering.
DOI: 10.5220/0010210901580163
In Proceedings of the 14th International Joint Conference on Biomedical Engineer ing Systems and Technologies (BIOSTEC 2021) - Volume 4: BIOSIGNALS, pages 158-163
ISBN: 978-989-758-490-9
Copyright
c
2021 by SCITEPRESS – Science and Technology Publications, Lda. All rights reserved

pathologies in order to enlarge the dataset for some
clustered pathologies (Fernandes J. et al, 2019).
Assessment of voice pathologies can be done by
means of acoustic analysis of the voice signal,
through the analysis of a set of parameters. In the
literature review other speech parameters can be
found like Energy, different order of moment,
kurtosis and relations between energy bandwidths
(Panek, Skalski, Gajda and Tadeusiewicz, 2015) and
(Teixeira J. P., Fernandes, and Alves, 2017). Tsanas,
Little, McSharry & Ramig (2010) used several order
of Mel-Frequency Cepstrum Coefficients (MFCC),
delta MFCC, ratio of the log transformed means
(VFER-NSR), extend of turbulent noise (DFA) and
several measures of Fundamental Frequency (F0) for
Parkinson’s disease symptoms severity.
In this work parameters such absolute jitter,
relative jitter, absolute shimmer, relative shimmer,
harmonic-to-noise ratio, noise-to-harmonic ratio,
autocorrelation will be used as a reference (Felippe,
Grillo and Grechi, 2006), (Finger, Cielo and Schwarz,
2009), (Teixeira J. P., and Fernandes P. O., 2014) and
(Fernandes J. et al, 2019).
The aforementioned set of parameters, were used
to apply clustering techniques that will contribute to
the organization of data into groups by means of the
similarity among the analyzed elements. Thus,
samples that belong to the same set tend to be more
similar than the rest of the elements formed by other
sets (Jain, Murty and Flynn, 1999). To achieve
clustering using an ANN, unsupervised learning is
required. This means that the network receives no
guidance, i.e., only the set of inputs is provided, there
is no predefined output (Jain, Murty and Flynn,
1999), (Haykin, 1999), (Pavel, 2006).
In this work, clustering techniques will be applied
in order to verify whether the dataset of voice features
can be grouped based on the set of parameters
previously referred. Kohonen's Self-Organizing
Maps (SOM) and Hierarchical Clustering are the
methods used in this work.
The section 2 of this document presents the
materials used in the study, presenting the database,
acoustic parameters and the clustering methods: SOM
and hierarchical clustering. Sequentially, section 3
presents the results and discussions. Closing with the
conclusions, presented in section 4.
2 MATERIALS AND METHODS
In this section the dataset will be presented, followed
by the definition of the used parameters and the
clustering methods, namely the Kohonen’s Self
Organizing Maps and Hierarchical Clustering.
2.1 Database
The Saarbruecken Voice Database (SVD) was used
as the original speech dataset. It has a collection of
speech recordings of over 2000 subjects pronouncing
the sustained vowels /a/, /i/ and /u/ in low, normal,
high, and low to high tone, plus a small sentence in
German. The SVD is an open dataset of pathologic
and healthy speech records provided by the Institute
of Phonetics of the University of Saarland. All audios
have a sampling frequency of 50 kHz and 16-bit
resolution (Martínez, Lleida, Ortega, Miguel and
Villalba, 2012), (Fernandes J. et al, 2019).
In this study, only the sustained vowel /a/ in
normal tone was used because it presents a larger
opening of the vocal tract compared to the other
vowels. Besides, samples of the Control group, the
Hyper-functional Dysphonia and Vocal Fold
Paralysis pathologies were used. These two
pathologies contains the largest number of subjects in
the database. Table 1 displays the characterization of
the used subset with 486 subjects.
2.2 Acoustic Parameters
The Praat software (Boersma P, Weenink D, n.a.)
allowed the extraction of parameters used in acoustic
analysis. By selecting the file from the SVD, it is
possible to select the complete voice segment and
extract the parameters: absolute jitter and shimmer,
relative jitter and shimmer, HNR, NHR and
autocorrelation (Teixeira, J. P., Fernandes, P. O.
2015).
Jitter is a periodic disturbance; shimmer is the
magnitude disturbance. Both can be measured using
four different formulas (Teixeira J. P. and Gonçalves,
2016), but in this work only the absolute and relative
versions of each parameter will be worked on.
Absolute jitter is the average absolute difference
among successive periods whereas relative jitter is the
absolute jitter divided by the average period,
expressed in percentage (Teixeira J. P., Fernandes J.,
Teixeira F., Fernandes P. O., 2018).
Absolute shimmer, according to Teixeira J. P. et
al (2018) is the logarithm of base 10 of the absolute
mean of the magnitude ratio between consecutive
periods multiplied by 20, given in decibel, whilst
relative shimmer is the average absolute difference
between amplitudes of successive periods, divided by
the mean magnitude, expressed in percentage.
Clustering Pathologic Voice with Kohonen SOM and Hierarchical Clustering
159
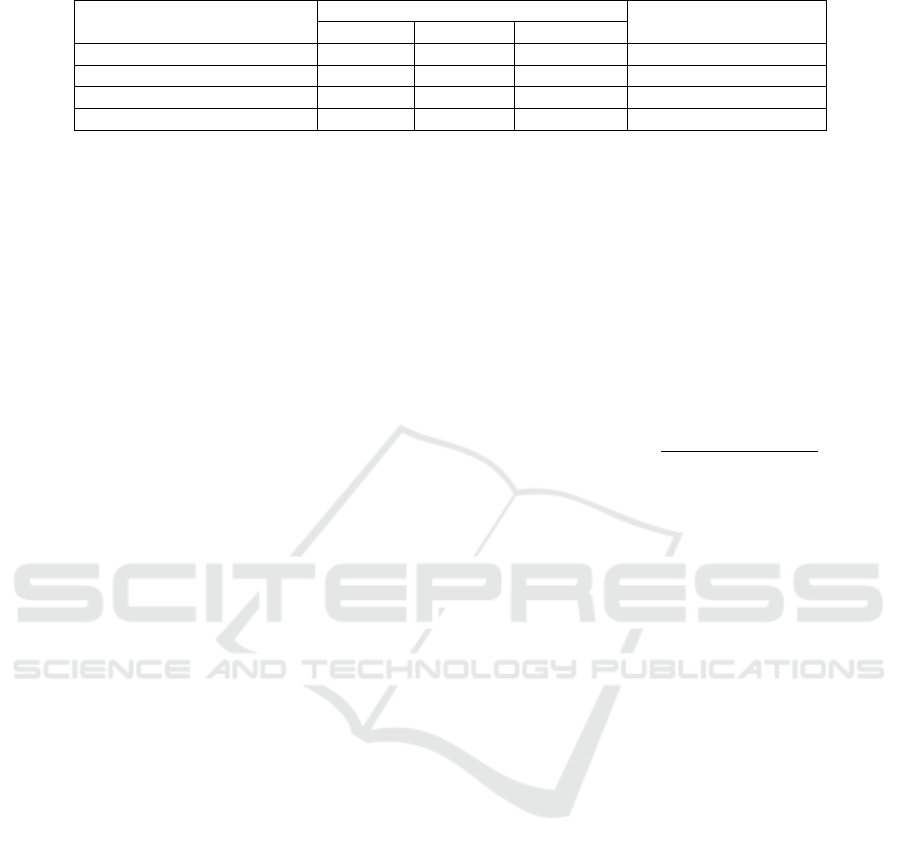
Table 1: Subset of subject of the Saarbruecken Voice Database used.
Test Groups
Number of Voice Sam
p
les
Average Participants’
Age
Female Male Total
Control 123 71 194 36,74
Hype
r
-Functional Dysphonia 95 32 127 40,91
Vocal Fold Paralysis 100 65 165 57,52
Total 318 138 486 45,06
Autocorrelation is the correlation of a signal with
itself, being a method of detecting the periodicity of
the signal. According to Fernandes J. et al. (2019),
this parameter provides a measure of the similar
speech parts repeated along the signal.
The harmonic-to-noise ratio (HNR) gives the
relation between the periodic and aperiodic
components of a speech segment, whereas the noise-
to-harmonic ratio (NHR) is given by the relation
between the aperiodic component and the periodic
component (Fernandes J., Teixeira F., Guedes,
Junior, and Teixeira J. P., 2018).
2.3 Kohonen’s Self Organizing Maps
Kohonen's Self-Organizing Maps (SOM) are
structured through unsupervised competitive training,
which allows the detection of similarities between the
input data, grouping them (Haykin, 1999), (Kohonen,
1994). SOM are useful comparing to other neural
networks because they are able to represent a
multidimensional data set in a two-dimensional space
(Haykin, 1999), (Kohonen, 1994), (Affonso, 2011).
The competitive learning process used by SOM
works with the principle of competition between
neurons, in which the winner has its weights modified
to suit the next input vector. The definition of the
winning neuron is given by the proximity between the
input vector and the weight vector of the neuron
(Haykin, 1999), (Affonso, 2011). This proximity is
conceived by the Euclidian distance, expressed by
equation (1). Where 𝑥 is the input vector and 𝑤
is the
weights vector.
𝑖
(
𝑥
)
=arg𝑚𝑖𝑛𝑥−𝑤
𝑗 = 1,2,…𝑛
(1)
When defined a winner, having already arranged
the neurons in the topological map, one must define a
neighborhood criterion between the neurons so that
when a neuron wins, there is an adjustment of both
the winner and the neighborhood (Kohonen, 1994),
(Affonso, 2011). The Gaussian function is applied in
the neighborhood, so that the more distant neighbors
have a smaller adjusted value compared to the winner
(Kohonen, 1994). Thus, equation (2) is applied to the
winner and equation (3) is used in the neighborhood.
The Gaussian operator is 𝛼
()
, given by the
expression (4). The 𝜎 symbol in equation (4) is the
standard deviation of the dataset.
𝒘
(
)
=𝒘
(
)
+
𝜂×
𝒙
+𝒘
()
(2)
𝒘
(
)
=𝒘
(
)
+
𝜂×𝛼
()
𝒙
+𝒘
()
(3)
𝛼
()
=𝑒
𝒘
(
)
𝒘
(
)
(4)
2.4 Hierarchical Clustering
The Hierarchical Clustering method is divided into:
agglomerative, in which each object is a cluster and
each iteration the union with other similar objects
occurs until forming a single group; and divisive,
which starts in a single large group containing all
samples and recursively divides into smaller sets
(Pavel, 2006).
This clustering method works with the
(dis)similarity of the database elements, which is
done through a linkage metric (Pavel, 2006). To find
the (dis)similarity between each pair of objects in the
database, the distance between these observations is
calculated, given by the Euclidean distance, already
expressed in Equation (1) (Gan, Ma, and Wu, 2007).
After this calculation, it is possible to determine how
the objects in the dataset should be grouped into
clusters using the linkage metric (Gan Ma, and Wu,
2007), (Jain, Murty and Flynn, 1999). This metric
characterizes the proximity of a pair of clusters,
which defines whether the observations should merge
or split, creating the hierarchy tree. This linkage can
be complete, single, average, centroid, median, ward
or weighted. The first uses the longest distance
between objects in the two clusters, the average uses
the mean distance between pairs of observations in
two distinct groups, the centroid linkage, uses the
Euclidean distance between the centers of two
clusters, the median uses the Euclidean distance
between the weighted centroids of the two groups.
BIOSIGNALS 2021 - 14th International Conference on Bio-inspired Systems and Signal Processing
160

Ward's linkage makes the incremental sum within the
cluster as a result of joining two clusters and, finally,
the weighted measure uses a recursive definition for
the distance between two clusters (MathWorks, n.d.).
2.5 Pre-processing Data
The Neural Network toolbox of MATLAB® software
was used to implement the artificial neural network
algorithms. The raw data was pre-processed for
cluster analysis. A normalization ranging from 0 to 1
was applied for the parameters, in which the
maximum and minimum values of each parameter are
identified. For each parameter, the normalization
consists in the difference of each sample and its
minimum divided by the difference of the maximum
and minimum values. Equation (5) shows the
normalization, wherein
X
is the parameter to be
normalized and i the sample for each subject.
𝑋
=
𝑋
−𝑋
𝑋
−𝑋
𝑖 = 1,2,…,486
(5)
After normalization, the neural network
conditions must be adjusted. In this work, the
characteristics of SOM were selected empirically
based on data available in the literature, reaching a
dimension of 100 neurons, with an initial
neighborhood radius ranging from 1 to 10, in a
hexagonal topology that is iterated 18000 times.
3 RESULTS AND DISCUSSION
Due to the sophisticated visualization of neurons in
SOM, it is possible to notice that there is a division
into two clusters. In Figure (1-a), the lower left corner
points out the yellow to light orange color, which
designates a proximity of the neurons forming a
cluster. The dark orange tending to the red in upper
right corner shows that the neurons are not so close to
the ones of the lower left, forming a second group.
For a more assertive result of the clusters, the
Hierarchical Clustering was also used. Like SOM,
this network uses the Euclidean equation in order to
determine the distance between each object in the
database. In sequence, the linkage metric is used to
create the clusters. To check if the linkage metric was
chosen correctly, just compare the cophenetic
distance. For a consistent result, this correlation must
present a value close to 1, proving that the solution of
this cluster represents the original data (MathWorks,
n.d.). In terms of proximity between clusters, the
average linkage is used, as it presents a better
similarity in relation to other connection metrics,
presenting a cophenetic correlation of 0.9297. Figure
(1-b) shows the dendrogram producing two final
clusters, which corroborates with the result presented
by the Kohonen network. When the subjects of each
group in the Hierarchical Clustering were analyzed, it
was found that the groups were divided into a large
group and a smaller one. All elements of the Control
group belong to the largest set. Hyper-functional
Dysphonia data also belong to this large set, with the
exception of 2 elements. The other data of the small
group are from the Vocal Fold Paralysis.
According to comparison of pathologies based on
same parameters presented in Oliveira, Dajer,
Fernandes, and Teixeira (2020) for the 3 groups under
study, using descriptive statistical analysis, it was
found that the Hyper-functional Dysphonia can be
grouped with Control group and with Vocal Fold
Paralysis group, but Vocal Fold Paralysis cannot be
grouped with Control group. Since Hyper-functional
Dysphonia, according to the descriptive statistical
analysis, can be grouped with the two other groups,
these subjects may become between the two (yellow
and red) ‘corners’ of the SOM. This can be explained
by the fact that the Hyper-functional Dysphonia in its
primary phase does not present irregular traces in the
laryngeal exam and the vocal symptoms are
inconstant, having fatigue and episodes of vocal
weakness as the main signs (Fawcus, 1991).
The (no) connection between the Vocal Fold
Paralysis and the other two groups, may be probably,
the reason for the distinction between their elements.
The reason is because the Vocal Fold Paralysis and
Hyper-functional Dysphonia pathologies are
distinguished both in etiology and physiology. The
Vocal Fold Paralysis is an injury to the recurrent
laryngeal nerve, incapacitating the muscular
contraction of the vocal folds (Chen, Jen, Wang, Lee,
and Lin, 2007), (Toutounchi, Eydi, Golzari, Ghaffari,
and Parvizian, 2014). Whereas the Hyper-functional
Dysphonia causes increased tension in the laryngeal
muscle, resulting in excessive stiffness of the vocal
cords, bringing them closer together (Holmberg,
Doyle, Perkell, Hammarberg, and Hillman, 2003),
(Kandoğan, Koç, and Aksoy, 2009). In the
comparison between the Control group and the
Paralysis group there might be a difference, as the
pathology inhibits the muscular contraction of the
vocal folds. Therefore, the voice is altered, even in a
minimal way.
Clustering Pathologic Voice with Kohonen SOM and Hierarchical Clustering
161
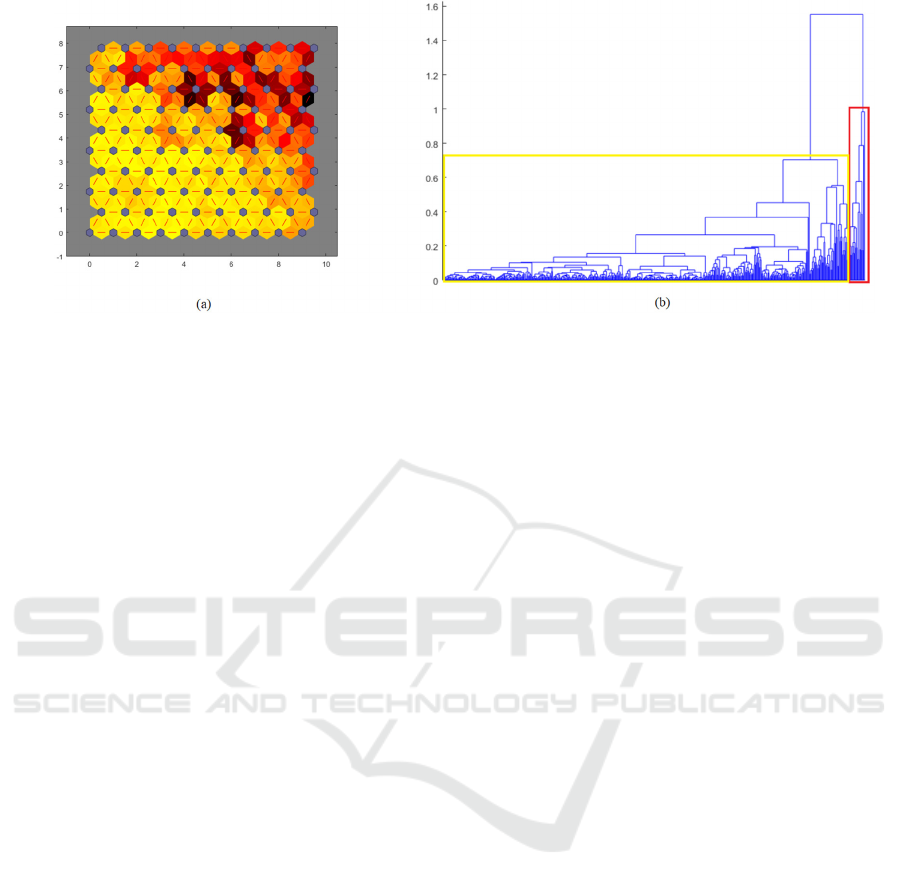
Figure 1: (a) Distance between the neighborhood of neurons in the Kohonen's Self-Organizing Maps; (b) Agglomerative
hierarchy tree resulting from the input vector.
4 CONCLUSIONS
The paper presents clustering analysis using
unsupervised ANNs, namely Kohonen's Self-
Organizing Maps, and Hierarchical Clustering to
gathering subjects of the Control group, Hyper-
functional Dysphonia, and Vocal Fold Paralysis,
using a set of speech parameters like jitter, shimmer,
HNR, NHR and autocorrelation.
The clustering techniques analyzed here in order
to group pathologies based on the acoustic parameters
were successful, evidencing the results presented in
previous research (Oliveira, Dajer, Fernandes, and
Teixeira, 2020), in which there was no statistical
distinction between Hyper-functional Dysphonia and
the Control group, but there is a significant statistical
difference between Vocal Fold Paralysis and Control
group. Hence, the SOM presented the expected
results considering that divided the dataset into two
‘corners’ with gradual scale between light yellow and
dark red, likewise the descriptive statistical analysis
method. This organization of subjects between the
two ‘corners’ can be interpreted as the Control
(Healthy) subjects in the light yellow, the Vocal Fold
Paralysis in the dark red and Hyper-functional
Dysphonia subjects between these two ‘corners’.
Even though it presented a good result, this work
is still in progress. Therefore, this comparison will be
extended to subjects with other pathologies in near
future, adding more audios for each subject in order
to obtain consistent results.
For future work, it is suggested to implement
SOM and Hierarchical Clustering to the remaining
pathologies and use other parameters extracted from
the voice signal, such as the mel-frequency cepstral
coefficient (MFCC), perceptual linear prediction
(PLP), linear prediction cepstral coefficient (LPCC),
among others.
ACKNOWLEDGEMENTS
This work has been supported by FCT – Fundação
para a Ciência e Tecnologia within the Project Scope:
UIDB/05757/2020.
REFERENCES
Affonso, G.S. 2011. Mapas Auto-Organizáveis de Kohonen
(SOM) Aplicados na Avaliação de Parâmetros da
Qualidade da Água. Dissertação de mestrado em
Ciências na Área de Técnologia Nuclear. Autarquia
associada à universidade de São Paulo.
Boersma P, Weenink D.: Praat: doing phonetics by
computer. Phonetic Sciences, University of
Amsterdam. http://www.fon.hum.uva.nl/praat/
Chen, H., Jen, Y., Wang, C., Lee, J., Lin, Y., 2007. Etiology
of Vocal Cord Paralysis. I n ORL, (3), pp.167-171.
Fawcus, M., 1991. Voice Disorders and Their
Management. 2 ed. Londres: Springer-
Science+Business Media, B.V., pp.1-392.
Felippe, A.C.N., Grillo, M.H.M.M., Grechi, T.H. 2006.
Normatização de medidas acústicas para vozes
normais. In Brazilian Journal of Otorhinolaryngology,
72 (5): 659-664.
Fernandes, J., Silva, L., Teixeira, F., Guedes, V., Santos, J.,
Teixeira, J. P. 2019. Parameters for Vocal Acoustic
Analysis - Cured Database. In Procedia Computer
Science, 164 (2019): 654-661.
Fernandes, J., Teixeira, F., Guedes, V. Junior, A. &
Teixeira, J. P., 2018. “Harmonic to Noise Ratio
Measurement - Selection of Window and Length”,
BIOSIGNALS 2021 - 14th International Conference on Bio-inspired Systems and Signal Processing
162

Procedia Computer Science - Elsevier. Volume 138,
Pages 280-285.
Finger, L.S., Cielo, C.A., Schwarz, K. 2009. Medidas
vocais acústicas de mulheres sem queixas de voz e com
laringe normal. In Brazilian Journal of
Otorhinolaryngology, 75 (3): 432-440.
Gan, G., Ma, C. & Wu, J., 2007. Data Clustering. 1 ed.
Philadelphia, Pa.: SIAM, Society for Industrial and
Applied Mathematics, pp.1-487.
Guedes, V., Junior, A., Teixeira, F., Fernandes, J., Teixeira,
J. P. 2018. Long Short-Term Memory on Chronic
Laryngitis Classification. In Procedia Computer
Science - Elsevier. 138 (2018): 250-257.
Haykin Simon. 1999. Neural Networks: A comprehensive
foundation. New Jersey, Prentice Hall.
Holmberg, E., Doyle, P., Perkell, J., Hammarberg, B.,
Hillman, R., 2003. Aerodynamic and acoustic voice
measurements of patients with vocal nodules: variation
in baseline and changes across voice therapy. In
Journal of Voice, 17(3), pp.269-282.
Jain, A.K., Murty, M.N., and Flynn P.J. 1999. Data
Clustering: A Review. In ACM Computing Surveys, 31
(3): 264-323.
Kandoğan, T., Koç, M., Aksoy, G., 2009. Effectiveness of
voice therapy in Hyper-functional dysphonia in adult
patients. In The Turkish Journal of Ear Nose and
Throat, 19(4), pp.198-202.
Kohonen, T. 1994. Self-Organizing-Maps. Filand: Sringer
Series. 3 ed, 1-520.
Martínez, D., Lleida, E., Ortega, A., Miguel, A., Villalba, J.
2012. Voice Pathology Detection on the Saarbruecken
Voice Database with Calibration and Fusion of Scores
Using MultiFocal Toolkit. In Comm. in Comp. and
Information Science, 328 (1): 99-109.
MathWorks. Hierarchical Clustering. Available on:
<https://www.mathworks.com/help/stats/hierarchical-
clustering.html>. Access in: 21 apr. 2020.
Oliveira, A., Dajer, M., Fernandes, P., Teixeira, J. P., 2020.
Clustering of Voice Pathologies based on Sustained
Voice Parameters. In Proceedings of the 13th
International Joint Conference on Biomedical
Engineering Systems and Technologies - Volume 4
BIOSIGNALS, pages 280-287. DOI:
10.5220/0009146202800287
Panek D., Skalski A., Gajda J. and Tadeusiewicz R., 2015.
Acoustic Analysis Assessment in Speech Pathology
Detection. Int. J. Appl. Math. Comput. Sci., Vol. 25,
No. 3, 631-643. DOI: 10.1515/amcs-2015-0046.
Pavel, B. 2006. A Survey of Clustering Data Mining
Techniques. In Kogan J., Nicholas C., Teboulle M.
(eds) Grouping Multidimensional Data. Springer,
Berlin, Heidelberg.
Teixeira, F., Fernandes, J., Guedes, V. Junior, A., Teixeira,
J. P. 2018. Classification of Control/Pathologic
Subjects with Support Vector Machines, In Procedia
Computer Science – Elsevier, 138 (2018): 272-279.
Teixeira, F., Teixeira, J. P. 2020. Deep-learning in
Identification of Vocal Pathologies. In Proceedings of
the 13th International Joint Conference on Biomedical
Engineering Systems and Technologies
- Volume 4
BIOSIGNALS, ISBN 978-989-758-398-8, ISSN 2184-
4305, pages 288-295. DOI:
10.5220/0009148802880295.
Teixeira, J. P., Fernandes, P. O. 2015 “Acoustic Analysis
of Vocal Dysphonia”. Procedia Computer Science -
Elsevier 64, pages 466 – 473.
Teixeira, J. P., Alves, N., Fernandes, P. O. 2020. Vocal
Acoustic Analysis: ANN Versos SVM in Classification
of Dysphonic Voices and Vocal Cords Paralysis. In
International Journal of E-Health and Medical
Communications (IJEHMC), 11 (1): 37-51.
Teixeira, J. P., Fernandes, J., Teixeira, F., Fernandes, P.
2018. Acoustic Analysis of Chronic Laryngitis -
Statistical Analysis of Sustained Speech Parameters. In
11th International Joint Conference on Biomedical
Engineering Systems and Technologies, 4 (2018): 168-
175. ISBN 978-989-758-279-0
Teixeira, J. P., Fernandes, P. O., 2014. “Jitter, Shimmer and
HNR classification within gender, tones and vowels in
healthy voices”. Procedia Technology - Elsevier,
Volume 16, Pages 1228-1237.
Teixeira, J. P., Fernandes, P. O., Alves, N. 2017. Vocal
Acoustic Analysis - Classification of Dysphonic Voices
with Artificial Neural Networks. In Procedia Computer
Science 121 (2017): 19–26.
Teixeira, J. P., Gonçalves, A., 2016. “Algorithm for jitter
and shimmer measurement in pathologic voices”,
Procedia Computer Science - Elsevier 100, 271 – 279.
Toutounchi, S., Eydi, M., Golzari, S., Ghaffari, M.,
Parvizian, N., 2014. Vocal Cord Paralysis and its
Etiologies: A Prospective Study. In Journal of
Cardiovascular and Thoracic Research, 6(1), pp.47-50.
Tsnas, A., Little, M., McSharry, P. & Ramig, L., 2010.
Nonlinear speech analysis algorithms mapped to a
standard metric achieve clinically useful quantification
of average Parkinson's disease symptom severity.
Journal of the Royal Society Interface, 17 Nov., pp.
842-855.
Clustering Pathologic Voice with Kohonen SOM and Hierarchical Clustering
163
