Using Segmentation Networks on Diabetic Retinopathy Lesions:
Metrics, Results and Challenges
Pedro Furtado
a
DEI/CISUC, Universidade de Coimbra, Polo II, Coimbra, Portugal
Keywords: Deep Learning, Segmentation, Medical Images.
Abstract: Deep segmentation networks are increasingly used in medical imaging, including detection of Diabetic
Retinopathy lesions from eye fundus images (EFI). In spite of very high scores in most EFI analysis tasks,
segmentation measured as precise delineation of instances of lesions still involves some challenges and
deserves analysis of metrics and comparison with prior deep learning approaches. We build and confront
state-of-the-art deep learning segmentation networks with prior results, showing up to 15 percentage points
improvement in sensitivity, depending on the lesion. But we also show the importance of metrics and that
many frequently used metrics can be deceiving in this context. We use visual and numeric evidence to show
why there is still ample space for further improvements of semantic segmentation quality in the context of
EFI lesions.
1 INTRODUCTION
Diabetic Retinopathy (DR) is an eye condition related
to microvascular changes in the retina that affects
people with Diabetes. The changes involve leakage of
extra fluid and small amounts of blood in the eye
(microaneurysms and hemorrhages) and deposits of
cholesterol and other fats (exudates) (Wilkinson,
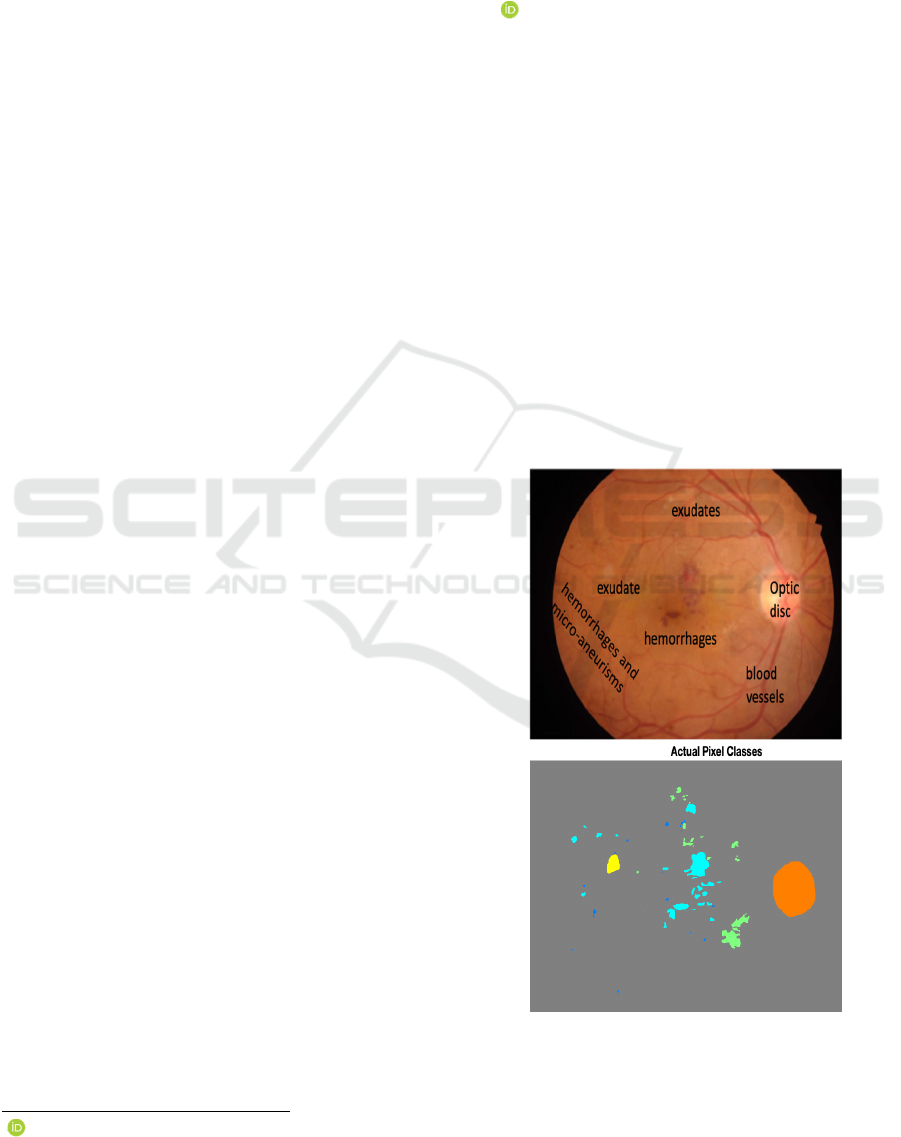
2003). Figure 1 shows some lesions and some
structures on eye fundus image (EFI), where the
coloured image indicates the lesions and the optic
disk.
The deep segmentation network is a software
system inspired in convolution neural networks that
uses supervised learning from training images and
groundtruths to learn how to segment images in a
certain context. These networks are increasingly used
in every medical imaging problem with great results
when compared to previous alternatives. Figure 2
shows one such network receiving an image as input
and outputting a segmentation map that is supposed
to classify each pixel as one of a number of classes.
a
https://orcid.org/0000-0001-6054-637X
Figure 1: EFI and lesions characteristic of Diabetic
Retinopathy.
128
Furtado, P.
Using Segmentation Networks on Diabetic Retinopathy Lesions: Metrics, Results and Challenges.
DOI: 10.5220/0010208501280135
In Proceedings of the 14th International Joint Conference on Biomedical Engineering Systems and Technologies (BIOSTEC 2021) - Volume 2: BIOIMAGING, pages 128-135
ISBN: 978-989-758-490-9
Copyright
c
2021 by SCITEPRESS – Science and Technology Publications, Lda. All rights reserved
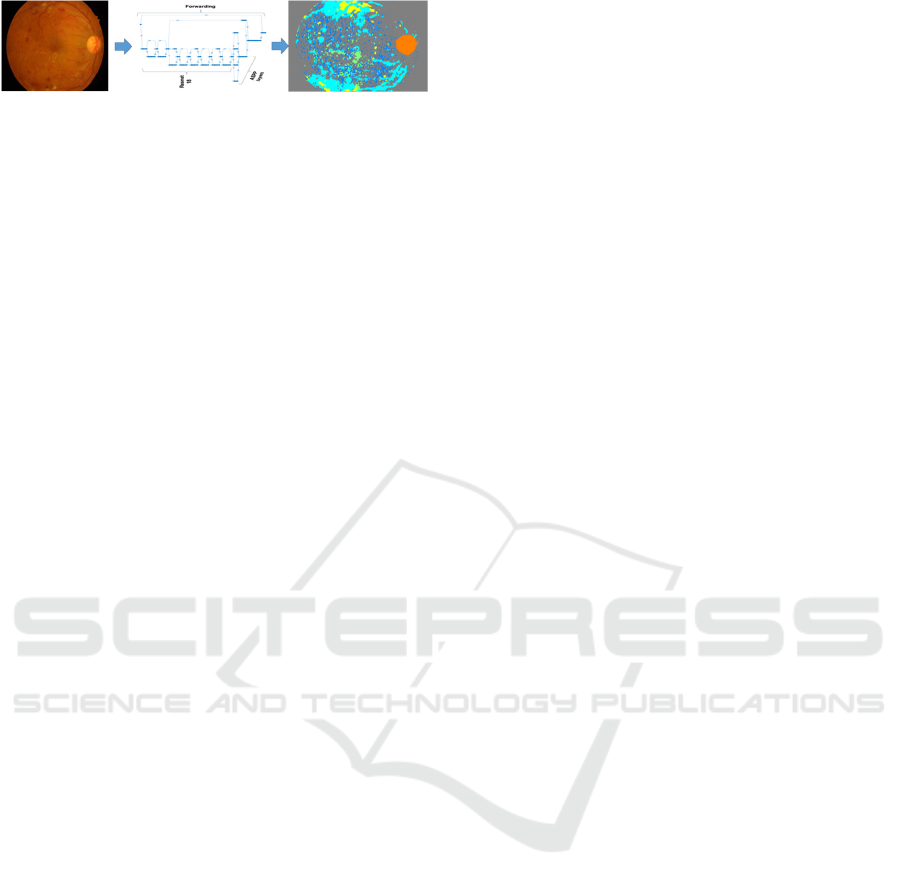
Figure 2: Illustration of the deep segmentation procedure.
The deep segmentation network shown in Figure
2 is made of an encoding and a decoding part. The
encoding part is a Convolution Neural Network
(CNN), and its function is to extract features from
images in the form of a compressed representation of
the main features, hence the label “encoding”. But
while CNNs classify images, segmentation networks
classify each individual pixel as belonging to one of
a set of classes, a.k.a. semantic segmentation.
Semantic Segmentation, also called scene
labeling, refers to assigning a semantic label (e.g. car,
people, and road) to each pixel of an image (Yu,
2018). In semantic segmentation each pixel must be
assigned the exact class to which it belongs in reality,
and groundtruths should be pixelmaps as much as
possible, as opposed to coarse regions defined around
groups of lesions. In analysis of EFI images, semantic
segmentation aims at finding areas and numbers of
lesions instances as accurately as possible, as opposed
to just detecting if images have lesions of certain
types or some regions engulfing sets of lesions.
Recent reviews of EFI analysis, such as in
(Qureshi, 2019), (Asiri, 2019), (Raman, 2019) report
highest scores (e.g. between 90% and 100%) in most
tasks related to analysis of EFI and DR classification.
A smaller fraction of the works reviewed there
mention lesion segmentation and, as we review in
related work section, an even smaller fraction actually
evaluate the whole process of segmentation of
lesions. For those we have to look into the details to
retrieve the actual reported scores. The sensitivities
found in those works for one False Positive per Image
are in the intervals, for different lesions: hemorrhages
HA=47-50%; hard exudates HE=40-57%; soft
exudates SE=64-70% and micro-aneurisms MA=7-
38%. These values contrast with scores between 90%
and 100% for other tasks such as detecting if an image
has any lesion of a certain type.
These reported prior works use various CNN-
based approaches to EFI analysis. Our purpose in this
work is twofold: on one hand we build and compare
a state-of-the-art semantic segmentation network
(DeepLabV3, FCN, UNET) with those prior works,
showing that it improves the results, but on the other
hand we also discuss metrics and the need to be
careful in the use of metrics when evaluating this kind
of systems. Analyzing the quality of segmentation in
terms of sensitivity versus false positives we find that
our proposed network is quite competitive and
overcomes prior work. But at the same time we also
reveal the limitations with some frequently applied
segmentation metrics in the context of evaluation of
segmentation of EFI lesions in general. We discuss
limitations of popular metrics that include
ROC/AUC, specificity and even sensitivity alone
(sensitivity versus false positives, which we use to
compare with prior works, does not have the problem)
in our context. We show that, from a perspective of
evaluation of semantic segmentation, where the class
of each individual pixel matters, work is still required
to improve the approaches further.
The paper is organized as follows: section 2
contains related work. Section 3 describes the
segmentation network we build and propose in this
work for the comparisons, and the limitations of some
metrics in the context of EFI lesions segmentation is
also discussed there. Section 4 contains experimental
work and section 5 concludes the paper.
2 RELATED WORK
Recent surveys on analysis of Eye Fundus Images
(EFI) for diagnosis of Diabetic Retinopathy (DR) and
for detection and localization of lesions (Qureshi,
2019), (Asiri, 2019), (Raman, 2019) report scores
between 90% and 100% for most tasks, including
some mentioning “segmentation” and “localization”.
The fraction of works reviewed that “segment”
lesions include Prentasic et al. (Prentašić,2015),
Gondal at al. (Goindal, 2017), Quellec et al. (Quellec,
2017) (exudates, hemorrhages and microaneurisms),
Haloi et al. (Haloi, 2015), Van Grinsven et al. (Van
Grinsven, 2016), Orlando et al. (Orlando, 2018) and
Shan et al. (Shan, 2016) (microaneurisms,
hemorrhages or both). From those, a considerable
number are classifiers of small windows. That is the
case of Prentasic et al. (Prentašić,2015), Haloi et. al.
(Haloi, 2015), Van Grinsven (Van Grinsven, 2016),
and Shan et al. (Shan, 2016), which are classification
CNNs that classify small square windows around
potential lesions. These works achieve high
classification scores, but they do not segment the
lesions, instead they classify small windows. For
instance, (Prentašić,2015) proposes applying a simple
CNN classifier to each pixel by obtaining a small
window around it, and achieves a classification score
of 77% sensitivity for exudates. Not only the
sensitivity is lower than 90 to 100% and target only
exudates, as also for training and evaluation the
authors collect windows statically, taking all the
exudate pixels as positive samples and the same
Using Segmentation Networks on Diabetic Retinopathy Lesions: Metrics, Results and Challenges
129

amount of pixels randomly sampled among all non-
exudate pixels but without repetition. The approach
does not deal with the difficulty of scaling to classify
all pixels in an EFI and realtime operation, a difficult
issue because the classifier has to be applied to each
pixel. More generically, it is not clear how to scale
approaches classifying small windows around pixels
to realtime semantic segmentation of lesions.
Other related works do segment lesions, e.g.
Gondal at al. (Gondal, 2017), Quellec et al. (Quellec,
2017) are two variations of DR classifiers
(classification of EFI images as DR or not), that at the
same time up-sample and extract heatmaps to get the
positions of lesions. Orlando (Orlando, 2018) uses a
different approach that combines DL with image
processing to find candidate regions. These works do
include evaluation of the quality of segmentation of
lesions, using a criterion of overlap of segments. They
reported the following sensitivities for segmentation
of lesions (for 1 false positive per image=FPI):
Quellec (Quellec, 2017) (HA=47%; HE=57%;
SE=70% and MA=38%), Gondal (Gondal, 2017)
(HA=50%; HE=40%; SE=64% and MA=7%) and
Orlando (Orlando, 2018) (HA:50%, MA: 30%).
These scores illustrate the fact that segmenting the
lesions does not result in scores near to 100%. Also
important, it must be noted that a “relaxed” connected
components evaluation criteria is used in those works
(described for instance in (Zhang, 2014)), where a
threshold of partial overlap between found segments
and groundtruth regions is sufficient for considering
a match. The connected components criteria,
described for instance in Zhang’s work (Zhang,
2014), considers a match if an overlap of 20% (or
another threshold) between found segments and
groundtruth regions exists. The groundtruths of the
datasets themselves are frequently large coarse
regions defined around groups of lesions (e.g.
datasets Diaret (Kälviäinen, 2007)] or e-ophtha
(Erginay, 2008)). We believed that a state-of-the-art
deep learning segmentation network (DeepLabV3)
can do better than many prior approaches, such as
(Gindal, 2017), (Quellec, 2017), (Orlando, 2018). For
that reason, we created the setup and compared the
approaches.
Some frequently used metrics are also an
important detail in this context (Tiu, 2019), (Csurka,
2013) and in particular class imbalance can bias the
evaluation scores. Zhang (Zhang, 2014) mentions
that, “given that the classes are clearly unbalanced,
TP, FN and FP are in practice negligible with respect
to TN, therefore computing the specificity, i.e.
TN/(FP+TN), and therefore ROC (Receiver operating
characteristic) curve does not seem appropriate”. For
that reason we pay a special attention to how metrics
should be used in our study. In that respect we both
discuss metrics and in the experimental work we
include a section revealing the false positives-related
limitations of current approaches that are exposed by
use of some metrics and/or visual inspection.
There exist some very popular segmentation
networks. The Fully Convolutional Network (FCN)
(Long, 2015) uses a CNN to encode (typicaly a
VGG16 (Simonyan, 2014)), replacing the final fully
connected layers by convolutional layers with large
receptive fields, and adds up-sampling layers based
on simple interpolation filters. The FCN we use in
this paper has around 50 layers. We would also
mention the use of forwarding paths. Ronneberger
(Ronneberger, 2015) proposed the U-Net, a DCNN
especially designed for segmentation of biomedical
images (around 75 layers). The architecture consists
of “a contracting path to capture context” and a
“symmetric expanding path that enables precise
localization”. The network beat other competitors in
the ISBI challenge for segmentation of neuronal
structures in electron microscopic stacks. Finally, the
DeepLabV3 network (Chen, 2017) that we
experiment with uses Resnet-18 encoder and applies
some new techniques to improve the quality,
including Atrous Spatial Pyramid Pooling (ASPP)
(Lin, 2017), capturing objects at multiple scales, and
Conditional Random Fields (CRF) for improved
localization of object boundaries using probabilistic
graphical models. We obtained some of the best
results using this network (Porwal, 2019).
3 SEGMENTATION NETWORKS
AND METRICS
3.1 Segmentation Networks
As already mentioned before, segmentation networks
have two well distinguished parts, the encoder, most
frequently an existing CNN encoding architecture,
and a decoder that reinstates the full image size, and
the pixel classifier layer that assigns a score for each
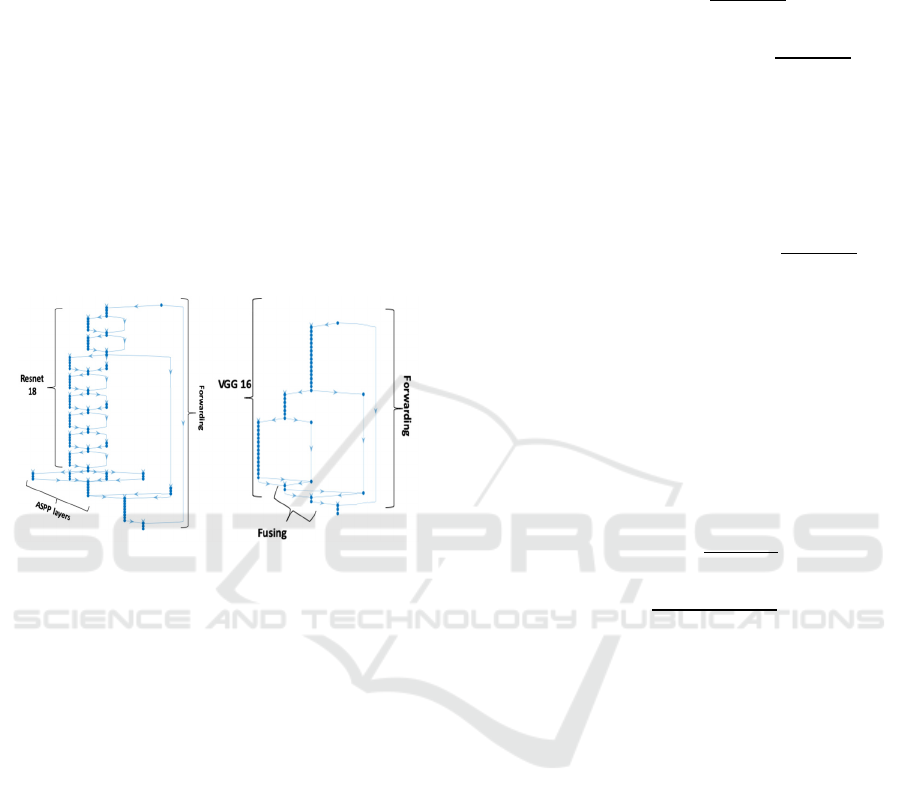
class to each pixel. DeepLabV3, with a rough sketch
shown in Figure 3, is a very successful segmentation
network. Our design for DeepLabv3 shown in Figure
3 includes well-known Resnet-18 CNN classification
network as encoder and benefits from the innovations
that include Atrous Spatial Pyramid Pooling (ASPP)
(Lin, 2017), which enables better segmentation at
multiple scales, and Conditional Random Fields
(CRF), which improve definition of contours in final
BIOIMAGING 2021 - 8th International Conference on Bioimaging
130
result. The network accepts as input the full EFI
image and outputs the classification for each
individual pixel as belonging to a specific lesion or
not. The fact that it classifies all individual pixels end-
to-end at the same time in one pass (typically taking
a few milliseconds to classify all pixels at once)
makes it the perfect tool for segmentation, as
compared with any CNN that would output an
accurate classification of a single pixel but would not
scale well. Since backpropagation learning is applied
end-to-end with segmentation masks as targets, the
network actually learns how to segment images based
on the groundtruths. DeepLabV3 is about 100 layers
deep. Figure 4 shows the architecture of FCN, another
well-known network architecture that uses VGG16
instead and has a total of about 50 layers.
Figure 3: DeepLabV3. Figure 4: FCN.
3.2 Limitations of Metrics
Most works on EFI analysis, and in particular in
segmentation of lesions in EFI images, frequently
report metrics such as sensitivity, ROC curves and
AUC. But in some circumstances, those metrics can
bias the analysis in the context that is being
considered. As we already reviewed in the related
work, Zhang (Zhang, 2014) mentions: “given that the
classes are clearly unbalanced, TP, FN and FP are in
practice negligible with respect to TN, therefore
computing the specificity, i.e. TN/(FP+TN), and
therefore ROC (Receiver operating characteristic)
curve does not seem appropriate”. The TN mentioned
by Zhang refers to the true negatives represented by
the background, which composes 90 to 95% of all
pixels in the EFI. The background is much easier to
segment than the rest of the objects because it is fairly
constant and huge, and the problem is that such huge
number may mask the real quality of segmentation of
lesions. Looking at the formulas of some popular
metrics we can see that specificity and false positive
rate (FPR) will both score very well “always” in the
EFI segmentation context due to that bias, and
therefore ROC curves and AUC using FPR are also
problematic:
𝑠𝑝𝑒𝑐𝑖𝑓𝑖𝑐𝑖𝑡𝑦
𝑇𝑁
𝑇𝑁 𝐹𝑃
𝑓𝑎𝑙𝑠𝑒 𝑝𝑜𝑠𝑖𝑡𝑖𝑣𝑒 𝑟𝑎𝑡𝑒
𝐹𝑃𝑅
𝐹𝑃
𝐹𝑃 𝑇𝑁
ROC: a function usually based on TPR vs FPR
There is also a potential limitation with the metric
sensitivity, also known as recall or TPR if it is used
alone:
𝑠𝑒𝑛𝑠𝑖𝑡𝑖𝑣𝑖𝑡𝑦 𝑟𝑒𝑐𝑎𝑙𝑙 𝑇𝑃𝑅
𝑇𝑃
𝑇𝑃 𝐹𝑁
In this case the limitation is that it does not consider
false positives (FP), meaning that a situation with a
huge number of FP could still have high sensitivity.
FPs are common because background pixels are
sometimes classified as a lesion since parts of the
background can resemble a lesion in colour or other
details. Evaluations using sensitivity versus false
positives (FP) solve this problem, as also does the use
of IoU (intersect-over-the-union) or the pair recall +
precision, because in those cases FPs are considered:
𝑝𝑟𝑒𝑐𝑖𝑠𝑖𝑜𝑛
𝑇𝑃
𝑇𝑃 𝐹𝑃
𝐼𝑜𝑈
𝑇𝑃
𝑇𝑃 𝐹𝑁 𝐹𝑃
The last part of our experimental work concerns
precisely the analysis of the FP problem, revealing
that there are still important limitations of the
approaches due to a significant amount of FP. Future
work should try to handle that problem.
4 EXPERIMENTAL RESULTS
For this investigative work we work with two
datasets. On one hand we use the publicly available
dataset IDRID dataset (Porwal, 2019), with 83 Eye
Fundus Images (EFI) and groundtruth pixelmaps,
where most images have a large number of instances
of each specific lesion. To increase the variety and
size of the training data we introduced data
augmentation in the training process, with random
translations of up to 10 pixels. For the comparison
with prior works to be based on the same dataset and
evaluation approach, we use DIARET-DB1 dataset
(Kauppi, 2007). DIARET-DB1 consists of 89 color
fundus photographs collected at the Kuopio
Using Segmentation Networks on Diabetic Retinopathy Lesions: Metrics, Results and Challenges
131
University Hospital, in Finland (Kauppi et al., 2007).
Images were captured with the same fundus camera,
a ZEISS FF450plus digital camera with a 50-degree
field-of-view. Images all have a definition of 1500 x
1152 pixels. Independent markings were obtained for
each image from four medical experts. The experts
were asked to manually delineate the areas containing
microaneurysms (or ‘small red dots’), hemorrhages,
hard exudates and cotton wool spots (a.k.a ‘soft
exudates’) and to report their confidence (< 50 %, ≥
50 %, 100 %) for each segmented lesion.
We initially obtain performance scores for
DeepLabV3, FCN and even U-Net to choose
DeepLabV3 as the main contender for comparison
with prior Works. Then we report the results of
DeepLabV3 compared to results with prior works
(Gondal, 2017), (Quellec, 2017), (Orlando,2018)
regarding quality of segmentation. After showing that
DeepLabV3 improves compared with those
approaches, we use visual and metric approaches on
the first dataset (IDRID) to show the limitations
related to FP and the need for more work improve the
approaches further.
For all networks the SGDM learning optimization
function was used, with learning rate 0.005 that
allowed the networks to converge to a classification
of all lesions. Training used 300 epochs, since all
networks would stabilize much before that, minibatch
sizes of 32, momentum of 0.9. In terms of hardware,
we used a machine running windows 10. The
hardware was an intel i5, 3.4 GHz, 16 GB of RAM
1TB SSD disk. A GPU was added to the PC,
consisting of an NVIDEA GForce GTX 1070 GPU
(the GTX 1070 has a Pascal architecture and 1920
cores, 8 GB GDDR5, with memory speed of 8 Gbps).
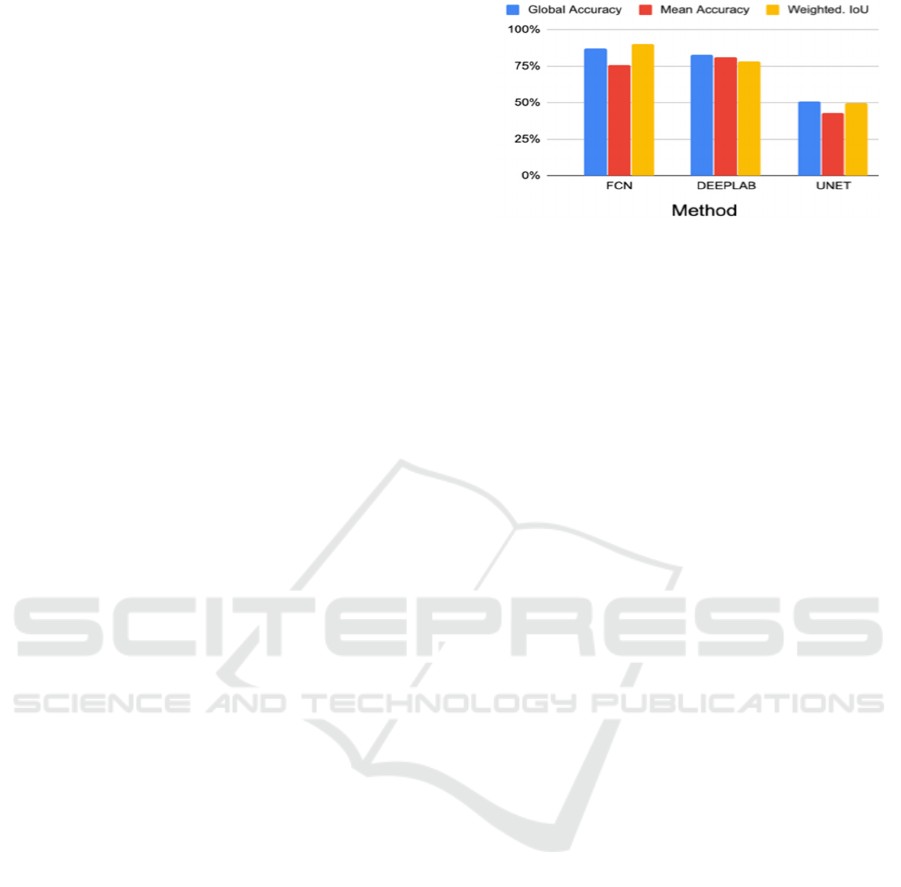
Our first experiment intended to pick the
segmentation network that would exhibit best results
using IDRID. Figure 5 compares three networks.
FCN had very good accuracy and IoU (90%, 88%),
DeepLabV3 was also quite good, always > 75%, and
both exhibited improvements over U-Net. We will
show later on (Table 3) that IoU scores per lesion are
much worse than these metrics shown in Figure 5,
which is related to the need for a careful interpretation
of metrics. Accuracy measures the fraction of pixels
that were classified well versus all pixels, and
weighted IoU measures the degree of correct overlap
of regions. These metrics usually score very high
when averaged over all pixels simply because the
background is huge and most of it is well segmented
because it is fairly constant (eye fundus).
Figure 5: Comparing FCN, DeepLabV3 and U-Net.
4.1 Comparing Lesion and
Image-Level Sensitivities to Prior
Works
Table 1 shows the results we obtained concerning the
comparison of lesion-level sensitivities between our
approach and those in (Gondal, 2017) and in
(Quellec, 2017). These results were obtained using
the connected components model of evaluation
(Zhang, 2014) with similar conditions as used in the
compared works. The sensitivities are measured
against the number of false positives per image (FPI),
and both should be considered in the analysis of
results. Note that we used the approach in (Quellec,
2017) where FPIs can differ because they are
obtained against the class classification threshold (0
to 1). Since only thresholds in the interval 0.1 and 0.9
with 0.1 steps are tested, only some values for FPI are
obtained, and from those, one is chosen that allows
easy comparison, as much as possible.
In general these results show that sensitivities
vary significantly between works and varied between
50 and 87% for HE, 47 and 94% for HE, 71 and 90%
for SE and 21 and 61% for RSD, also depending on
the number of FPI to consider.
They show that DeeplabV3 actually improves
scores for most lesions, i.e. for HA, HE and SE, while
for MA the results seem worse than (Orlando, 2018)
but inline with the results of the remaining prior work
compared.
Table 2 compares image-level detection of lesions
for referral, DeepLabV3 ranks first in HA and SE and
also ranks well in HE and MA. We can also see that
this is a quite easy problem for any technique, since
the objective is only to tell whether there is any lesion
of a certain type in the whole EFI image, without the
need to locate any precisely.
BIOIMAGING 2021 - 8th International Conference on Bioimaging
132
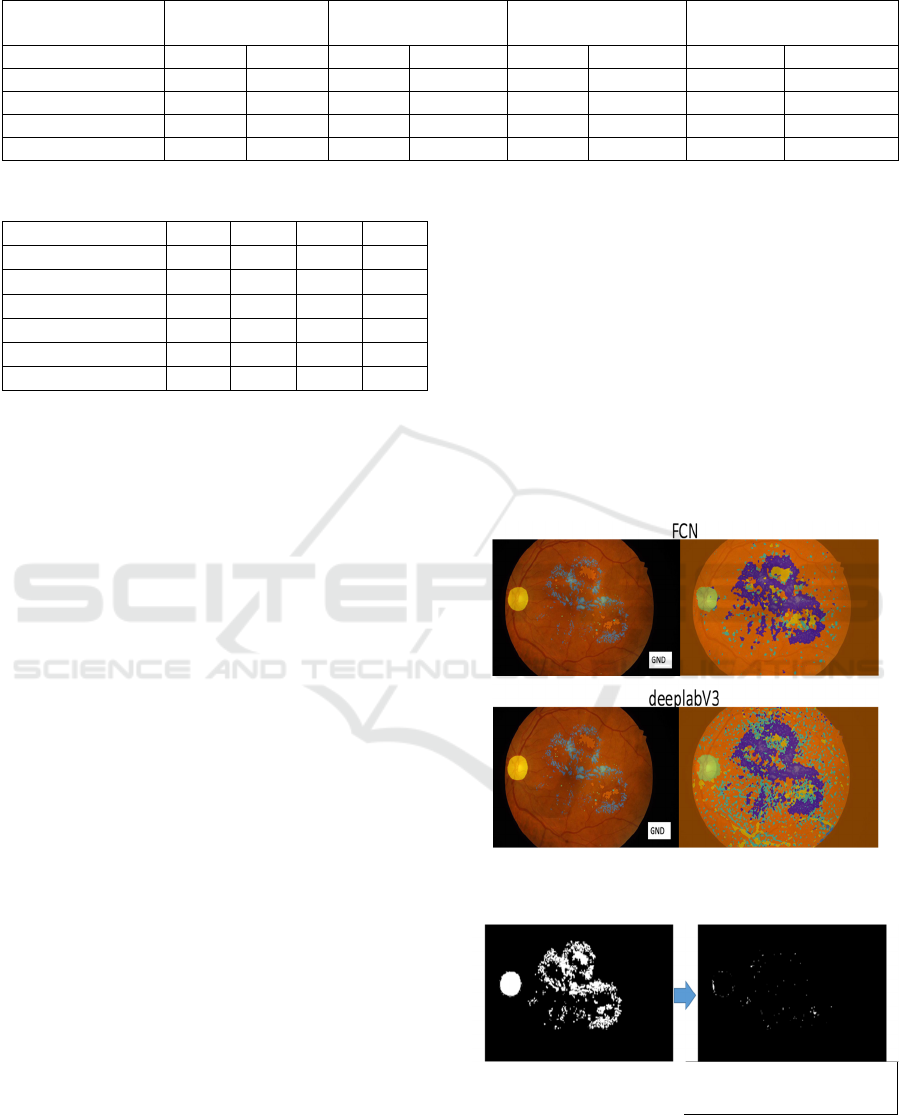
Table 1: Comparing lesion-level sensitivities.
Method Hemorrhages Hard Exudates Soft Exudates RSD
(micro-aneurisms)
SE% FPs/I SE% FPs/I SE% FPs/I SE% FPs/I
(Quellec, 2017) 71 10 80 10 90 10 61 10
Gondal, 2017) 72 2.25 47 1.9 71 1.45 21 2
(Orlando, 2018) 50 1 50 1
Ours 87 10 94 2.76 87.5 3.92 48 6.4
Table 2. Image-level sensitivities.
Method HA HE SE MA
(Zhou, 2016) 94.4 - - -
(Liu, 2017) - 83 83 -
(Haloi, 2015) - 96.5 - -
(Mane, 2015) - - - 96.4
(Gondal, 2017) 97.2 93.3 81.8 50
Ours 100 90 87.5 71
4.2 Limitations Revealed using
Semantic Segmentation Metrics
In spite of good comparative results when measured
using the connected components model (Zhang,
2014) that is used in most works on segmentation of
lesions in EFI, we also found that a large number of
false positives appears if we try to obtain higher
scores for lesions (sensitivities), especially apparent
if we evaluate in the perspective of semantic
segmentation. While in the connected component
model overlaps between segments are evaluated and
50%, 20% or any overlap at all are considered
matches, in “semantic segmentation” each pixel must
be assigned the exact class to which it belongs and
groundtruths should be pixelmaps with, as much as
possible, the exact class of each pixel. Since the
groundtruths of the IDRID dataset (Porwal, 2019) are
near to this concept where each pixel is assigned its
class, the next experiment evaluates based on this
principle. Figure 6 shows, on the left, the groundtruth
segments superimposed on the image, for FCN and
for DeepLabV3, and on the right the corresponding
segmentations. Many FP are apparent on the right,
more so in DeepLabV3.
Taking the segmentation masks of the same image
on FCN, Figure 7 shows, on the left image, the real
groundtruth mask for the lesions and optic disk, and
the right image shows lesions and optic disk pixels
that were not detected. We can see that only a very
small fraction of all lesions (which corresponds to
around 2.2%) were undetected, which is a very good
result. This corresponds to high sensitivity (SE).
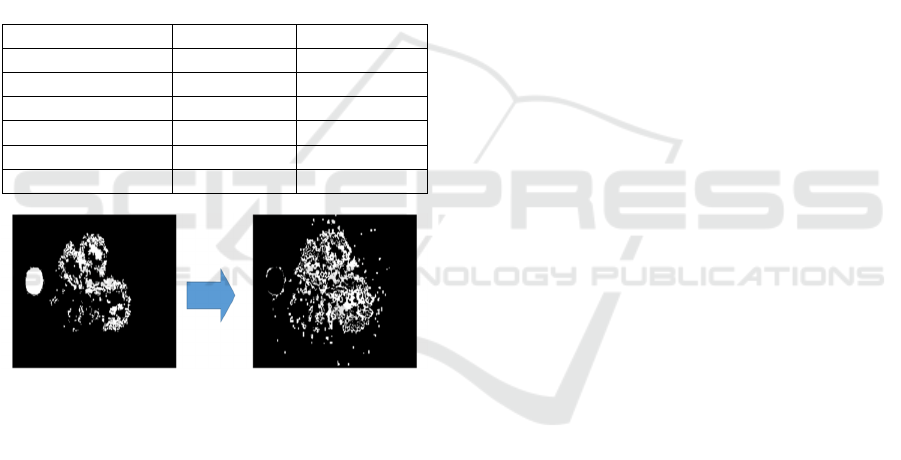
If we analyze IoU of each class (each lesion plus the
optic disk and the background), it reveals the
deficiencies of segmentation outputs. Those results
shown in Table III reveal that the background and
optic disk have high IoU scores, but the lesions, have
low IoU scores, between 19 and 38%.
This is also seen visually in Figure 8, showing the
groundtruth labels (a) and the background false
positives (b), which are background pixels classified
as lesions. The total area of those false positives is 8%
of all image pixels or around 100% of all lesions plus
optic disk pixels. This agrees with the large amounts
of FP previously in the outputs of segmentation in
figure 6. The conclusion is that more work is
necessary in the future to improve and filter out false
positives.
Figure 6: Comparing groundtruths with outputs: Deeplab
and FCN.
(a) Groundtruth
(b) Undetected Lesions
(2.2%)
Figure 7: FCN detections of lesions.
Using Segmentation Networks on Diabetic Retinopathy Lesions: Metrics, Results and Challenges
133
4.3 Conclusions from Experiments
It is a common misconception that segmentation of
eye fundus lesions already achieves almost 100%
quality, and this misconception is supported by the
way metrics are used and also by the interpretation of
the task. One example is to consider partial overlaps
(e.g. > 10%) as detected lesion, versus measuring
precise degree of overlap (semantic segmentation).
Our experiments show that a simple segmentation
network scores very high and higher than prior work
in the tasks using those loose interpretations, but still
has serious difficulties correctly segmenting small
lesions using the semantic segmentation
interpretation (e.g. 21 to 32% IoU for small lesions).
As a conclusion, further work is necessary in the
future to improve the approaches.
Table 3: Per-class IoU.
Class IoU FCN IoU Deeplab
Background 88 83
OpticDisc 75 70
SoftExudates 35 32
Haemorrhages 38 32
HardExudates 26 26
Microaneurs 19 21
(a) Groundtruth
(b) FP~=100% of lesions
area
Figure 8: FCN false positives.
5 CONCLUSIONS
In this work we have studied the problem of accurate
segmentation of Eye-Fundus-Lesions. We have
proposed and evaluated carefully the use of deep
segmentation networks, in particular DeepLabV3 and
FCN, concluding that the proposed approach
improves when compared with previous work. But
we also highlighted some limitations of current
approaches, which are revealed mostly if we evaluate
the quality of semantic segmentation and use false
positives revealing metrics, such as IoU. We also
explain why we need to be careful with some metrics,
such as specificity, ROC or AUC in the context of
segmentation of lesions in EFI, and what sensitivity
alone does not reveal. In our future work we will
experiment more with loss functions and filtering out
false positives as some post-processing step, but also
improvements in architectures to deal with small
lesions.
ACKNOWLEDGMENTS
We have used datasets (Porwal, 2019) (Kauppi, 2007)
in our experimental work, we thank the organizers of
those datasets for their availability.
REFERENCES
Asiri, N., Hussain, M., Al Adel, F., & Alzaidi, N. (2019).
Deep learning based computer-aided diagnosis systems
for diabetic retinopathy: A survey. Artificial
intelligence in medicine.
Chen, L. C., Papandreou, G., Kokkinos, I., Murphy, K., &
Yuille, A. L. (2017). Deeplab: Semantic image
segmentation with deep convolutional nets, atrous
convolution, and fully connected crfs. IEEE
transactions on pattern analysis and machine
intelligence, 40(4), 834-848.
Csurka C., Perronnin (G. and F.), “What is a good
evaluation measure for semantic segmentation?,”
Proceedings of the British Machine Vision Conference
, 32.1–32.11. (2013).
Decencière et al.. Feedback on a publicly distributed
database: the Messidor database. Image Analysis &
Stereology, v. 33, n. 3, p. 231-234, aug. 2014. ISSN
1854-5165.
Erginay, A., Chabouis, A., Viens-Bitker, C., Robert, N.,
Lecleire-Collet, A., Massin, P., Jun 2008. OPHDIAT:
quality-assurance programme plan and performance of
the network. Diabetes Metab 34 (3), 235–42.
Giancardo, L., Meriaudeau, F., Karnowski, T., Li, Y., Garg,
S., Tobin, K., Chaum, E., 2012. Exudate-based diabetic
macular edema detection in fundus images using
publicly available datasets. Med. Image Anal. 16 (1),
216–226.
Gondal, W. M., Köhler, J. M., Grzeszick, R., Fink, G. A.,
& Hirsch, M. (2017, September). Weakly-supervised
localization of diabetic retinopathy lesions in retinal
fundus images. In 2017 IEEE international conference
on image processing (ICIP) (pp. 2069-2073).
Haloi, M. (2015). Improved microaneurysm detection using
deep neural networks. arXiv preprint
arXiv:1505.04424.
Kälviäinen, R. V. J. P. H., & Uusitalo, H. (2007).
DIARETDB1 diabetic retinopathy database and
evaluation protocol. In Medical Image Understanding
and Analysis (Vol. 2007, p. 61).
BIOIMAGING 2021 - 8th International Conference on Bioimaging
134

Kauppi, T., Kalesnykiene, V., Kamarainen, J.-K., Lensu,
L., Sorri, I., Raninen, A., Voutilainen, R., Pietila ̈, J.,
Ka ̈lvia ̈inen, H., Uusitalo, H., 2007. The DI-
ARETDB1 diabetic retinopathy database and
evaluation protocol. In: Proc BMVC. Warwik, UK.
Lin, T. Y., Dollár, P., Girshick, R., He, K., Hariharan, B.,
& Belongie, S. (2017). Feature pyramid networks for
object detection. In Proceedings of the IEEE
Conference on Computer Vision and Pattern
Recognition (pp. 2117-2125).
Liu Q., Zou B., Chen J., Ke W., Yue K., Chen Z., and Zhao
G., “A location-to-segmentation strategy for automatic
exudate segmentation in colour retinal fundus images,”
Computerized Medical Imaging and Graphics, vol. 55,
pp. 78–86, 2017.
Long, J., Shelhamer, E., & Darrell, T. (2015). Fully
convolutional networks for semantic segmentation. In
Proceedings of the IEEE conference on computer vision
and pattern recognition (pp. 3431-3440).
Mane V., Kawadiwale R., and Jadhav D., “Detection of red
lesions in diabetic retinopathy affected fundus images,”
in IEEE Inter- national Advance Computing
Conference (IACC), 2015, pp. 56–60.
Orlando, J. I., Prokofyeva, E., del Fresno, M., & Blaschko,
M. B. (2018). An ensemble deep learning based
approach for red lesion detection in fundus images.
Computer methods and programs in biomedicine, 153,
115-127.
Porwal, Prasanna, S. P. R. K. M. K. G. D. V. S. and
Meriaudeau, F., “Indian diabetic retinopathy image
dataset (idrid).,” IEEE Dataport. (2019).
Prentašić, P., & Lončarić, S. (2015). Detection of exudates
in fundus photographs using convolutional neural
networks. In 2015 9th International Symposium on
Image and Signal Processing and Analysis (ISPA) (pp.
188-192).
Quellec, G., Charrière, K., Boudi, Y., Cochener, B., &
Lamard, M. (2017). Deep image mining for diabetic
retinopathy screening. Medical image analysis, 39, 178-
193.
Qureshi, I., Ma, J., & Abbas, Q. (2019). Recent
development on detection methods for the diagnosis of
diabetic retinopathy. Symmetry, 11(6), 749.
Raman, R., Srinivasan, S., Virmani, S., Sivaprasad, S., Rao,
C., & Rajalakshmi, R. (2019). Fundus photograph-
based deep learning algorithms in detecting diabetic
retinopathy. Eye, 33(1), 97-109.
Ronneberger, O., Fischer, P., & Brox, T. (2015). U-net:
Convolutional networks for biomedical image
segmentation. In International Conference on Medical
image computing and computer-assisted intervention
(pp. 234-241). Springer, Cham.
Salehi, S., Erdogmus D., and Gholipour A., “Tversky loss
function for image segmen- tation using 3d fully
convolutional deep networks,” in International
Workshop on Machine Learning in Medical Imaging,
379–387, Springer (2017).
Sánchez, C., Niemeijer, M., Išgum, I., Dumitrescu, A.,
Suttorp-Schulten, M., Abràmoff, M., van Ginneken, B.,
2012. Contextual computer-aided detection: Improving
bright lesion detection in retinal images and coronary
calcification identification in ct scans. Med. Image
Anal. 16 (1), 50–62.
Shan, J., & Li, L. (2016). A deep learning method for
microaneurysm detection in fundus images. In 2016
IEEE First International Conference on Connected
Health: Applications, Systems and Engineering
Technologies (CHASE) (pp. 357-358).
Simonyan, Karen, and Andrew Zisserman. "Very deep
convolutional networks for large-scale image
recognition." arXiv preprint arXiv:1409.1556 (2014).
Tiu E., “Metrics to evaluate your semantic segmentation
model. (2019). [URL Accessed 8/2019]. URL:
https://towardsdatascience.com /metrics-to-evaluate-
your-semantic-segmentation-model-6bcb99639aa2.
Van Grinsven, M. J., van Ginneken, B., Hoyng, C. B.,
Theelen, T., & Sánchez, C. I. (2016). Fast convolutional
neural network training using selective data sampling:
Application to hemorrhage detection in color fundus
images. IEEE transactions on medical imaging, 35(5),
1273-1284.
Wilkinson C., Ferris F., Klein R.,et al. (2003). Proposed
international clinical diabetic retinopathy and diabetic
macular edema disease severity scales, in
Ophthalmology110(9),1677–1682 (2003).
Yu, H., Yang, Z., Tan, L., Wang, Y., Sun, W., Sun, M., &
Tang, Y. (2018). Methods and datasets on semantic
segmentation: A review. Neurocomputing, 304, 82-
103.
Zhang, X., Thibault, G., Decencière, E., Marcotegui, B.,
Laÿ, B., Danno, R. & Chabouis, A. et al. (2014).
Exudate detection in color retinal images for mass
screening of diabetic retinopathy. Medical image
analysis, 18(7), 1026-1043.
Zhou L., Li P., Yu Q., Qiao Y., and Yang J., “Automatic
hemorrhage detection in color fundus images based on
gradual removal of vascu- lar branches,” in IEEE
International Conference on Image Processing (ICIP),
2016, pp. 399–403.
Using Segmentation Networks on Diabetic Retinopathy Lesions: Metrics, Results and Challenges
135
