
Genetic Algorithm based L4 Identification and Psoas Segmentation
Namitha V. Benjamin
1
, Robert D. Boutin
2
, Abhijit J. Chaudhari
3
and Kwan-Liu Ma
1
1
Department of Computer Science, University of California, Davis, CA 95616, U.S.A.
2
Department of Radiology, Stanford University School of Medicine, Stanford, CA 94305, U.S.A.
3
Department of Radiology, University of California Davis, Sacramento, CA 95817, U.S.A.
Keywords:
Genetic Algorithm, Psoas Muscle, L4 Identification, Region Growing, Edge Linking.
Abstract:
Segmentation of the Psoas muscle is an important first step in identifying sarcopenia. Physicians use computed
tomography (CT) images to track changes in muscle mass, which, in turn, act as indicators of how well a
patient is responding to treatment. To measure the muscle, a radiologist segments a CT manually. This is
often time consuming task and can be prone to error. In this paper we propose a novel method to segment
psoas muscles from abdominal CT images. The novel approach uses imaging techniques augmented with
medical anatomic knowledge. The outcome of the algorithm is two fold; first, the 4
th
lumbar vertebra (L4) is
identified from a series of CT images. Second, the psoas muscle in the identified slice, is segmented based
on a genetic algorithm based edge linking method. The algorithm was applied to a series of datasets of 61
patients over the age of 65 with hip fractures, and we obtained an average match (true positive percentage) of
91%.
1 INTRODUCTION
“Sarcopenia” is defined as the age-related loss of
skeletal muscle mass and function (Cornet et al.,
2015; Santilli et al., 2014). Such a loss directly im-
pacts muscle strength, which in turn, increases occur-
rence of disability in the elderly. It has become recog-
nized as a major public health threat in our aging pop-
ulation, reaching an epidemic prevalence of up to 50%
by the age of 80 years (Santilli et al., 2014). Recent
studies show that this condition is known to occur not
only with age advancement, but also as a side effect
of diseases, such as cancer and cardiovascular condi-
tions. While there is now extensive data showing sar-
copenia as an important predictor of future negative
outcomes for patients (e.g., physical disability, com-
plications after surgery, death), muscle depletion is
often occult clinically. The medical community now
identifies it as an independent risk factor for predict-
ing future failing human health in adults. More and
more studies (Alfonso J. Cruz-Jentoft, 2019; Van An-
cum, 2020) are proving that sarcopenia can be a pre-
dictive factor of post-operative morbidity as well as
recovery after cancer surgeries. In an effort to stan-
dardize this process, the “European Working Group
on Sarcopenia in Older People” (EWGSOP), defined
mechanisms and assessment techniques to character-
ize sarcopenia (Alfonso J. Cruz-Jentoft, 2019). One
of the techniques identified was muscle mass. This
has led to several studies aiming to characterize the re-
lationship between lean muscle mass and patient out-
comes.
One of the key muscles identified for such studies
is the psoas muscle. Muscle mass can be measured via
either computed tomography (CT) or magnetic reso-
nance imaging (MRI), which are diagnostic imaging
techniques considered as a ground truth, by the med-
ical community. They allow for precise determina-
tion of body composition, including non-invasive as-
sessment of muscle mass and quality. Although these
body composition data are routinely collected on 90
million CT scans and 35 million MRI scans annu-
ally in the USA, those data are not analyzed quantita-
tively because of two unsolved problems: 1) the mas-
sive time burden, cost, and tediousness of perform-
ing manual measurements on individual imaging ex-
aminations, and 2) the lack of normative data across
large populations. If segmentation of muscle from
fat and other tissues could be automated, these prob-
lems could be solved and usher in a new era of “per-
sonalized medicine”, with quantitative body compo-
sition analysis performed automatically on all routine
anatomical imaging exams. Diagnosis of the type and
severity of sarcopenia would allow optimal prescrip-
tion of treatments for muscle depletion that include
120
Benjamin, N., Boutin, R., Chaudhari, A. and Ma, K.
Genetic Algorithm based L4 Identification and Psoas Segmentation.
DOI: 10.5220/0010207701200127
In Proceedings of the 14th International Joint Conference on Biomedical Engineering Systems and Technologies (BIOSTEC 2021) - Volume 2: BIOIMAGING, pages 120-127
ISBN: 978-989-758-490-9
Copyright
c
2021 by SCITEPRESS – Science and Technology Publications, Lda. All rights reserved

specific diets and exercises, as well as medications.
By manually outlining muscle, the diagnosis of sar-
copenia has been validated in research settings, com-
monly by isolating the psoas muscle at the level of the
4
th
lumbar vertebra (L4) on CT scans (Kamiya et al.,
2012; Ulf Tiede, 1996; Meesters et al., 2012). The
4
th
lumbar vertebrae has been chosen since the psoas
muscle is seen most prominently in this slice. In ad-
dition, anatomical landmarks can be reliably used to
identify this slice, thereby enabling the complete au-
tomation of this algorithm.
In this pilot study, manual segmentation by a
physician expert is used as a gold standard (“ground
truth”) for validating the accuracy of the proposed
method. Our aim was to develop an algorithm that
could automate the process of 1) reliably finding the
appropriate anatomic slice on a routine CT scan, and
then 2) accurately segmenting the psoas muscle of in-
terest.
2 RELATED WORKS
In addition to psoas muscles, there has been a growing
interest in abdominal muscle segmentation, as a strat-
ification tool in cancer treatment, pre-surgery treat-
ment, surgical procedures and radiation. Early work
done in this area used pre-defined Hounsfield Units
(HU) to develop threshold based segmentation tech-
niques. This approach can be reliably used to segment
adipose tissue whose HU uniquely ranges from -190
to -30. However, muscle segmentation poses more
challenges, since its HU values of -29 to 150, overlap
with those of neighbouring organs.
Prior research in psoas muscle segmentation, pri-
marily focuses on shape based models. Kamiya et
al.(Kamiya et al., 2012) derived a mathematical func-
tion based shape model for segmenting the psoas mus-
cle. However, this method still required the interven-
tion of a radiologist in selecting the slice of interest.
Meesters et al.(Meesters et al., 2012) presented an au-
tomatic system to assist the segmentation of abdomi-
nal organs, using the medially positioned psoas mus-
cle’s shape and location along with previously accom-
plished segmentation of the liver and spleen. How-
ever, owing to anatomical differences in patients, this
method showed varying results. Gilles et al.(Gilles
et al., 2006) introduced a modeling method for mus-
cles in the crural area for analyzing their motor func-
tion in MR images. Ng et al.(Ng et al., 2007) intro-
duced a recognition method, for surgical planning and
analysis of loss of mastication function of the tempo-
ral muscle. These two methods, however, were used
for MR images. The scalability of these methods to
CT images still remains unclear since the boundaries
between muscle and adjacent organs are not funda-
mentally different in such datasets.
Genetic Algorithms (GAs) have not been explored
as a solution for psoas muscle segmentation. It proves
to be a strong candidate if image segmentation is for-
mulated as a numerical optimization problem. (Sheta
et al., 2012) demonstrate how GAs complement exist-
ing optimization methods and has proved to be insen-
sitive to noise. This characteristic proves extremely
beneficial in medical imaging, in that GAs require no
gradient information and hence they are less likely
to get trapped in local minima on multimodal sur-
faces. Segmentation methods frequently use thresh-
olds to decide whether two pixels are in the same re-
gion or not. However, the thresholds negatively affect
the image segmentation and often result in inaccura-
cies. Therefore, the tuning values of the thresholding
algorithms must be set up carefully (Levialdi et al.,
2003; Hamdaoui et al., 2015). A multilevel thresh-
olding method which allows the determination of the
appropriate number of thresholds as well as the ade-
quate threshold values has been proposed in (Ham-
daoui et al., 2015). The paper combines both GA
and wavelet transform. In this paper we propose a
new method for image segmentation using GAs, by
posing the segmentation problem as an optimization
problem. The contribution of this work is the for-
mulation of a set of tuning parameters for GAs to
be effectively used on CT images. The authors have
shown that GAs can be used as an intermediate step to
develop an accurate segmentation map, which when
combined with medical anatomical knowledge, pro-
duces accurate segmentation results for psoas muscle
delineation. We will describe our works according to
the following organization. The proposed model and
the segmentation procedure are described in Section
3. The experimental results of the proposed model
and some results compared with region growing mod-
els are shown in Section 4. At last, the conclusions are
provided in Section 5.
3 PROPOSED METHOD
The proposed algorithm consists of two modules. The
first module implements an automated identification
of the L4 slice from the original CT images of the ab-
domen, which are provided as the module input. The
slice containing the image of the L4 vertebra is deter-
mined. This is done by detecting the top of the iliac
crest that acts as an anatomical landmark. The sec-
ond module implements a GA based edge linking that
identifies the pixels of the psoas muscle in the L4 slice
Genetic Algorithm based L4 Identification and Psoas Segmentation
121
obtained from the first module.
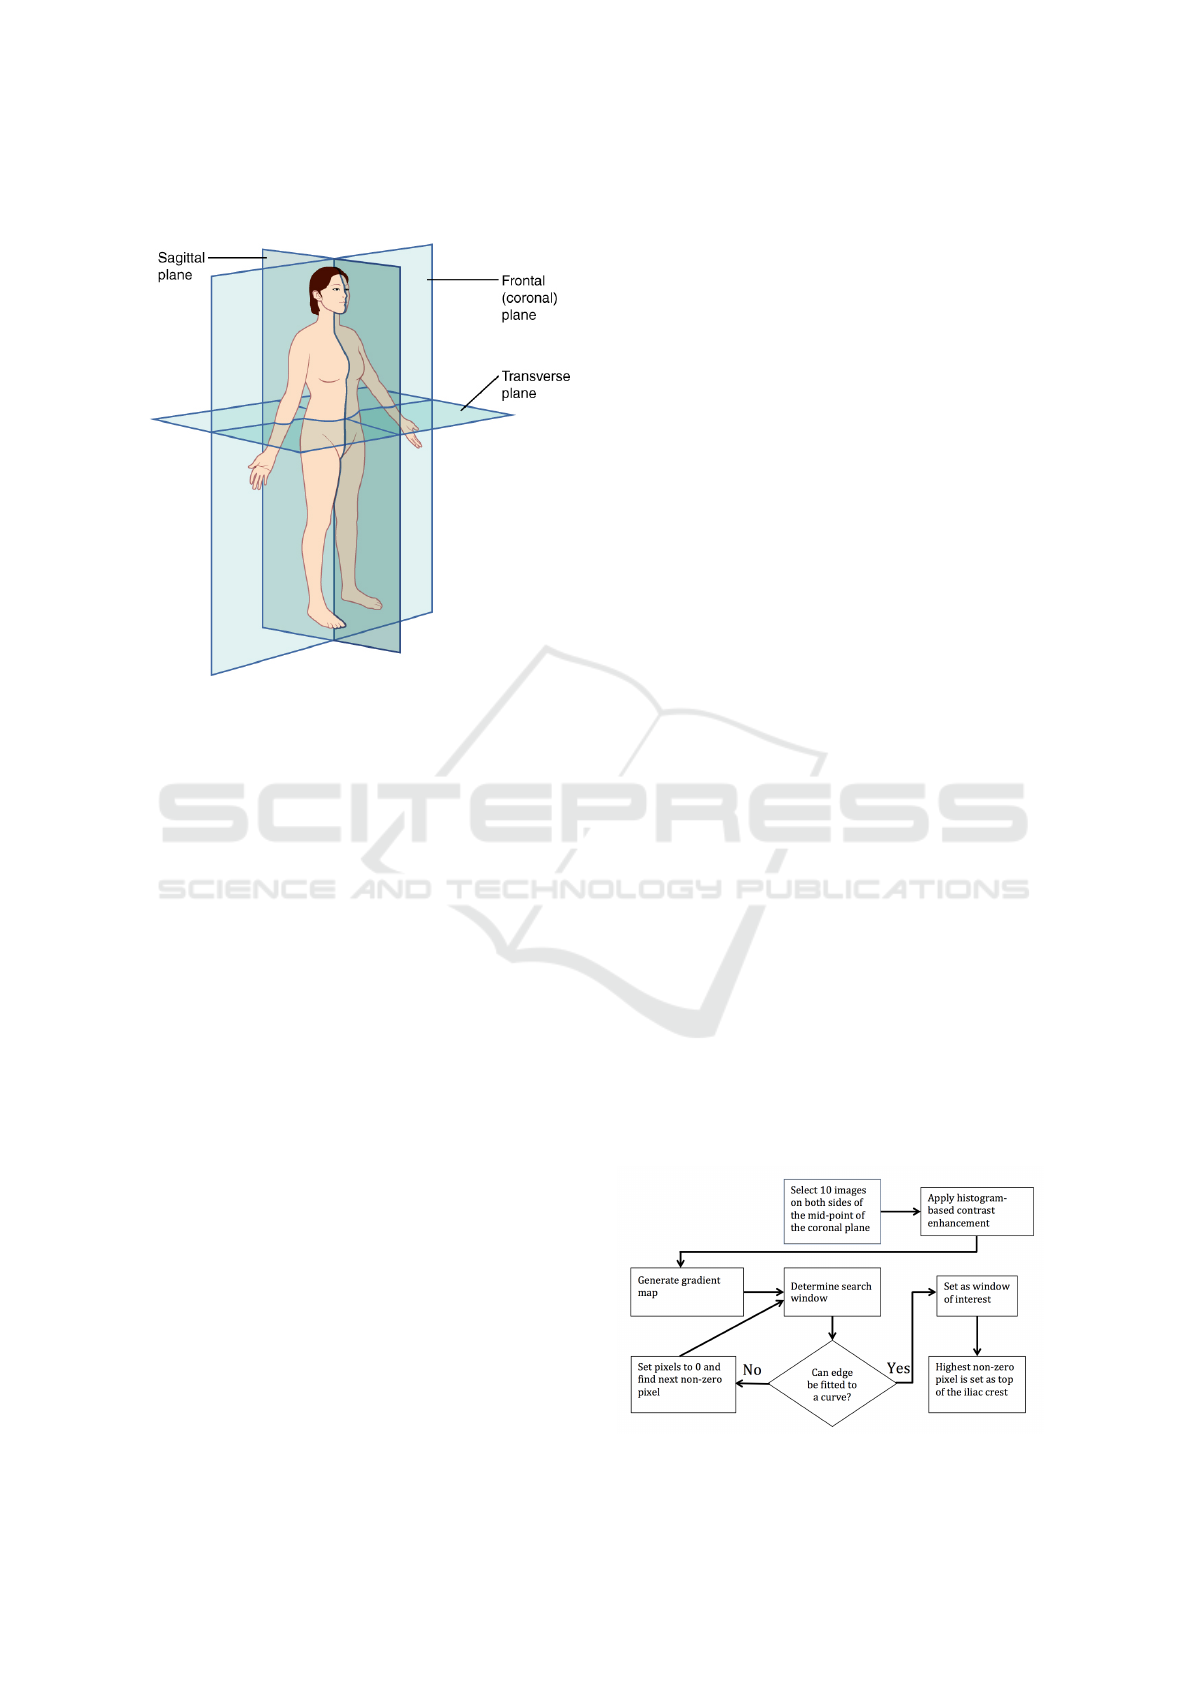
Figure 1: Planes of the Body.
3.1 L4 Identification
Before delving into the proposed method, it is im-
portant to understand terms used in the next sections,
for describing anatomical landmarks. Fig. 1 (Jones,
2018) shows how a landmark can be represented in
three dimensions. The terms superior and inferior
are used for describing the position along the main
body axis (representing top and bottom). Horizon-
tally, the terms anterior and posterior are used for the
front and back of the body respectively, while right
and left is used for description of lateral points. Two-
dimensional planes are used for describing cross-
sections of the body. The sagittal plane is parallel
to the body long axis and divides the body into left
and right sections. The coronal plane is also paral-
lel to the body axis and it divides the body to ante-
rior and posterior sections. Finally, the axial plane,
also known as transverse plane, is perpendicular to
the body long axis and divides it to superior and in-
ferior sections. The first module of our algorithm de-
termines the L4 slice from the images of a CT scan.
Medical literature highlights that the cross-section of
the psoas muscle’s transverse section is maximal at
the longitudinal center and minimal at its origin and
insertion. Parts of the skeletal muscles are connected
to the skeleton. Hence, at the L4 vertebra, the radius
of these muscles is likely the largest. Fig. 2 displays
the flowchart of the L4 identification module. The
identification method is mainly based on the anatom-
ical location of the L4 vertebra.
In current clinical practice, radiologists com-
monly determine the L4 level in three steps (Farshad-
Amacker et al., 2015): i) identifying the superior mar-
gin of the iliac crests in the coronal plane, followed
by ii) connecting these points along the mediolateral
axis, and then iii) selecting the vertebra superior to
this axis. In our algorithm, this process is automated
and streamlined by identifying the L4 level consis-
tently at a level 2 cm above the iliac crests. Thus, we
consider ’n’ slices as candidates to implement the al-
gorithm to determine the L4 slice, where ’n’ depends
on the separation of the slices in the series (for ex-
ample, 5 mm or 2 mm or 1.25 mm, depending on the
slice). For example, if the input images have a 5 mm
separation, then we define the L4 level by selecting
the image four slices above the top of the iliac crest.
To do this manually over a large dataset proves to be
extremely time consuming, and hence uneconomical.
The first author of this paper manually extracted
the muscle regions. These regions were then in-
spected, and, if necessary, the results were revised by
the third author, who is a medical expert on anatomy.
3.1.1 Pre-processing
In order to identify the iliac crests, the three-
dimensional data was processed in the coronal plane.
This required up-sampling followed by rotation while
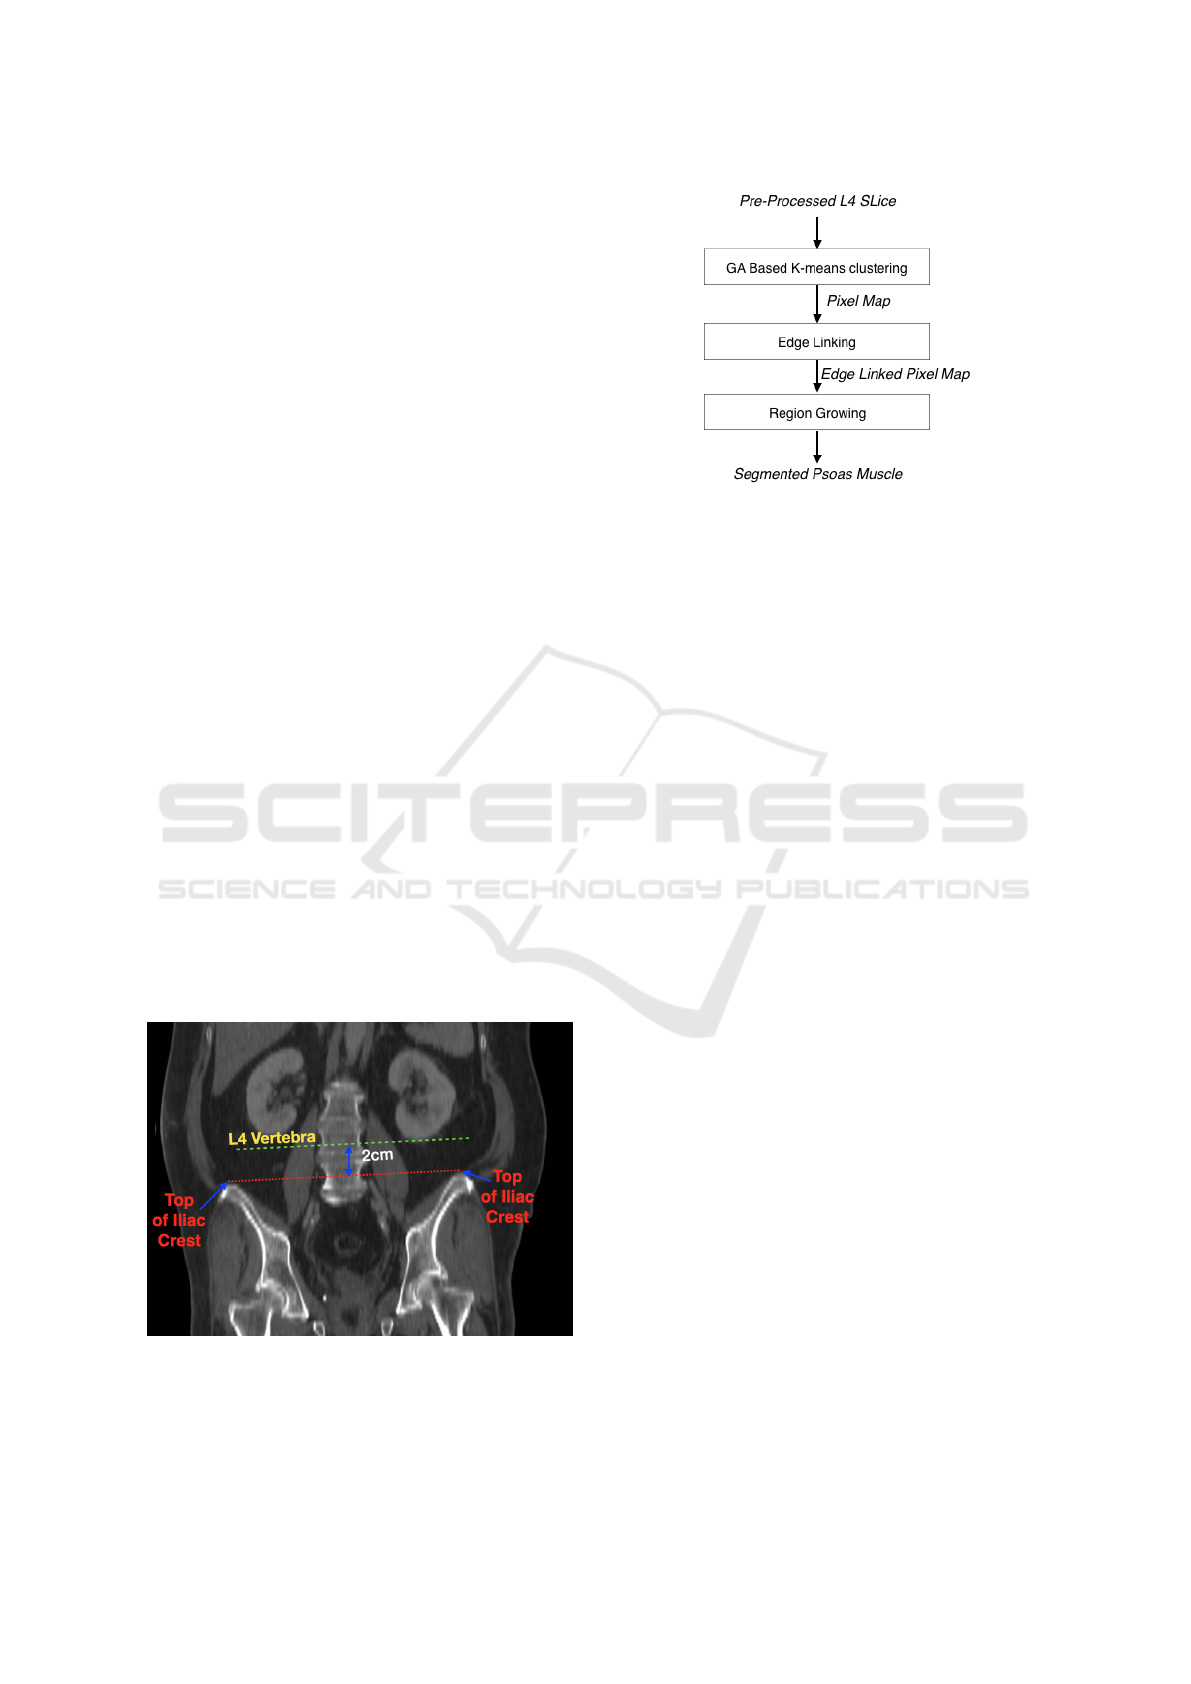
translating from axial to coronal plane. Fig. 3 shows
the image of a slice from the coronal plane where the
top of both the iliac crests are marked by red dots and
the L4 vertebra is identified as 2 cm.
In order to optimize the algorithm we ran the
next phase only on twenty slices. To determine these
twenty slices, the contrast of all slices was enhanced
by histogram equalization, after which the number of
bone pixels in each slice were determined, based on
a threshold. In order to determine this threshold, the
image was first normalized after which it was fit to a
normal distribution. A cumulative distributive func-
tion was used to determine the threshold, as the in-
tensity value of the upper 90% of the pixels. Twenty
Figure 2: Flowchart of L4 Identification.
BIOIMAGING 2021 - 8th International Conference on Bioimaging
122
slices with the most number of bones pixels were cho-
sen for the next step, in which the edge map was com-
puted using a Canny edge detector. This step found
edges by looking for local maxima in the image gra-
dient (Canny, 1986). The gradient was then calculated
using the derivative of a Gaussian filter. The method
used two thresholds, to detect strong and weak edges,
and included the weak edges in the output only if they
are connected to strong edges. The algorithm was im-
plemented in MATLAB and the default threshold val-
ues were chosen.
3.1.2 Search Window
Owing to the symmetric nature of the iliac crests, the
recursive portion of the algorithm was run on each
half of the image. The search window was initialized
at the first pixel encountered on the edge map, towards
the superior end of the image. The search window
was then expanded with a maximum of 8x8 pixels,
until the next pixel on the edge map was hit. This
continued until the search window stopped growing
in all directions. In a search window, if the non-zero
pixel could be fitted to a curve, that was the window
of interest containing the iliac crest. Otherwise, all
pixels in that region were set to zero and the search
window was initialized at the next non-zero pixel. In
the search window of interest, the superior-most pixel
on the edge map was the tip of the iliac crest. This L4
slice was determined at 2 cm above this point (tak-
ing into consideration the sampling performed during
transformation between planes).
3.2 Proposed Genetic Algorithm (GA)
based Edge Linking Method
Figure 3: L4 Slice Detection.
In this paper, we propose a novel segmentation tech-
nique that has its foundation in GAs, to perform a se-
mantic segmentation of the image. Fig. 4 highlights
Figure 4: Overview of GA based Region Growing Method.
the main blocks of the proposed algorithm. At a high
level, the GA is used to obtain a pixel map, where
pixels are grouped by the likelihood that they belong
to one class. The pixel map is then used, to perform
a region growing in an edge linked constraint to ob-
tain the final segmented image of the left and right
psoas muscle. In the subsequent sections, we will go
over details of each of these functional blocks. Before
feeding the L4 slice into this part of the algorithm, the
image is first pre-processed to highlight the bone and
the areas surrounding it. This is done based on Otsu’s
thresholding.
3.2.1 Genetic Algorithm based K-means
Clustering
Genetic algorithms have been proven to solve numeri-
cal optimization problems by stochastic search meth-
ods of the solution space. The premise of this algo-
rithm is that a fitness function is used to obtain the
best possible candidates for the final solution, in an
iterative manner, through mutation, crossover and se-
lection. GA’s used earlier (Krishna and Murty, 1999)
in clustering employ either an expensive crossover
operator to generate valid child chromosomes from
parent chromosomes or a costly fitness function or
both. To circumvent these expensive operations, we
hybridize GA with a classical gradient descent al-
gorithm used in clustering like K-means algorithm.
Hence, the name genetic K-means algorithm.
The GA consists of the following steps (Sheta
et al., 2012):
1. Initialize population.
2. Compute fitness function at every pixel, based on
fitness function.
3. Fittest individuals are selected for next iteration
based on selection function.
4. Generate next population based on reproductive
operators and fit members of current population.
5. Stop if stopping criterion is met, else go to step 3.
Genetic Algorithm based L4 Identification and Psoas Segmentation
123
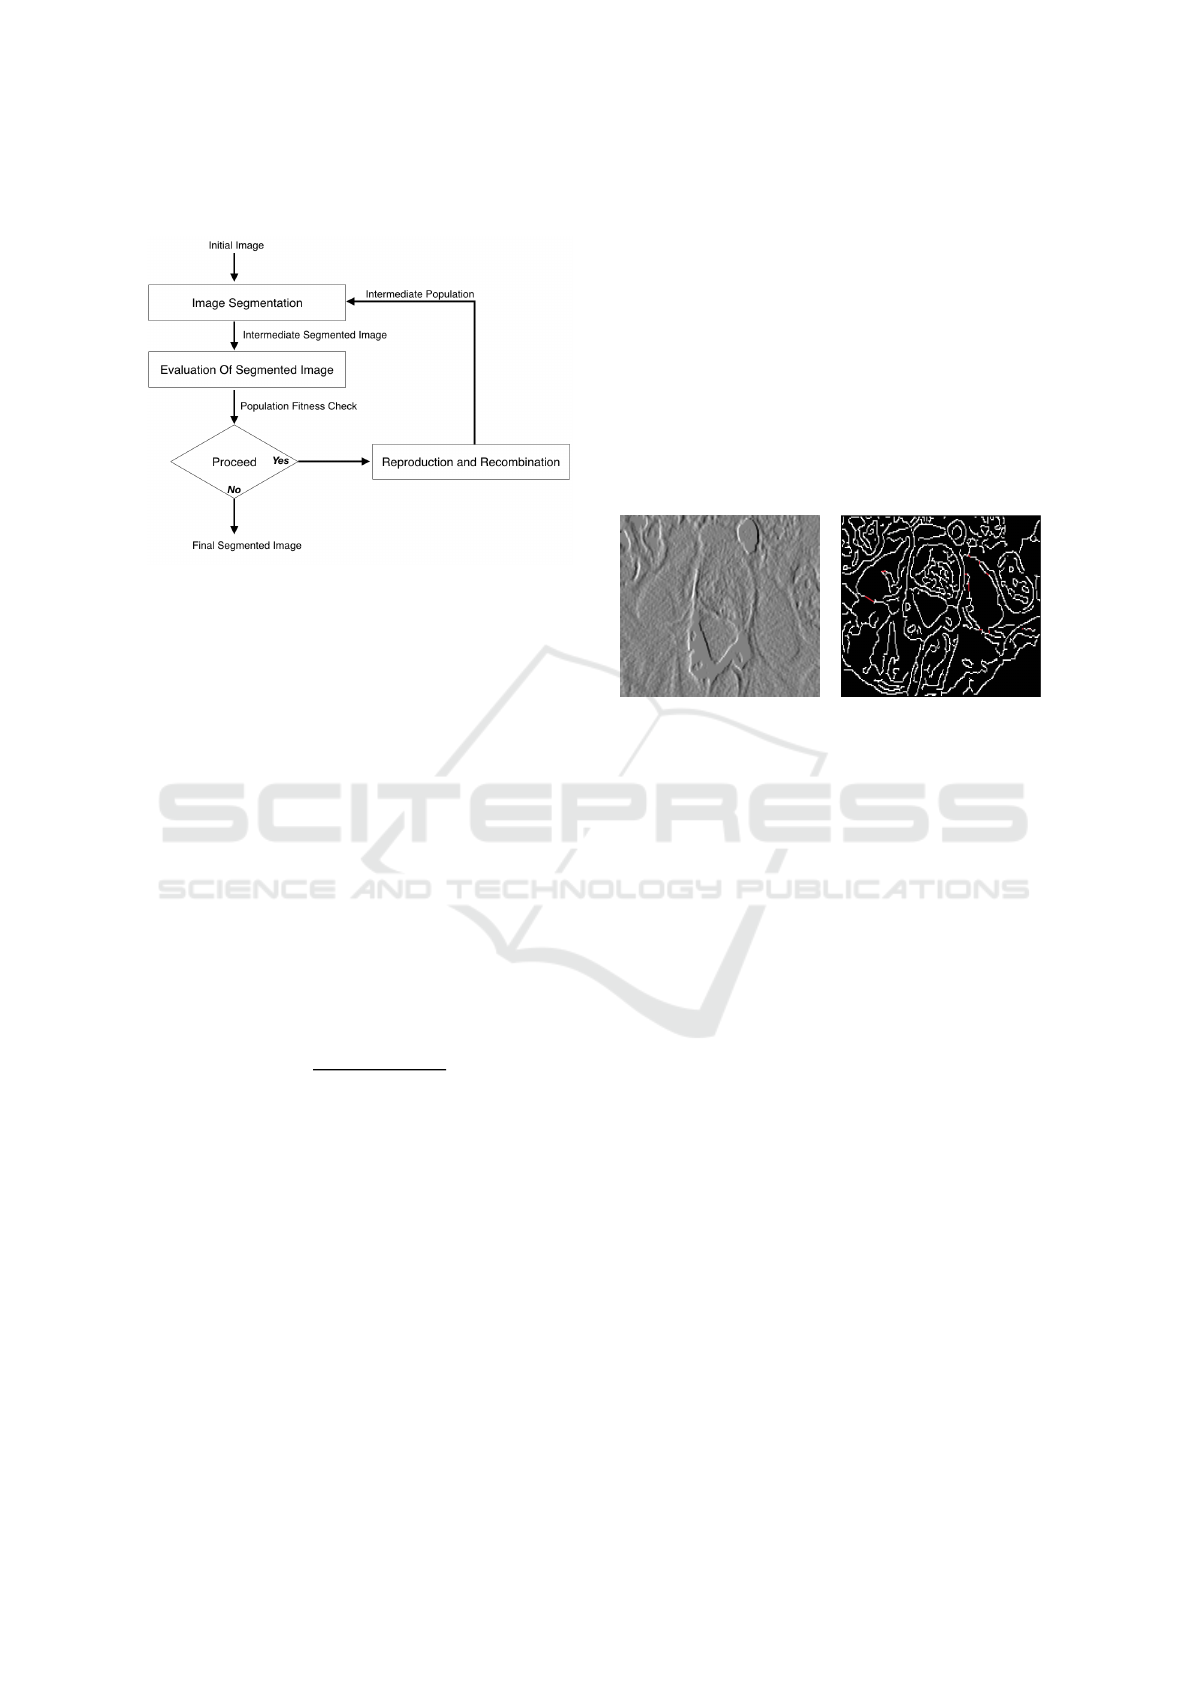
These steps are represented in Fig. 5.
Figure 5: Segmentation using Genetic Algorithms.
Fitness Function:
In GAs, a fitness function is used to evaluate if in-
dividuals are capable of producing offsprings. In the
proposed algorithm, a fitness function has been de-
fined on the basis of the Euclidean distance computed
between a given chromosome (i.e. pixel) and a region
S. The fitness of an individual pixel, i is defined as
follows
Φ
i
= min((G
k
− i)
2
) (1)
where:
G
k
, denotes the centroid of the kth cluster,
i, represents the pixel value at that location.
Selection Function:
The selection function used in the proposed algorithm
is Roulette wheel, developed by Holland (Holland,
1992). The probability, P
i
, for each individual is
defined by:
P
i
=
F
i
P
PopulationS ize
j=1
F
j
(2)
where F
i
, equals the fitness of individual i.
The use of roulette wheel selection limits the genetic
algorithm to maximization since the evaluation
function must map the solutions to a fully ordered set
of values on fit. Extensions, such as windowing and
scaling, have been proposed to allow for minimiza-
tion and negativity.
Stopping Criteria:
The GA algorithm iterates through several genera-
tions until a stopping criteria is met. The proposed al-
gorithm uses the specified number of maximum gen-
erations as its termination criterion.
3.2.2 Edge Linking and Region Growing
The technique of edge-based region growing (Singh
et al., 2011) (Jamil et al., 2011) is chosen, as the
left and right psoas muscles are in a contained region
above the L4. As a first step, the edge map of the re-
duced region of interest is obtained by using canny
edge operator. Edge linking is then performed by
merging edges (Sappa and Vintimilla, 2008). Edge
merging is done if the edge map contains discontinu-
ities lesser than a given threshold, between pixels hav-
ing similar gradient values. Fig. 6 shows the linked
edges highlighted in red on the edge map.
(a) Gradient Image (b) Highlighted Linked Edges
Figure 6: Edge Linking.
This makes the region growing much less noisy
and is contained to the closed regions of the edges.
Following the edge linking process, region growing is
applied starting at the seed location determined in the
previous section. The two parameters considered in
the region growing process are: 1) the difference be-
tween a pixel’s intensity value and the region’s mean
which is a measure of the similarity of the pixel to a
given region and 2) if the pixel lies on the edge map.
This process stops when the intensity difference be-
tween region mean and new pixel become larger than
a certain threshold or if the pixel lies on the edge
map. Region growing on the edge-linked edge map
contains the region growing process to only the psoas
muscle margin even if the difference in pixel inten-
sity between the psoas and the surrounding abdominal
muscles is not large.
4 RESULTS
We validated our algorithm on a dataset consisting of
abdominal CT scans of 61 patients all over the age of
65 years with hip fractures (32 female and 29 male).
The CT scans on average have 90 images in every
series. These images are 512x512, with a bit depth of
16 bits captured via helical scan mode. 90% of these
images do not have any contrast agent. The presence
of a contrast agent is seen to boost the accuracy of
BIOIMAGING 2021 - 8th International Conference on Bioimaging
124
the algorithm. In this cohort all the scans have a slice
thickness of 5mm. The algorithm performs well at
this value. However, for some, 1.25mm slice thick-
ness were also available. The algorithm did not show
promising results at this thickness owing to the high
amount of noise in these images.
Table 1: Results of L4 Identification.
Range of L4 L4 Slice
Slices (proposed
(ground truth) method)
patient1 27-32 31
patient2 51-56 51
patient3 2-7 4
patient4 41-46 42
patient5 33-37 36
patient6 44-49 49
patient7 42-47 44
patient8 39-44 43
patient9 37-42 50
To evaluate the accuracy of the L4 identification,
a radiologist was asked to identify the range of L4
slices in each dataset. The accuracy of this module
is determined by the number of slices by which the
algorithm misses the required L4 range, as manually
determined by a domain expert (radiologist). Table 1
shows a sampling of the results for the L4 identifica-
tion module of the algorithm. The datasets were cho-
sen such that each has a unique position for the L4
slice. This ensures the robustness of the algorithm.
Even when the iliac crests were not exactly symmet-
ric, the algorithm performed accurately across such
datasets. As can be seen in Table 1, our algorithm
failed to correctly identify the position of L4 slice
of patient9 and obtained a difference of 8 slices rel-
ative to the ground truth. This was the case where
the algorithm performed the worst. On retrospective
analysis, we found out that this dataset did not have
sufficient contrast difference between the psoas and
the surrounding abdominal soft tissues. Out of the 61
CT images, about 12 datasets missed the L4 window
with an error of 1-8 slices. This will be addressed in
future research, by incorporating the shape model of
the psoas muscle to improve the accuracy of the al-
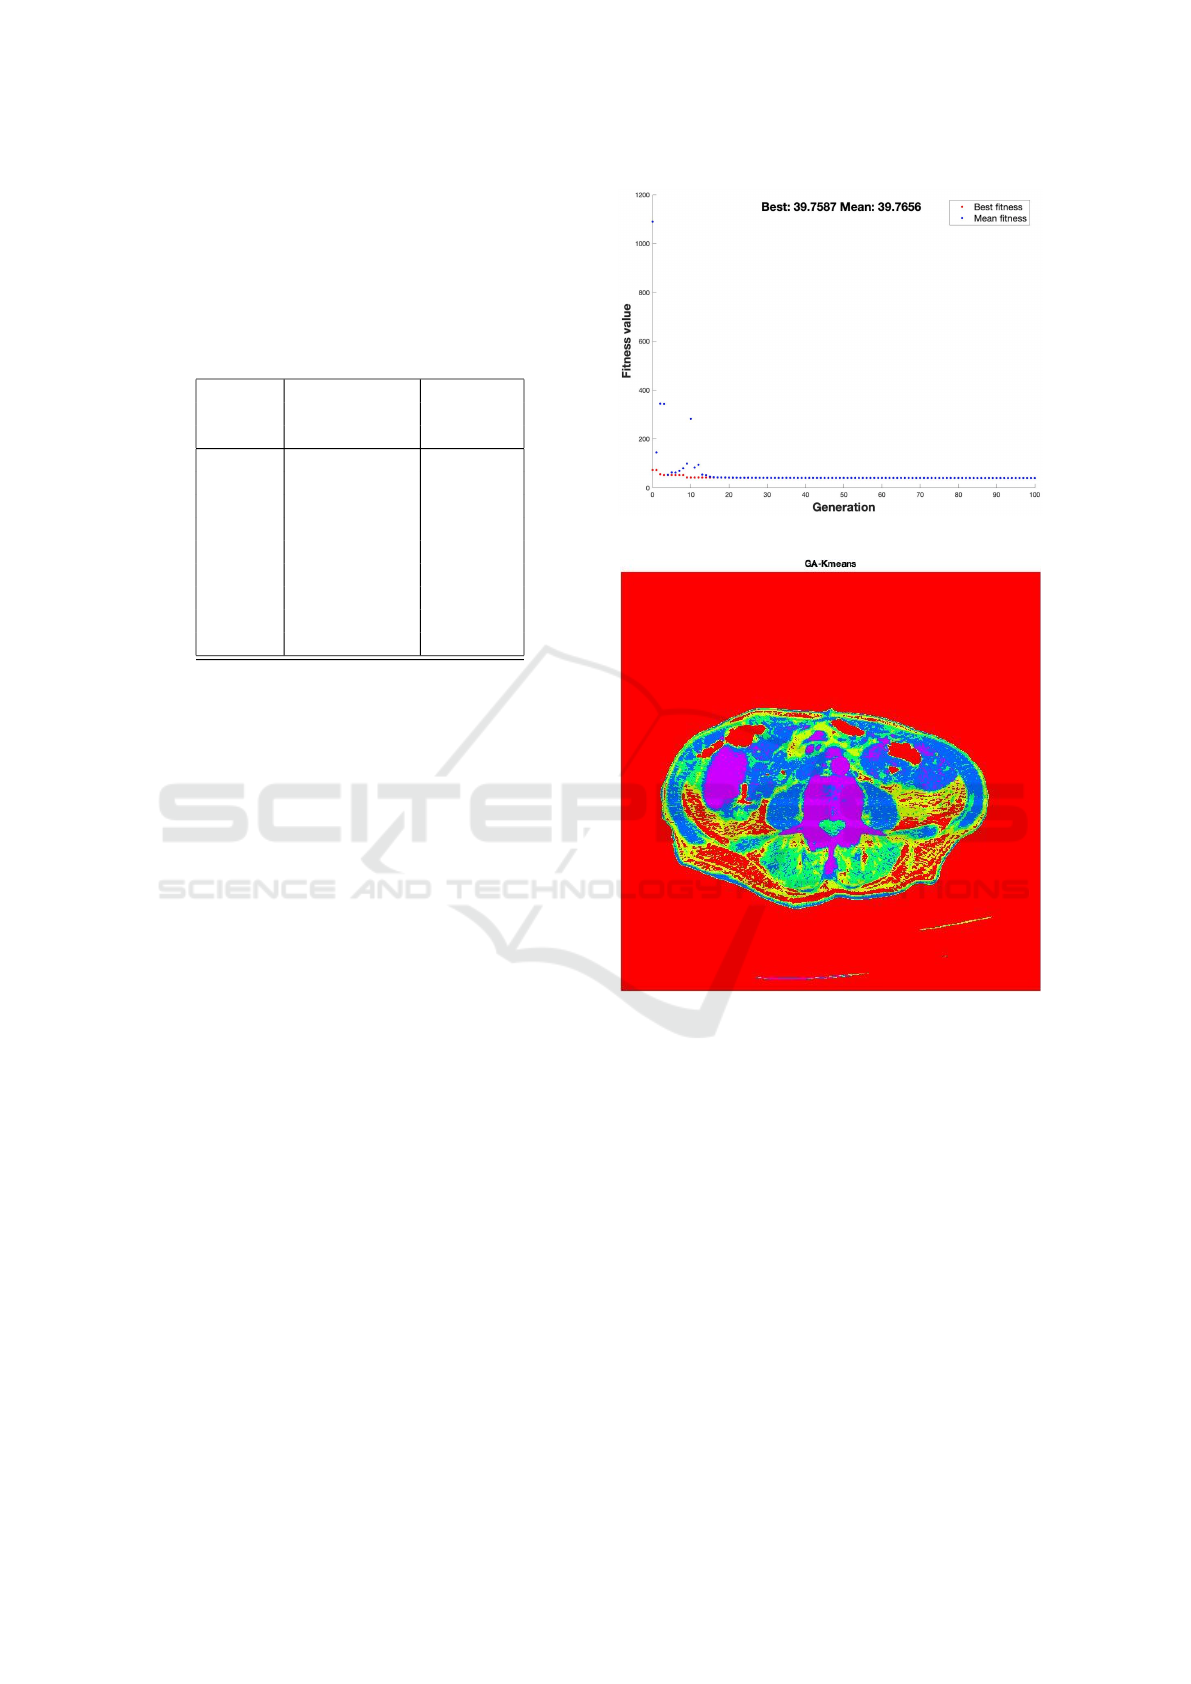
gorithm. The initial population of the Genetic Al-
gorithm was randomly selected. The population size
of 50 was chosen. A stopping factor of 100 genera-
tions was selected for these runs. Fig.7 shows that,
for a CT image at the L4 slice, the fitness function
converges within the selected stopping criteria of 100
generations. At the end of this stage, the GA driving
k-means segmentation generates a segmentation map
as shown in Fig.8 and Fig.9. Note, Fig.8, shows the
Figure 7: Convergence of Genetic Algorithm.
Figure 8: Segmentation map produced by Genetic Algo-
rithm.
various classes highlighted in HSV color space. This
is done for the sake of representation only. The pro-
posed method consumes a gray scale version of this,
as represented in Fig 9. For evaluating the accu-
racy of the psoas muscle segmentation algorithm, we
compared the manual segmentation as performed by
a radiologist and our semi-automatic segmentation al-
gorithm of the abdominal CT scans. The results of
two datasets are shown in figures 10 and 11.
In order to quantify our results, we have computed
the true positive percentage as the number of pixels la-
belled as psoas in both the ground truth and the output
of our algorithm. False positives are pixels marked as
psoas by our algorithm and not psoas in the ground
truth. Finally, we have false negatives as pixels that
are actual psoas muscle pixels in the ground truth, and
that are not labeled by our algorithm.
Genetic Algorithm based L4 Identification and Psoas Segmentation
125
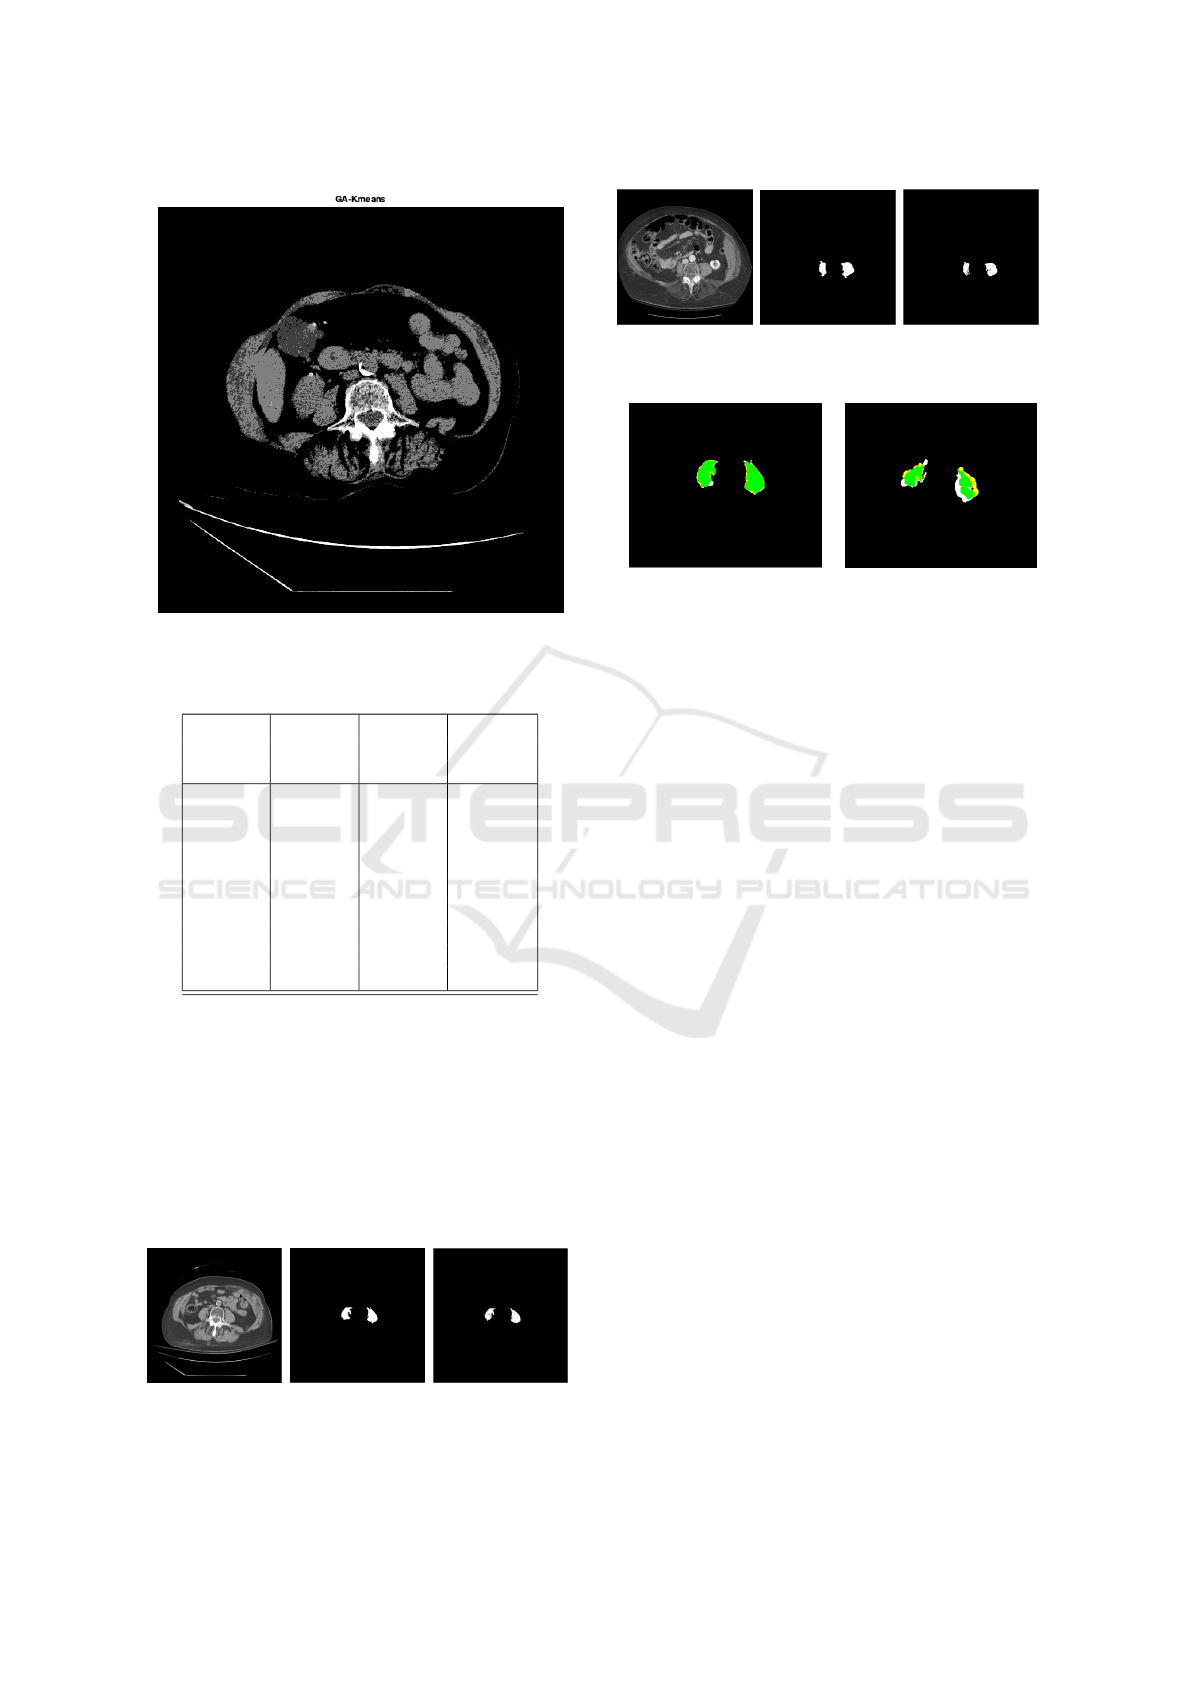
Figure 9: Segmentation map produced by Genetic Algo-
rithm.
Table 2: Results of Psoas Segmentation.
True False False
positive positive negative
rate (%) rate (%) rate (%)
patient1 86.47 7.64 25.87
patient2 87.33 16.70 15.96
patient3 91.59 5.11 3.28
patient4 84.25 7.44 8.30
patient5 89.62 1.88 8.49
patient6 92.76 1.82 14.41
patient7 83.64 13.42 2.92
patient8 83.10 3.11 13.79
patient9 95.10 1.72 19.18
These results that are computed across the dataset are
tabulated in Table 2. Our algorithm showed relatively
low detection rates on three datasets, i.e. patient 1, 2
and 9. Because these three datasets of lower contrast,
result in the details around edges be lost. In particular,
our algorithm failed to identify the correct position of
L4 slice for patient9. The dataset corresponding to
patient9 showed lower true positive percentage, as it
failed to correctly identify the correct L4 slice.
(a) L4 Slice (b) Ground Truth (c) Our Result
Figure 10: Psoas Segmentation Results.
(a) L4 Slice (b) Ground Truth (c) Our Result
Figure 11: Psoas Segmentation Results.
(a) patient2 (b) patient1
Figure 12: Accuracy of Psoas Segmentation Algorithm.
In Fig. 12(a) and (b) we use the detected results
of patients1 and patient2, respectively, to show how
the numbers in Table 2 are calculated. The true pos-
itives (TP) are highlighted in green, false negatives
(FN) are highlighted in white and false positives (FP)
are shown in yellow.
5 CONCLUSION
We present a semi-automatic method to identify im-
ages corresponding to the 4
th
lumbar vertebra and
then identify the left and right psoas muscles in this
slice. Anatomical landmarks were set up in a com-
pletely automatic manner with the use of spatial posi-
tioning information on the images. The algorithm was
tested on 61 datasets. The L4 identification module of
the algorithm shows accurate results in about 80% of
the cases. The failing cases were primarily scans with
poor resolution and contrast, which resulted in irreg-
ularities of muscle boundaries. This proved to be a
breaking point of this algorithm, that relied on edge
linking.
The psoas muscle segmentation module recorded
average true positive rate of 91%. As next steps, the
accuracy of the algorithm will be enhanced by im-
proving the accuracy of the edge linking phase of the
segmentation algorithm. This will in turn preserve de-
tails around edges of the psoas muscle. Our approach
met the criterion laid out by radiologists to replace the
current manual process of psoas muscle identification
around the L4.
BIOIMAGING 2021 - 8th International Conference on Bioimaging
126

ACKNOWLEDGEMENTS
The research in this paper was partially supported
by National Institutes of Health under award num-
ber R01 AR076088. The authors would like to thank
Dr. Stephen Henrichon of the University of Califor-
nia, Davis, who provided access to scans as well as
training on image interpretation.
REFERENCES
Alfonso J. Cruz-Jentoft, Jean Pierre Baeyens, e. a. (2019).
Clinical definition of sarcopenia. Sarcopenia: Euro-
pean consensus on definition and diagnosis: Report of
the European Working Group on Sarcopenia in Older
People, Age and Ageing, 39(4):412–423.
Canny, J. (1986). A computational approach to edge detec-
tion. Pattern Analysis and Machine Intelligence, IEEE
Transactions on, PAMI-8(6):679–698.
Cornet, M., Lim, C., Salloum, C., Lazzati, A., Compagnon,
P., Pascal, G., and Azoulay, D. (2015). Prognostic
value of sarcopenia in liver surgery. Journal of vis-
ceral surgery, 152(5):297-304.
Farshad-Amacker, N. A., Aichmair, A., Herzog, R. J., and
Farshad, M. (2015). Merits of different anatomical
landmarks for correct numbering of the lumbar verte-
brae in lumbosacral transitional anomalies. European
Spine Journal, 24(3):600–608.
Gilles, B., Moccozet, L., and Magnenat-Thalmann, N.
(2006). Anatomical Modelling of the Musculoskele-
tal System from MRI. Medical Image Computing
and Computer-Assisted Intervention – MICCAI 2006,
4190:289–296.
Hamdaoui, F., Sakly, A., and Mtibaa, A. (2015). An effi-
cient multi level thresholding method for image seg-
mentation based on the hybridization of modified pso
and otsu’s method. Computational Intelligence Appli-
cations in Modeling and Control, 2003:343–367.
Holland, J. H. (1992). Adaptation in Natural and Artificial
Systems: An Introductory Analysis with Applications
to Biology, Control and Artificial Intelligence. MIT
Press, Cambridge, MA, USA.
Jamil, N., Soh, H., Tengku Sembok, T., and Bakar, Z.
(2011). A Modified Edge-Based Region Grow-
ing Segmentation of Geometric Objects. Visual
Informatics: Sustaining Research and Innovations,
7066(4):99–112.
Jones, O. (2018). Anatomical Planes.
Kamiya, N., Zhou, X., Chen, H., Muramatsu, C., Hara, T.,
Yokoyama, R., Kanematsu, M., Hoshi, H., and Fujita,
H. (2012). Automated segmentation of psoas major
muscle in X-ray CT Images by use of a shape model:
preliminary study. Radiological Physics and Technol-
ogy, 5(1):5–14.
Krishna, K. and Murty, M. (1999). Genetic k-means algo-
rithm. IEEE transactions on systems, man, and cyber-
netics. Part B, Cybernetics: A publication of the IEEE
Systems, Man, and Cybernetics Society, 29:433–9.
Levialdi, S., Cinque, L., Cucchiara, R., and Pignalberi, G.
(2003). Tuning range image segmentation by genetic
algorithm. EURASIP Journal on Advances in Signal
Processing, 2003.
Meesters, S., Yokota, F., Okada, T., Takaya, M., Tomiyama,
N., Yao, J. J., Liguraru, M., Summers, R., and Sato,
Y. (2012). Multi atlas-based muscle segmentation in
abdominal CT images with varying field of view. Med
Image Anal.
Ng, H., Hu, Q., Ong, S., Foong, K., Goh, P., Liu, J., and
Nowinski, W. (2007). Segmentation of the temporalis
muscle from MR data. International Journal of Com-
puter Assisted Radiology and Surgery, 2(1):19–30.
Santilli, V., Bernetti, A., Mangone, M., and Paoloni, M.
(2014). Clinical definition of sarcopenia. Clinical
cases in mineral and bone metabolism: the official
journal of the Italian Society of Osteoporosis, Mineral
Metabolism, and Skeletal Diseases, 11(3):177-180.
Sappa, Angel, D. and Vintimilla, Boris, X. (2008).
Edge Point Linking by Means of Global and Local
Schemes. Signal Processing for Image Enhancement
and Multimedia Processing, 31(4):115–125.
Sheta, A., Braik, M. S., and Aljahdali, S. (2012). Genetic
algorithms: A tool for image segmentation. In 2012
International Conference on Multimedia Computing
and Systems, pages 84–90.
Singh, R., Singh, J., Sharma, P., and Sharma, S. (2011).
Edge based region growing. International Journal of
Computer Technology and Applications, 2(4).
Ulf Tiede, Thomas Schiemann, K. H. (1996). Visualizing
the Visible Human. IEEE Computer Graphics and
Applications, 16(1):7–9.
Van Ancum, J. M. (2020). Impact of using the updated ewg-
sop2 definition in diagnosing sarcopenia: A clinical
perspective. Archives of gerontology and geriatrics.
Genetic Algorithm based L4 Identification and Psoas Segmentation
127
