
The Gopher’s Gambit: Survival Advantages of Artifact-based
Intention Perception
Cynthia Hom
†,1 a
, Amani R. Maina-Kilaas
†,1 b
, Kevin Ginta
2 c
, Cindy Lay
3 d
and George D. Monta
˜
nez
1 e
1
AMISTAD Lab, Department of Computer Science, Harvey Mudd College, Claremont, CA, U.S.A.
2
Department of Math and Computer Science, Biola University, La Mirada, CA, U.S.A.
3
Department of Mathematical Sciences, Claremont McKenna College, Claremont, CA, U.S.A.
Keywords:
Awareness, Intention Perception, Risk, Trap, Agents, Intention Trilogy.
Abstract:
Being able to assess and calculate risks can positively impact an agent’s chances of survival. When other
intelligent agents alter environments to create traps, the ability to detect such intended traps (and avoid them)
could be life-saving. We investigate whether there are cases for which an agent’s ability to perceive intention
through the assessment of environmental artifacts provides a measurable survival advantage. Our agents are
virtual gophers assessing a series of room-like environments, which are potentially dangerous traps intended
to harm them. Using statistical hypothesis tests based on configuration coherence, the gophers differentiate
between designed traps and configurations that are randomly generated and most likely safe, allowing them
access to the food contained within them. We find that gophers possessing the ability to perceive intention have
significantly better survival outcomes than those without intention perception in most of the cases evaluated.
1 INTRODUCTION
Imagine a wealthy individual has announced they
have hidden a large sum of money in an abandoned
mine. You feel particularly adventurous and visit the
mine in search of treasure. Approaching one of the
mine’s many entrances, your excitement plummets as
you notice the hazardous conditions. The precarious
wooden floor planks separating you from a 50-foot
drop are worn and rotted. Trails of crumbling rock in-
termittently fall from the roof and walls, indicating a
potential cave-in at any time. You slowly realize this
may not be accidental; perhaps the owner of the mine
intended to make the situation hopelessly dangerous.
As you survey the space with increasing skepticism,
you notice some strange beam-and-rope structures at-
tached to a few of the platforms—their trap-like ap-
pearance sets off additional red flags. Weighing your
safety against the possibility of reward, you decide the
a
https://orcid.org/0000-0002-5346-7451
b
https://orcid.org/0000-0003-1555-4666
c
https://orcid.org/0000-0003-1410-2465
d
https://orcid.org/0000-0002-3305-6815
e
https://orcid.org/0000-0002-1333-4611
†
Denotes equal authorship.
perilous quest is not worth the risk.
Red flags often warn us of danger. They are ob-
servable signals which humans and animals instinc-
tively use to determine what actions to take after sens-
ing potential danger. More generally, risk assessment
identifies possible events, along with their likelihood
of occurring, that may negatively impact the individ-
ual. Risk assessment is a fundamental tool for sur-
vival, not only in nature but also in other danger-
ous situations and environments, such as volatile con-
frontations and unstable locations (Lowrance, 1980).
The perception of agent intention, which we call in-
tention perception, represents a particular kind of risk
assessment, judging whether other external agents in-
tend to harm or simply ignore the perceiving agent.
While intention perception is often physical and di-
rect, such as using eye tracking to estimate atten-
tion, intentions can also be communicated through ar-
tifacts, such as words and engineered works.
This manuscript is one of a trilogy of forthcom-
ing papers by our research group exploring the po-
tential survival advantages of intention perception in
artificial agents. The other two studies focus on di-
rect and indirect intention perception based on agent
interactions, exploring the impact of intention percep-
Hom, C., Maina-Kilaas, A., Ginta, K., Lay, C. and Montañez, G.
The Gopher’s Gambit: Survival Advantages of Artifact-based Intention Perception.
DOI: 10.5220/0010207502050215
In Proceedings of the 13th International Conference on Agents and Artificial Intelligence (ICAART 2021) - Volume 1, pages 205-215
ISBN: 978-989-758-484-8
Copyright
c
2021 by SCITEPRESS – Science and Technology Publications, Lda. All rights reserved
205
tion on an agent’s ability to survive hazardous envi-
ronments as well as avoid dangerous confrontations.
This present work moves beyond direct perception of
agents to consider intention perception through eval-
uation of indirect physical artifacts, namely, through
the assessment of potentially intended traps. We ask
the question, “Are there cases for which intention
perception provides survival advantages for simu-
lated agents?” While an advantage may be expected,
it is not obvious whether such an advantage would
outweigh potential trade-offs or be measurable over
stochastic noise. We therefore investigate this ques-
tion and find that all three studies arrive at the same
conclusion: having intention perception often leads
to measurable and significant survival advantages for
agents that possess it.
Given that traps intentionally constructed by
agents are far more likely to be lethal than unin-
tended traps (see Section 3.1), being able to differ-
entiate intentionally-constructed traps from randomly
assembled configurations should correlate with higher
survival rates. We thus test if an agent’s ability to
perceive intention indirectly, through the study of
an artifact, continues to provide survival advantages.
Note, in what follows we often refer to both designed
and randomly generated configurations as traps, since
from the gopher’s perspective, every configuration is
a potential trap.
2 RELATED WORK
There has been a wide array of research on spa-
tial awareness and risk assessment (Brown and
Humphrey, 1955; Vorhees and Williams, 2014; Nor-
man et al., 2013; Nogueira et al., 2015; Crawford
and Cacioppo, 2002; Norman et al., 2013). However,
most work involving risk perception focuses on the
psychological reasoning behind an individual’s ac-
tions.
Brown and Humphrey found that spatial learning
is not necessarily bound to a specific location, but
rather is often generalizable since performance can
be facilitated between new and different environments
(Brown and Humphrey, 1955).
Navigation in regards to spatial learning has
been categorized into two distinct types: allocentric
way-finding and egocentric way-finding (Vorhees and
Williams, 2014). The former refers to agents navigat-
ing through distal cues such as visual perception of
landmarks, while the latter refers to agents navigat-
ing through internal cues such as feedback from limb
movement. Our experiment uses a version of allocen-
tric way-finding since the agent observes its environ-
ment without direct contact.
Others have found that humans tend to observe
stimuli that represent danger even when correlation
is weak or they’ve been primed not to (Crawford and
Cacioppo, 2002). Even though attention and aware-
ness have distinct neural signatures (Norman et al.,
2013), our brain is hard-wired to identify stimuli that
can produce negative outcomes.
There is growing empirical and theoretical support
that animals, including humans, use these pessimistic
cognitive biases to judge ambiguous cues as negative
events (Nogueira et al., 2015). Thus, “better-safe-
than-sorry” is an approach often taken in nature, and
forms an appropriate characteristic to model within
our agents.
3 METHODS
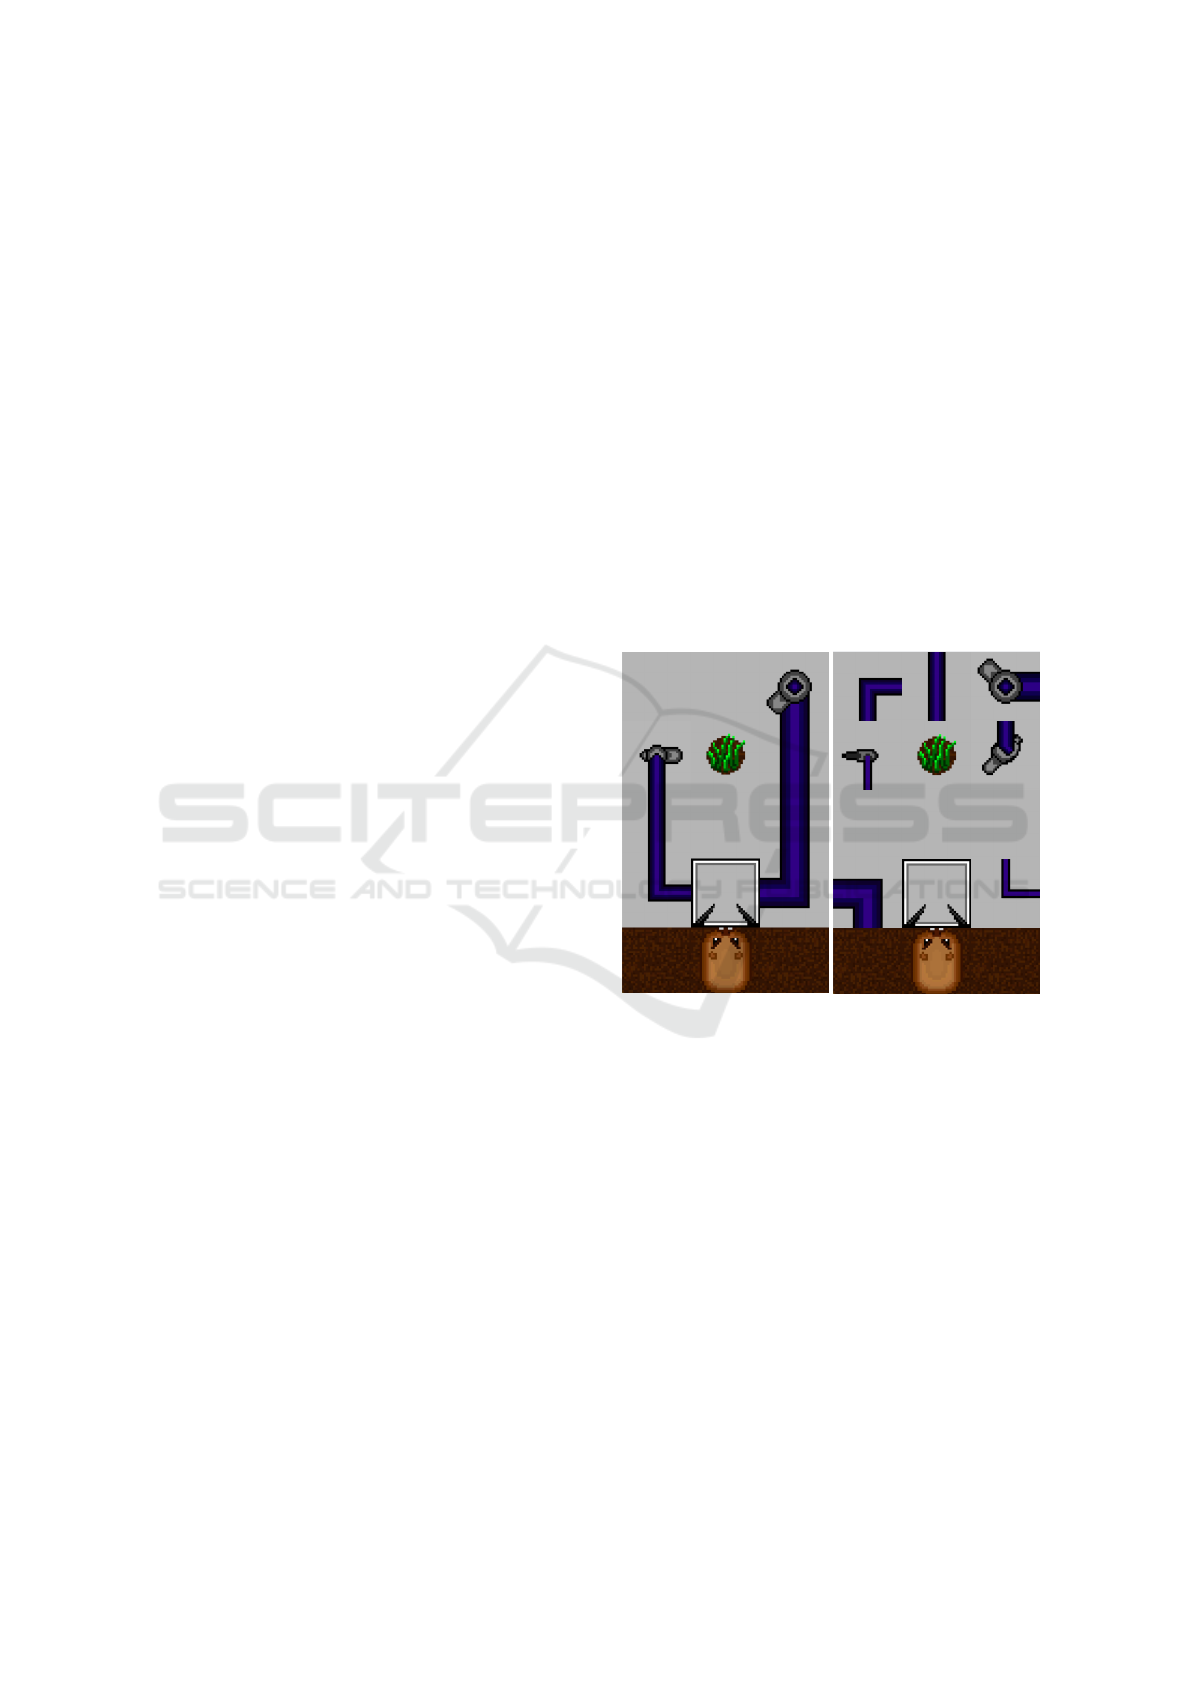
Figure 1: A real trap (left) and a randomly generated trap
(right), in our simulated agent world.
Our goal is to study how survival is impacted when
an agent can detect their environment as “intention-
ally set up.” We represent this situation by having a
simulated gopher agent analyze a series of traps that
each contain food. The simulated gopher then de-
cides, based on a notion of intentionality, if it should
enter and attempt to eat the food.
3.1 The Traps
The traps are designed as grids that hold an assort-
ment of components needed to make the trap func-
tional. The components consist of a door, connect-
ing wires, and a laser gun that we call an “arrow.” If
everything is properly connected, with matching ori-
entations and wire thicknesses, the door will send a
ICAART 2021 - 13th International Conference on Agents and Artificial Intelligence
206
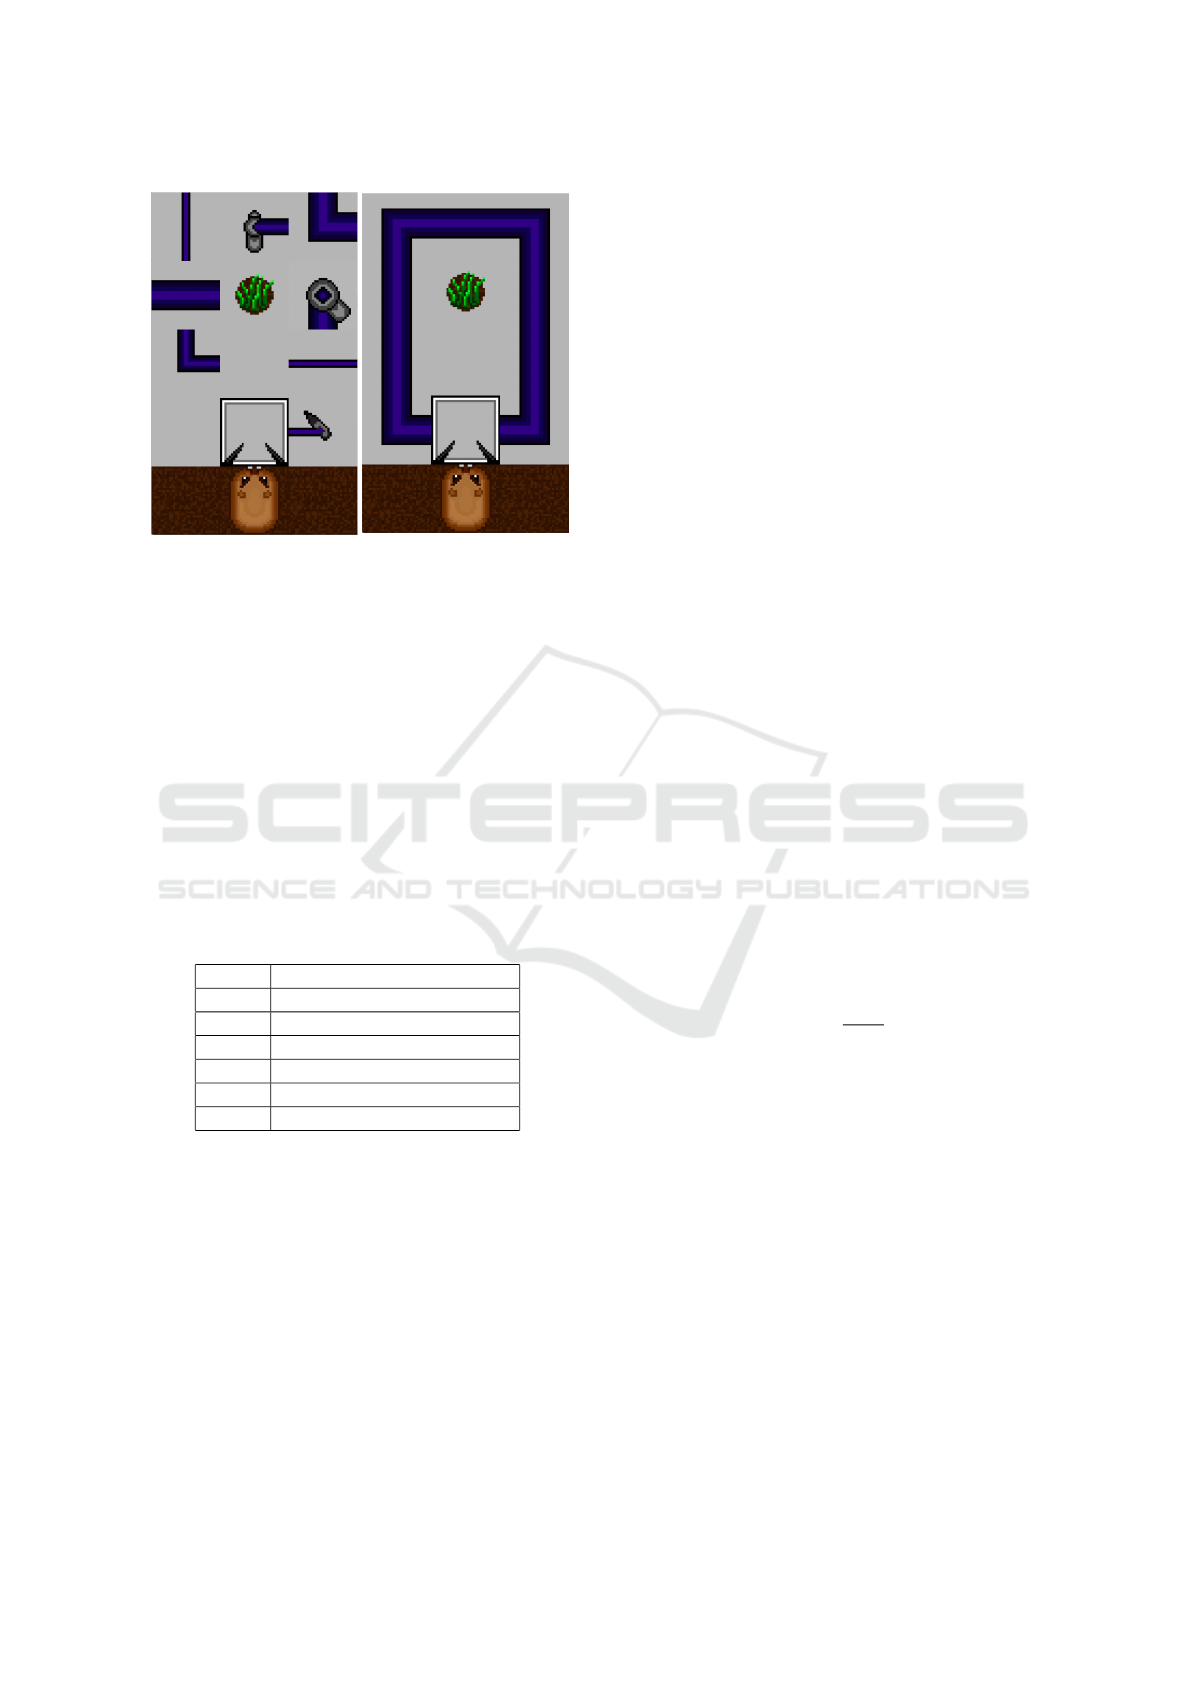
Figure 2: Coherence is correlated with functionality but
does not imply it, as exampled by a functional incoherent
trap (left) and a nonfunctional coherent trap (right).
“pulse” through the wires to the arrow, which should
then fire a laser and “zap” the gopher. Because of
these requirements, a randomly generated trap layout
with pieces haphazardly strewn around is unlikely to
pose a threat. Traps that are designed to harm the go-
pher are much more likely to be “coherent,” meaning
that each wire or arrow cell should be properly con-
nected to another.
In more detail, every trap is composed of a 4x3
grid of “cells.” For each trap, the bottom center cell
is the door, the one above is a floor cell, and the one
above that is food, creating a 3-cell path for the go-
pher.
Table 1: Trap cell piece types.
Type Description
Floor Space for gopher to walk on
Door Trap entryway
Wire Carries pulse signal
Arrow Shoots the projectile
Food Contains food for gopher
Dirt Space between traps
For trap variations, this leaves the remaining 9 cells to
be designated as wire cells, floor cells, or arrow cells
of various thicknesses and rotations.
Considering these variations, there are 4.28 ×10
17
total possible traps, most of which would be nonfunc-
tional. The gopher faces a series of real and random
traps. In general, the randomly-generated traps zap
the gopher with an observed frequency of 6.4%, and
kill the gopher with an observed frequency of 1.9%.
3.2 Gophers
Some simulated gopher agents are given intention
perception—the ability to assess trap coherence. We
conjecture that there is a difference between the co-
herence of intentionally designed traps and randomly
generated traps, and thus equip gophers with “sen-
sors” that measure the coherence of observed traps.
If it is statistically surprising to stumble upon a co-
herent randomly-generated trap, the gopher will reject
the hypothesis that the trap was randomly generated,
conclude it was intended for the gopher, and choose to
not enter the trap. Note that coherence is not the same
as functionality, as illustrated in Figure 2. Gophers
then repeat this process of deciding and entering traps
until the gopher either gets killed, dies from starva-
tion, or survives by making it through fifty traps.
Gophers with intention perception sense if traps
are deliberately harmful using the algorithm de-
scribed in Section 3.3. The intention perception go-
pher will always enter a trap deemed random and will
always avoid a trap deemed intentional unless passing
the trap would cause the gopher to starve.
Gophers without intention perception, which we
call baseline gophers, cannot analyze the traps, and
choose to enter according to the following probabil-
ity:
P
0
e
(H) = P
e
· (1 − H
10
) + H
10
(1)
where P
e
is the default probability of entering, H is
the current level of hunger (ranging from 0 to 1), and
P
0
e
(H) is the adjusted probability of entering. The
number of traps a gopher is allowed to endure without
eating is called the Maximum Fasting Interval (MFI),
and hunger is then given by
H(n) =
n + 1
MFI
(2)
where n is the number of traps the gopher has gone
without food.
If the gopher does enter the trap, a pulse is in-
stantly released from both sides of the door. If there
are coherent connections, this pulse will travel to an
arrow which will fire and possibly hit the gopher. The
strength of the attack depends on the thickness of the
arrow, with wide arrows having the highest probabil-
ity of killing the gopher.
Since the pulse takes time to travel, eating food
for a while may be a disadvantage. Thus, we base
the amount of time a gopher spends eating on its con-
fidence about entering the trap according to the fol-
lowing process. Let the gopher’s probability of enter-
ing given the specific trap t be denoted by P
e,t
. For
baseline gophers, P
e,t
= P
e
, and for intention gophers
P
e,t
= 1 if the trap is concluded random and P
e,t
= 0 if
The Gopher’s Gambit: Survival Advantages of Artifact-based Intention Perception
207
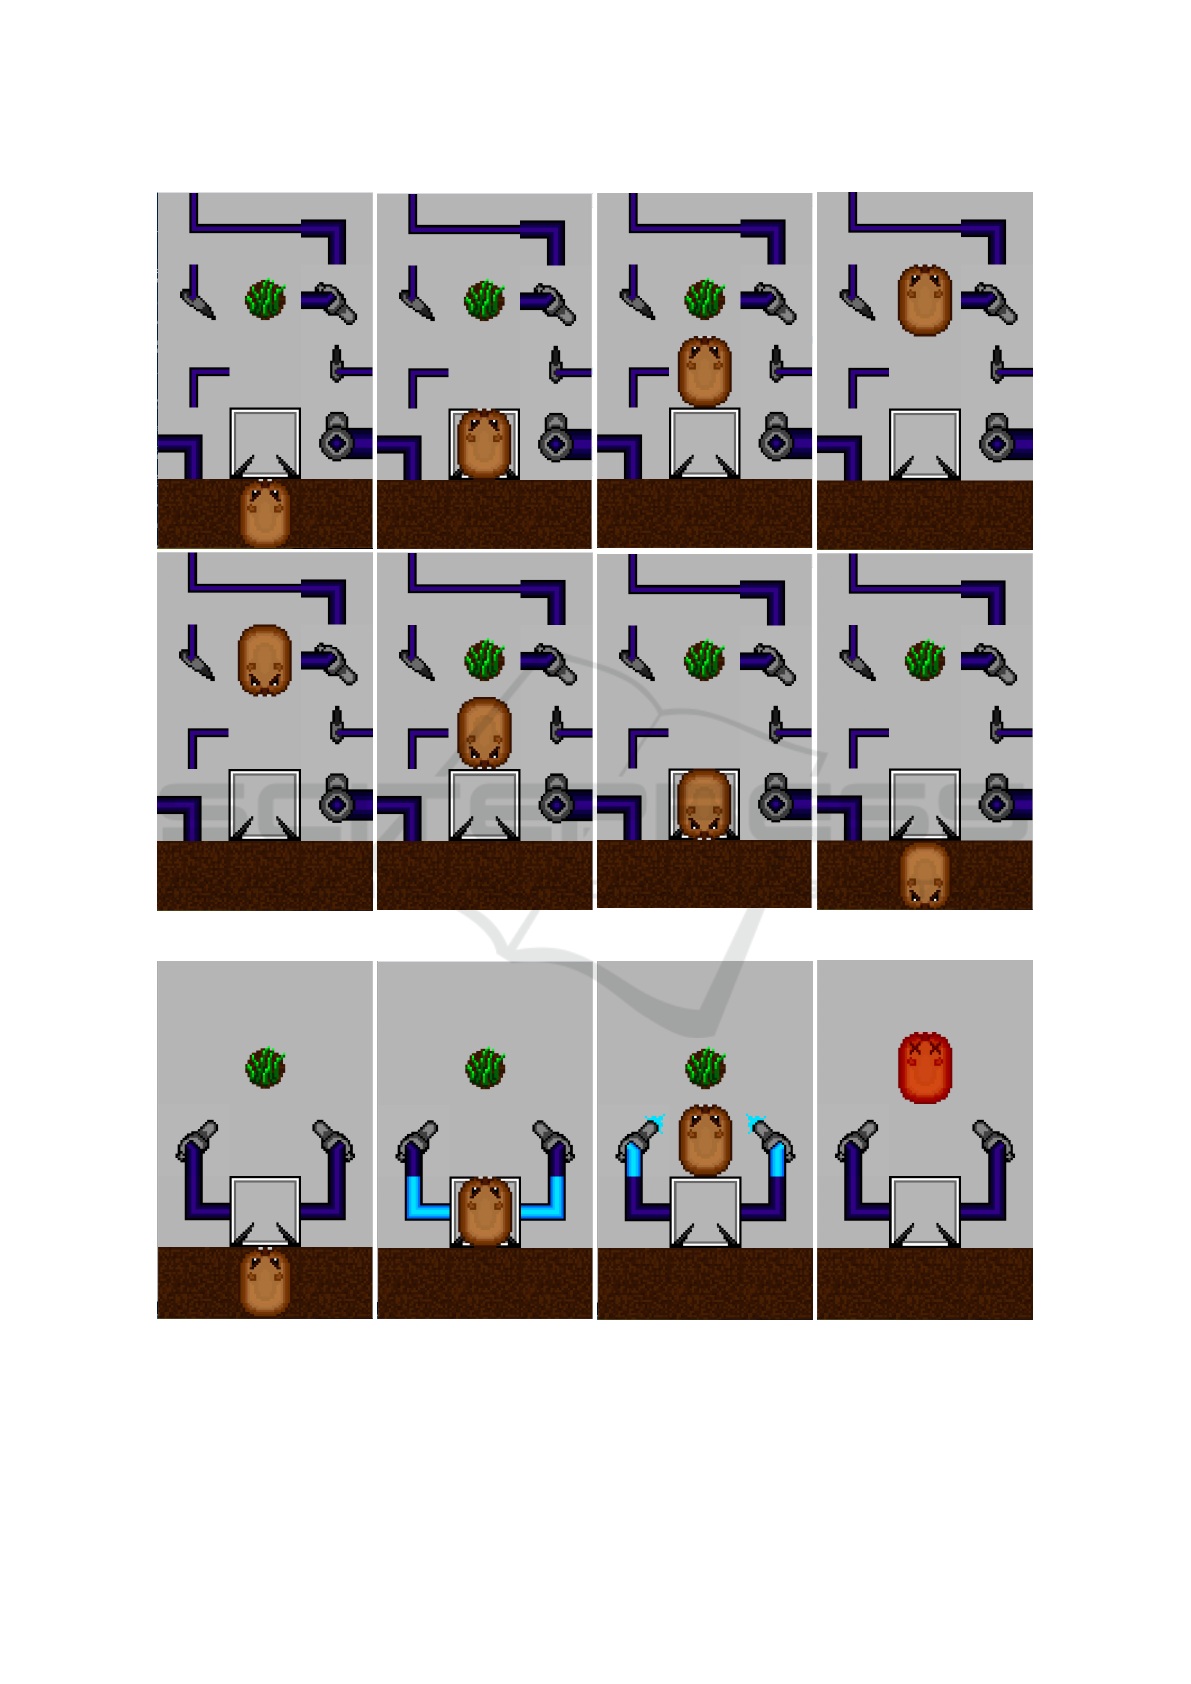
Figure 3: The baseline gopher as it enters a random trap, eats, and then leaves.
Figure 4: The baseline gopher as it enters a real trap and is killed.
concluded real. We define the “ideal time” (T
i
) a go-
pher should spend eating as T
i
= 5P
e,t
. We then cre-
ate “probability bins” corresponding to timers ranging
from 1 to 5 frames and identify the ideal bin (B
i
) as
the lowest bin greater or equal to T
i
. The ideal bin is
assigned 0.6 probability. If 1 < B
i
< 5, then the adja-
ICAART 2021 - 13th International Conference on Agents and Artificial Intelligence
208

cent bins are assigned 0.15 each. Otherwise if B
i
is 1
or 5, then the nearest bin is assigned 0.2 and the sec-
ond nearest 0.1. The remaining two bins are assigned
0.05. We then select the real timer according to these
probabilities.
Table 2: Observed frequency of intention gopher conclud-
ing a real trap, when real traps are sampled with P
r
proba-
bility. The actual proportion of real traps encountered will
often deviate slightly from the expected proportion, P
r
.
P
r
Frequency (rounded)
0.00 0.0000
0.05 0.0499
0.10 0.0995
0.15 0.1488
0.20 0.1997
0.25 0.2490
0.30 0.2989
0.35 0.3495
0.40 0.3990
0.45 0.4485
0.50 0.5018
0.55 0.5511
0.60 0.6005
0.65 0.6494
0.70 0.7013
0.75 0.7514
0.80 0.7997
0.85 0.8501
0.90 0.8984
0.95 0.9489
1.00 1.0000
3.3 The Intention Perception Algorithm
3.3.1 Statistical Model Definition
To simulate indirect intention perception, we use the
functional information model introduced by Hazen et
al. (Hazen et al., 2007) within the statistical hypoth-
esis test framework of Monta
˜
nez (Monta
˜
nez, 2018),
joining other recent studies building on this same
framework (D
´
ıaz-Pach
´
on et al., 2020; Thorvaldsen
and H
¨
ossjer, 2020). The model evaluates the surprise
level (S) of a random configuration variable meeting
or exceeding a given level of function.
Following Monta
˜
nez, we compute the model as
S(x) = −log
2
|X |(1 + ln |X |)
p(x)
F
g
(x)
−1
(3)
where X is the space of possible configurations, p(x)
a probability measure on space X , and F
g
(x) the pro-
portion of configurations that have levels of func-
tion greater than or equal to those of configuration x
(Monta
˜
nez, 2018).
Under the model, F
g
(x) is calculated according to
the following equation:
F
g
(x) = M
g
(x)/|X |, (4)
where |X | is the total number of configurations, and
M
g
(x), the number of configurations with levels of
function greater than or equal to x, is calculated ac-
cording to
M
g
(x) = |{x
0
∈ X : g(x
0
) ≥ g(x)}|, (5)
with g(x) denoting the level of function for x.
3.3.2 Using the Model
In our experiments, we define x as a configuration
(e.g., trap), X as the space of all possible configura-
tions, p(x) = 1/|X |, and g(x) as the number of coher-
ent connections per nonempty cell. We define a coher-
ent connection as an interface between two cells with
identical thickness types, as well as matching end-
points (see Figure 10), while we define a nonempty
cell as either a wire or an arrow cell.
M
g
(x) is then the total number of configurations
with a number of coherent connections per nonempty
cell that is greater than or equal to that of x, the con-
figuration in question.
Successful use of the above statistical model re-
quires computing M
g
(x) for every g(x) observed. To
aid simulation, we pre-compute M
g
(x) for all possible
g(x) values, shown in Table 4 of the Appendix. When
intention perception gophers are presented with an
unknown configuration x, g(x) is computed and used
to retrieve the corresponding pre-calculated M
g
(x)
value from the table. Using Equations 3 and 4 to cal-
culate S(x) and F
g
(x), respectively, yields the surprise
value under the null hypothesis that the unknown con-
figuration was generated by a uniform random pro-
cess.
We reject the null hypothesis that a trap is ran-
domly generated at an α level of 0.0001, correspond-
ing to a surprise value of 13.29 bits. Thus, under the
null hypothesis there is no more than a probability of
0.0001 that a trap with surprise value of 13.29 bits or
greater was randomly generated by the null distribu-
tion process (Monta
˜
nez, 2018). Note that α controls
the false positive rate: empirically verifying that no
more than 100 out of every 1,000,000 randomly gen-
erated traps should achieve surprise values of 13.29
or more bits, we found that only 17 of 20,000,000
traps did so under independent uniform random sam-
pling. This gives an observed rate of fewer than one
per million, well under the maximum of one hundred
per million guaranteed by the bound. The same α
The Gopher’s Gambit: Survival Advantages of Artifact-based Intention Perception
209

threshold achieves a false negative rate of zero when
tested against all sixty-three designed traps in our set.
It should be noted that trap architects did not have co-
herence as a goal when designing their traps, but sim-
ply sought to create traps that reliably killed gophers.
The high degree of coherence in their traps was sim-
ply a side-effect of the design process.
3.4 Cautious Gophers
Gophers with intention perception can be more timid
than gophers without such perception, since the for-
mer will avoid traps that baseline gophers would en-
ter. To rule out the possibility that survival advan-
tages of intention perception are due simply to an in-
crease in caution, we perform an additional experi-
ment. This experiment involves creating a “cautious
gopher,” which uses the same logic as the intention
perception gopher except with an intention algorithm
uncorrelated with the actual design of the traps. In-
stead of basing its conclusion on the trap in front of it,
the cautious gopher randomly determines traps to be
real with the observed frequency that intention per-
ception gophers do. Thus, they are exactly as cau-
tious as intention perception gophers, but do not ben-
efit from intention perception itself.
The observed frequencies in Table 2 were each
calculated from 10,000 independent simulations of in-
tention perception gophers, each of which assessed
between 1 and 50 traps. Note that since the intention
perception gopher’s algorithm for trap assessment is
highly accurate, these observed frequencies quickly
approach the true percentage of real traps.
4 EXPERIMENTAL SETUP
Once a gopher decides to enter a trap, it will move
directly toward the food, eat there for a short while,
and then exit the trap, regardless of whether it is a
baseline, intention perception, or cautious gopher. If
any arrows fire while the gopher is present, the gopher
will immediately leave regardless of whether it was
hit, modeling animal skittishness. If a gopher decides
to exit while still eating, it does not count as having
eaten.
Our experiments are parameterized to control for
the effects of various design choices and to adjust sim-
ulation behavior. P
e
is the default probability of en-
tering a trap and is used in the baseline gopher’s de-
cision algorithm in conjunction with its hunger. P
r
is
the probability that any trap the gopher encounters is
a real trap. P
k,w
, P
k,n
, and P
k,s
are the probabilities of
each arrow thickness type killing a gopher on a suc-
cessful hit. Note that each hit is an independent event
and there is no notion of “health” in this simulation.
Finally, the Maximum Fasting Interval (MFI) is the
number of traps that a gopher can endure without eat-
ing before it starves. A summary of these parameters
and their default values is given below in Table 3.
Table 3: Default values for experiment parameters.
Param. Description Value
P
e
Default prob. of entering trap 0.8
P
r
Prob. of encountering real trap 0.2
P
k,w
Prob. of kill w/ wide arrow 0.45
P
k,n
Prob. of kill w/ normal arrow
2
3
P
k,w
P
k,s
Prob. of kill w/ skinny arrow
1
3
P
k,w
MFI Maximum Fasting Interval 4
For each setting of the parameter values (called a
seed), we ran 10,000 independent trials, averaged the
measured outcomes and computed their confidence
intervals. We present these results next.
5 RESULTS
Figures 5–8 show the gopher’s lifespan and food con-
sumption when varied against multiple factors. As
stated previously, each line represents the mean of
10,000 independent runs per seed, surrounded by
(tight and nearly imperceptible) 95% confidence in-
tervals.
Figure 5 reveals that intention perception provides
an advantage with regard to both survival rate and
food consumption as we vary the baseline gopher’s
probability of entering a trap (P
e
). Across all P
e
val-
ues, the lifespan of a gopher with intention perception
is, on average, double the lifespan of a baseline go-
pher lacking intention perception. Additionally, the
gopher with intention perception has the highest food
consumption despite a gradual incline for the baseline
gopher. However, for high P
e
, baseline gophers have
higher values of normalized food consumption.
We also see that the gopher with intention percep-
tion has a higher survival rate across various projec-
tile strengths. Figure 6 shows a significantly lower
lifespan and food consumption for baseline gophers
lacking intention perception but only a marginal dis-
advantage for normalized food consumption. We fur-
ther observe a positive relationship between maxi-
mum projectile strength and normalized food con-
sumption for both baseline and intention perception
gophers.
Figure 7 indicates that as the Maximum Fasting
Interval increases, so does the disparity between the
ICAART 2021 - 13th International Conference on Agents and Artificial Intelligence
210
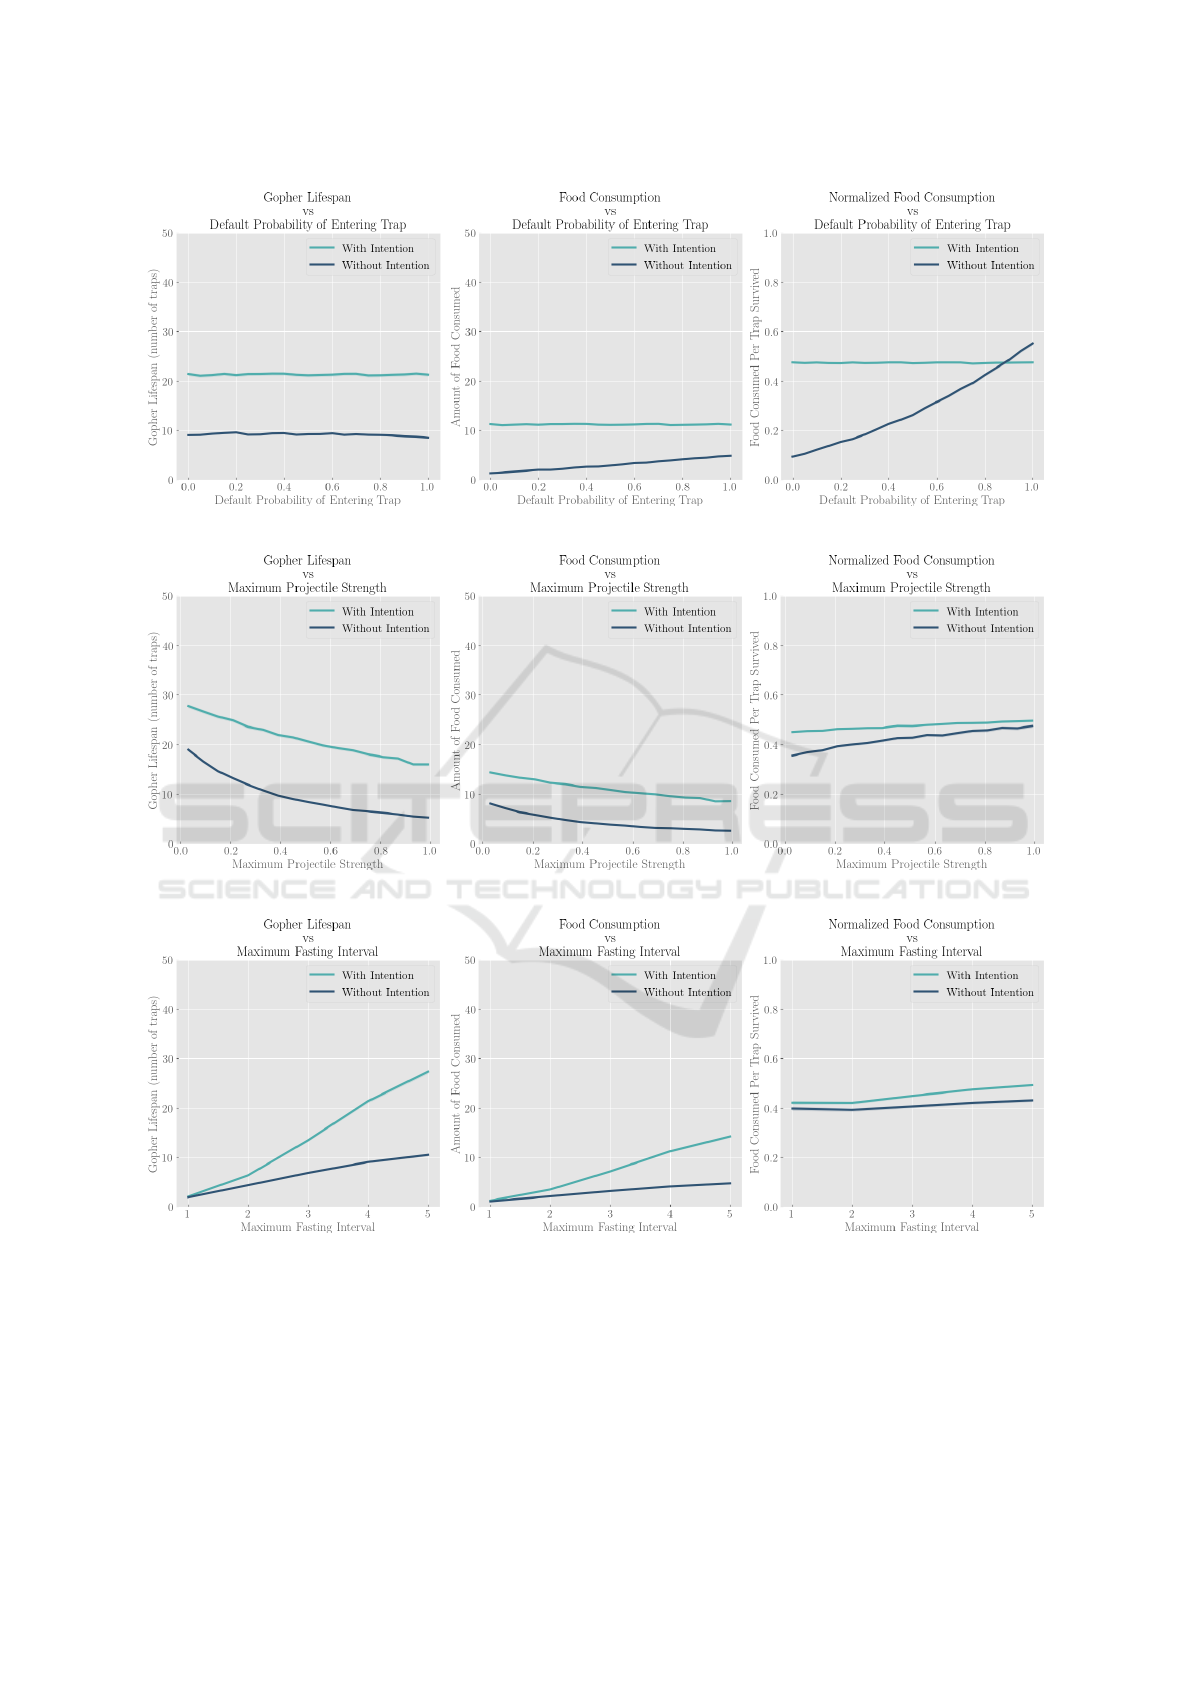
Figure 5: The effect of the default probability of entering a trap (P
e
) on survival and food consumption.
Figure 6: The effect of the maximum projectile strength (P
k,w
) on survival and food consumption.
Figure 7: The effect of the maximum fasting interval (MFI) on survival and food consumption.
performance of gophers with intention perception and
that of gophers without for all three of our metrics.
Gophers with intention perception have a longer
lifespan and higher overall food consumption as the
probability of encountering a real trap (P
r
) increases
as shown in Figure 8. Both the baseline and cau-
tious gophers experience a sharp decline in lifespan
and thus total amount of food as P
r
increases. How-
ever, the baseline gopher lacking intention perception
has the highest normalized food consumption at high
P
r
values.
Figure 8 demonstrates that intention perception
provides a strong survival advantage over mere cau-
tion, as the cautious gopher consistently has a lower
The Gopher’s Gambit: Survival Advantages of Artifact-based Intention Perception
211
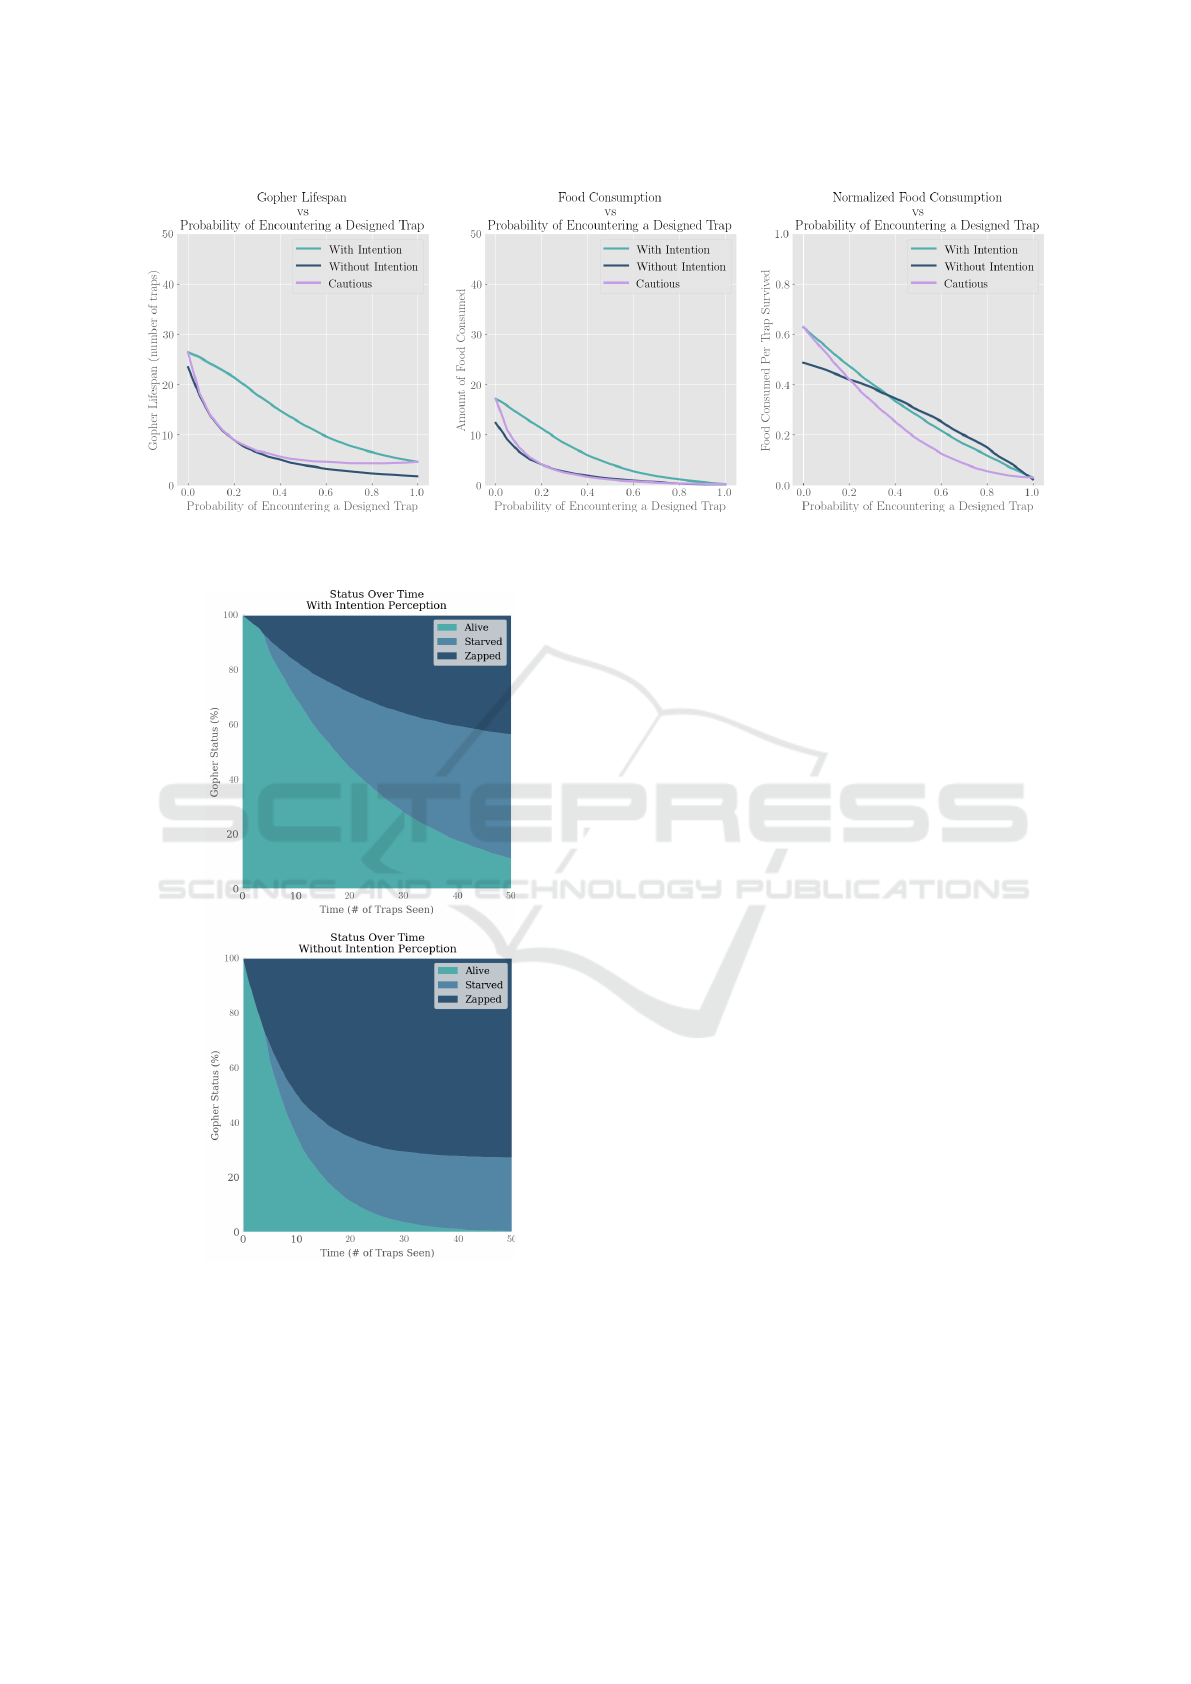
Figure 8: The effect of the probability of encountering a designed trap (P
r
) on survival and food consumption, with the
addition of the cautious gopher.
Figure 9: The effect of intention on the status of gophers
during a trap progression with default parameters.
lifespan, food consumption, and normalized food
consumption across varied P
r
values. However, when
traps are either all random or all real, the behavior
and therefore performance of the cautious and inten-
tion gopher is identical. This is due to the nature of
the cautious gopher, which uses the same algorithm
as intention, except that it blindly considers a trap as
real with the same frequency as an intention gopher.
When P
r
= 1.0 or P
r
= 0.0, this frequency is 1.0 and
0.0, respectively (cf. Table 2), such that the intention
perception and cautious gophers behave identically.
Note that when using our default value of P
r
= 0.2,
this frequency is 0.1997, as shown in Table 2. Since
cautious gophers decide to enter a trap solely based
on this frequency and their hunger, the frequency at
which they enter a trap is about 1 −0.1997 = .8003 ≈
0.8. Also note that, under default values, the base-
line gopher enters traps with about P
e
= 0.8. For this
reason, the cautious gopher behaves like the baseline
gopher when varying the other parameters, and there-
fore has been omitted from the other graphs.
Figure 9 displays the status of gophers with and
without intention perception as they progress through
a simulation of fifty traps. Just over 11% of intention
perception gophers survive all fifty traps while only
0.4% of baseline gophers do, giving intention percep-
tion gophers over 27 times a greater survival rate un-
der default parameters.
Although the percentage of living gophers de-
creases rapidly for both, this rate is much faster for
baseline gophers. Regarding the cause of death, go-
phers with intention perception are far more likely
to starve (45.3% starved compared to 26.9%). Base-
line gophers, on the other hand, are much more likely
to encounter real traps, get zapped and die before
ever starving (72.7% killed by projectiles compared
to 43.6%).
ICAART 2021 - 13th International Conference on Agents and Artificial Intelligence
212

6 DISCUSSION
Our results establish that the gophers with intention
perception consistently live longer than baseline go-
phers. However, gophers with intention perception
are also more likely to die from starvation; by avoid-
ing coherent traps, intention gophers often reach max-
imum hunger. Their maximum hunger then forces
these intention gophers into real traps where they get
zapped and ultimately flee the trap without eating, re-
sulting in their starvation.
When varying different parameters, the gophers
with intention perception consistently outperform the
baseline gophers in both lifespan and overall food
consumption. In addition, the lifespan graph is highly
similar to the food consumption graph for all parame-
ters, likely because gophers that live longer consume
a greater cumulative amount of food.
However, for all parameters except the MFI, the
normalized food consumption of the baseline gopher
eventually either approaches or in a few cases sur-
passes that of the intention perception gopher. Note
that this trend is consistent with the observation that
intention perception gophers are more likely to die
from starvation. In general, this trend is likely be-
cause of two factors: (a) Normalized food consump-
tion is independent of how long the gopher lives, un-
like lifespan and food consumption, and (b) Normal-
ized food consumption favors entering a greater pro-
portion of traps, since passing a trap adds to the num-
ber of traps encountered but not to food consumption.
These two factors are influenced differently by the
different parameters, leading to the varying shape of
each normalized food consumption graph. In particu-
lar, high P
e
and P
r
values both affect the second fac-
tor. For high P
e
values, baseline gophers blindly enter
most traps they encounter since they mainly use the
value of P
e
to decide whether to enter a trap, while in-
tention perception gophers still pass by the more co-
herent ones. The same phenomenon occurs for high
P
r
values. Intention perception gophers enter fewer
traps, while baseline gophers still enter the same pro-
portion since their probability of entering a trap is not
dependent upon P
r
.
The maximum projectile strength, P
k,w
instead in-
fluences the first factor. As P
k,w
increases, both go-
phers are less likely to experience a non-fatal zap and
be forced to leave a trap without eating, a scenario
which lowers the ratio of food per trap. Thus, both
gophers’ normalized food consumption increases as
P
k,w
increases. However, since baseline gophers do
not distinguish between real and random traps, they
are generally zapped more often, such that their nor-
malized food consumption increases more than that
of intention perception gophers.
The MFI is unique in that the normalized food
consumption values for intention perception gophers
and baseline gophers diverge instead of converge. In
fact, this trend is present in all MFI graphs. This is
likely because an intention perception gopher most
frequently dies when its level of hunger forces it to en-
ter a trap. When the MFI increases, intention percep-
tion gophers that reach this level of hunger are more
likely to do so later in the simulation. This means
that there are more data points for the normalized food
consumption ratio, which reduces the negative effect
of fleeing and starving, and leads to the observed pos-
itive trend.
6.1 Survival and Emergence
While our experiments provide evidence for the utility
of intention perception in agents, we do not argue that
this utility alone should lead us to expect the emer-
gence of such traits in nature. While differential sur-
vival advantages can explain the selection of already
existing traits, survival advantages would not neces-
sarily explain a trait’s initial emergence. As Hugo de
Vries astutely related, “Natural selection may explain
the survival of the fittest, but it cannot explain the ar-
rival of the fittest” (De Vries, 1904) and Wagner later
argued, “Natural selection can preserve innovations,
but it cannot create them.” (Wagner, 2014) To claim
that the utility of a feature would explain its emer-
gence is like arguing that the usefulness of a time ma-
chine would explain how a person procured one. In-
stead, the utility of a time machine would only explain
why they would keep one (if they happened to find it),
or why they would endeavor to invent one. Natural se-
lection, in contrast, lacks both foresight and intention.
It cannot retain based on hopes of future reward or
create based on potential future utility. One must thus
take caution when extrapolating from demonstrated
utility to expected emergence. We state plainly that
our demonstration of survival advantages for intention
perception does not, by itself, serve as a justification
for the expected emergence of such traits in nature.
7 CONCLUSIONS
We set out to answer whether there were cases where
intention perception could offer survival advantages
for simulated agents. The goal was to determine
whether an agent with intention perception—the abil-
ity to perceive its environment as “set up” based on
artifacts left behind—has a better chance of surviving
than an agent without intention perception. Designat-
The Gopher’s Gambit: Survival Advantages of Artifact-based Intention Perception
213

ing gophers as our agents and gopher traps as their en-
vironments, we tested whether gophers equipped with
the ability to detect intended configurations would
have measurably higher survival rates than those lack-
ing such an ability. We show that they do, and that
such detection is possible (and highly accurate) when
based on the statistical analysis of artifacts. Further-
more, given that intention perception gophers fare sig-
nificantly better than cautious gophers, this gives ev-
idence of objective “signal” in the configurations in
this context (Silver, 2012), exploitable through statis-
tical methods. Such information could potentially be
leveraged by other artificial decision-making systems.
Through our experiments, we found that not only
were there cases where such perception was helpful,
but that it was helpful in the majority of cases tested.
Our results show that gophers with intention percep-
tion tend to survive significantly longer and consume
more food on average than those without intention
perception. We also saw that the benefit of intention
perception is greater when prioritizing safety over
food, as the gap between intention and baseline go-
phers grows with larger MFI values. These findings
are consistent with other forthcoming work by our re-
search group on intention perception, which show sig-
nificant survival advantages for intention perception
agents in predator-prey scenarios and game-theoretic
adversarial situations.
Our results clearly establish that there exist cases
in which intention perception significantly benefits an
artificial agent’s chances of survival and suggest the
existence of perhaps many more.
ACKNOWLEDGEMENTS
Special thanks to Jerry Liang, Aditya Khant, Kyle
Rong, and Tim Buchheim for assistance in experi-
mental set-up. This research was supported in part
by the National Science Foundation under Grant No.
1950885. Any opinions, findings or conclusions ex-
pressed are the authors’ alone, and do not necessarily
reflect the views of the National Science Foundation.
REFERENCES
Brown, W. L. and Humphrey, C. E. (1955). Generalization
in spatial learning. The American Journal of Psychol-
ogy, 68(3):396–408.
Crawford, L. E. and Cacioppo, J. T. (2002). Learning where
to look for danger: Integrating affective and spatial
information. Psychological Science, 13(5):449–453.
De Vries, H. (1904). Species and Varieties, Their Origin
by Mutation: Lectures Delivered at the University of
California. Open Court Publishing Company.
D
´
ıaz-Pach
´
on, D. A., S
´
aenz, J. P., and Rao, J. S. (2020). Hy-
pothesis Testing with Active Information. Statistics &
Probability Letters, 161:108742.
Hazen, R. M., Griffin, P. L., Carothers, J. M., and Szostak,
J. W. (2007). Functional information and the emer-
gence of biocomplexity. Proceedings of the National
Academy of Sciences, 104(1):8574–8581.
Lowrance, W. W. (1980). The nature of risk. In Societal
risk assessment, pages 5–17. Springer.
Monta
˜
nez, G. D. (2018). A unified model of complex spec-
ified information. BIO-Complexity, 2018(4).
Nogueira, S. S. d. C., Fernandes, I. K., Costa, T. S. O.,
Nogueira-Filho, S. L. G., and Mendl, M. (2015). Does
trapping influence decision-making under ambiguity
in white-lipped peccary (tayassu pecari)? PloS one,
10(6):e0127868.
Norman, L. J., Heywood, C. A., and Kentridge, R. W.
(2013). Object-based attention without awareness.
Psychological Science, 24(6):836–843.
Silver, N. (2012). The Signal and the Noise: Why So Many
Predictions Fail–But Some Don’t. Penguin.
Thorvaldsen, S. and H
¨
ossjer, O. (2020). Using Statistical
Methods to Model the Fine-Tuning of Molecular Ma-
chines and Systems. Journal of Theoretical Biology,
501:110352.
Vorhees, C. V. and Williams, M. T. (2014). Assessing spa-
tial learning and memory in rodents. ILAR journal,
55(2):310–332.
Wagner, A. (2014). Arrival of the Fittest: Solving Evolu-
tion’s Greatest Puzzle. Simon and Schuster.
APPENDIX
A.1 Computing M
g
(X)
To calculate M
g
(x), we use combinatorics together
with numerical computation methods. Note that there
are 9 variable cells in each trap, and thus 10 possible
coherent (well-matched) connections. Computation-
ally, we first loop through every possible combination
of coherent connections. For each combination, we
assign a number to each of the 9 variable cells, de-
noting the number of possible different trap pieces it
can contain if the trap has at least c coherent connec-
tions in total. Some cells are limited in their freedom
to connect to adjacent cells, having required connec-
tions for a specific orientation and component type.
Cells that have no required connections have 91 pos-
sibilities, cells with one required connection have 9,
and cells with two required connections have only 1.
For a visual explanation, see Figure 10.
Let n denote the total number of cells in a config-
uration that are assigned the number 91. For each cell
assigned 91, one out of 91 possible trap pieces for that
ICAART 2021 - 13th International Conference on Agents and Artificial Intelligence
214
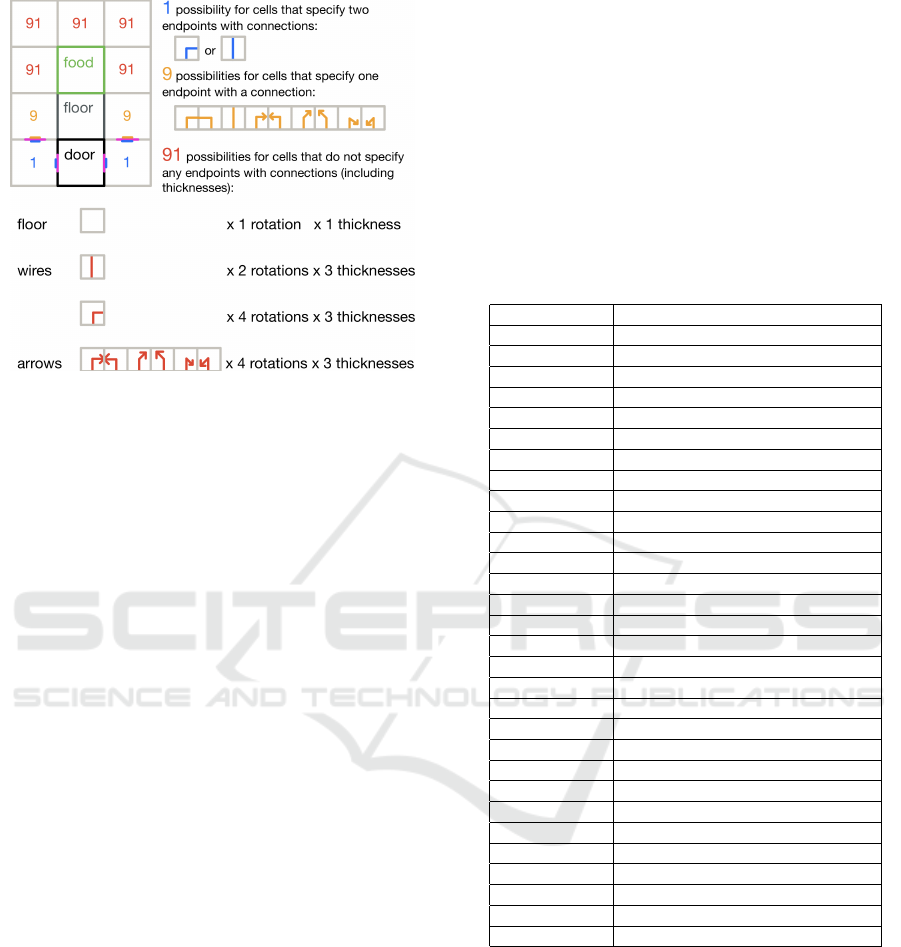
Figure 10: Trap cell possibilities in more detail (pink line
indicates a required connection in this example).
cell is a cell of type floor, while 90 out of 91 possi-
ble trap pieces are either wire or arrow cells. (see
Table 1). We loop through all n
0
∈ {1,..., n} possible
numbers of floor cells.
Also note that for each configuration, any cells
within a group of consecutive coherent connections
must all have the same thickness type. Let the num-
ber of such groups be denoted by γ. For example, the
trap in Figure 10 has two such groups.
Now, let λ(n
0
,b,γ) denote the number of ways to
achieve a configuration with n
0
floor cells, b cells as-
signed the number 9, and γ separate groups of consec-
utive coherent connections. We calculate λ(n
0
,b,γ)
with the following equation:
λ(n
0
,b,γ) =
n
n
0
· 90
n−n
0
· 9
b
· 3
γ
. (6)
Note that the total number of nonfloor (either wire
or arrow) cells in the configuration is t = 9 − n
0
. Af-
ter calculating λ(n
0
,b,γ) for a given n
0
, b, and γ, we
add λ(n
0
,b,γ) to a running total of the number of con-
figurations with at least c connections and exactly t
nonempty cells, denoted Λ(c,t). Note that Λ(c,t)
is the total number of configurations with at least c
connections and exactly t nonempty cells, and thus
does not represent the total number of configurations
with exactly c/t connections per nonempty cell. Let
g(x) = c
x
/t
x
be the connections per nonempty cell of
configuration x and C be the set of all pairs c,t such
that c/t = g(x), where 1 ≤ t ≤ 9. We then calculate
ν(g(x)), the total number of traps with exactly g(x)
connections per nonempty cell:
ν(g(x)) =
∑
c, t∈C
Λ(c,t) − Λ(c + 1,t) (7)
We subtract Λ(c + 1,t) from each Λ(c,t) because
Λ(c + 1,t) is the number of configurations with ex-
actly t nonempty cells that have more than exactly c
connections.
Finally, let G be the set of all possible ratio values
g(x
0
) such that g(x
0
) ≥ g(x). By Equation 5 we obtain,
M
g
(x) =
∑
g(x
0
)∈G
ν(g(x
0
)). (8)
The output of our program is summarized in Table 4.
Table 4: Minimum ratio of connections to nonempty cells
vs. number of permutations.
Ratio, g(x) Number of permutations, M
g
(x)
0.000 = 0 / 9 427929800129788411
0.111 = 1 / 9 354394707075243198
0.125 = 1 / 8 123453353582343198
0.143 = 1 / 7 102193295525793198
0.167 = 1 / 6 101346901331553198
0.200 = 1 / 5 101327843325852198
0.222 = 2 / 9 101327577622082748
0.250 = 1 / 4 18317428758242748
0.286 = 2 / 7 12289201862932377
0.333 = 1 / 3 12103878714006177
0.375 = 3 / 8 1272268411781292
0.400 = 2 / 5 689654429107497
0.429 = 3 / 7 689623309037907
0.444 = 4 / 9 677046035997297
0.500 = 1 / 2 41696845623225
0.556 = 5 / 9 18559182512862
0.571 = 4 / 7 919349539299
0.600 = 3 / 5 616034679885
0.625 = 5 / 8 615255422625
0.667 = 2 / 3 239164711182
0.714 = 5 / 7 6417454230
0.750 = 3 / 4 3925431153
0.778 = 7 / 9 1459677645
0.800 = 4 / 5 26456355
0.833 = 5 / 6 22595625
0.857 = 6 / 7 17067672
0.875 = 7 / 8 10561401
0.889 = 8 / 9 4297158
1.000 = 9 / 9 26730
1.111 = 10 / 9 3
The Gopher’s Gambit: Survival Advantages of Artifact-based Intention Perception
215
