
Adaptation of Architecture Analyses: An IoT Safety and Security Flaw
Assessment Approach
Julia Rauscher and Bernhard Bauer
Software Methodologies for Distributed Systems, University of Augsburg, Universit
¨
atsstraße 6a, 86159 Augsburg, Germany
Keywords:
Safety, Security, Internet of Things, Medical, Wellbeing, By Design, Safety and Security Critical, Architecture
Analysis, Flaw Assessment, Decision Support, Impact Analysis.
Abstract:
Almost everything is connected nowadays or will be in the near future. This trend, called Internet of Things
(IoT) or Cyber Physical Systems (CPS), is able to enhance multiple areas e.g. an individual’s life, complex
industrial processes or common medical treatments. Though, these improvements frequently affect safety and
security critical topics. While this development has many advantages to bring, many challenges arise as well.
Most approaches focus on safety and security analyses or monitoring tools determined to apply during run
time. These approaches do not consider that plenty of the most dangerous vulnerabilities have to be addressed
in the design phase already. Hence, we present an approach to adapt architecture analyses of IoT related areas
to provide a holistic tool to assess flaws and possible countermeasures to design a save and secure CPS system.
1 INTRODUCTION
The Internet of Things (IoT) respectively Cyber Phys-
ical Systems (CPS) are one of the fastest and most
unstoppable developments of our time. This year’s
expected installed 31 billion IoT devices will be more
than doubled in 5 years. (SecurityToday, 2020) This
development could arise positive progress in many
fields. But: The IoT is a security nightmare. (is-
coop, 2017) This is on a major part caused by un-
encrypted traffic of IoT devices. Critical data in IoT
networks are sent unencrypted in 98% of traffic which
enables attackers to listen and exploit the informa-
tion. (Paloalto Networks, 2020) Security is often con-
sidered accordingly, but IoT networks are also full-
grown safety nightmares. The usage of IoT in appli-
cation fields including human beings produces danger
of life-threatening attacks or accidents. As (Paloalto
Networks, 2020) has shown especially the medical
field faces danger through IoT usage. Regarding this
study most of the connected medical image devices
are operating on OSs without update support leading
to threats and hazards that impact the quality of care
or privacy of patients. In addition, malware is spread-
ing easily caused by the combination of IoT and IT
assets which can lead to dangerous situations for pa-
tients as their data are exposed or interpreted falsely.
Despite these dangers IoT offers plenty of benefits
for health care and wellbeing processes, e.g. medi-
cal smart homes for patient monitoring or Ambient
Assisted Living (AAL), connected insulin pumps re-
spectively glucose monitoring or the support of work-
flows in hospitals. As discussed, complex safety and
security activities are highly needed. The lack of up-
date mechanisms is one of the big challenges since
many IoT devices do not have the possibility to be up-
dated. Reasons range from software design decisions
to hardware issues, e.g. implanted devices have to
be flawless before the implantation. Therefore, safety
or security activities at runtime are highly needed but
are not able to catch flaws early enough. Hence, an ar-
chitectural approach is required which faces the vul-
nerabilities early as possible at design time. There
are existing approaches like (Rauscher and Bauer,
2020) to identify flaws in design time. However, af-
ter flaws were identified they have to be assessed to
be prevented. We have developed an architectural
IoT analysis approach to enable the evaluation of de-
sign flaws followed by a design decision support for
diverse countermeasure scenarios. Our approach is
based on existing architectural approaches which will
be adapted for IoT specific needs to cover the special
IoT design challenges. As the medical respectively
wellbeing area is one of the most vulnerable fields
examples featuring safety and security issues of this
topic demonstrate and evaluate our tool.
320
Rauscher, J. and Bauer, B.
Adaptation of Architecture Analyses: An IoT Safety and Security Flaw Assessment Approach.
DOI: 10.5220/0010206303200327
In Proceedings of the 14th International Joint Conference on Biomedical Engineering Systems and Technologies (BIOSTEC 2021) - Volume 5: HEALTHINF, pages 320-327
ISBN: 978-989-758-490-9
Copyright
c
2021 by SCITEPRESS – Science and Technology Publications, Lda. All rights reserved

2 BASICS AND RELATED WORK
Flaw assessment is based on several basics depending
on the used evaluation method. The needed basics
and concepts are presented before our IoT assessment
approach is described.
2.1 Architecture Analyses
Architecture analyses apply in several application
fields like evaluation or validation possibilities, qual-
ity checks or graphical design reviews. As all of these
usage opportunities are located in the design phase to
detect, mitigate, prevent or assess vulnerabilities these
methods come into operation especially in safety or
security critical areas as in the automotive, avionics
and railway industry.
In current state one of the most known and used
method to evaluate failures is FMEA (Failure Mode
and Effects Analysis). It is used as reliability and im-
pact analysis to estimate the consequences of failures.
The usage and combination of FMEA with a contin-
uative impact analysis was presented by (Lohm
¨
uller
et al., 2019). They included FMEA in an analysis cy-
cle to identify potential failures following the deter-
mination of effects of failure events and the need of
countermeasures.
A literature review has shown that there are plenty
of analysis which can be categorized in functional
and technical analysis methods respectively goals.
(Rauscher et al., 2016) The analyses are able to evalu-
ate whole systems but also to analyze single elements,
attributes, dependencies or requirements. This stack
of goals is realized with technical methods range
from Bayesian Belief Networks (BBN), ontology ap-
proaches, weak point analysis to structural methods
with matrices and more. This review has shown that
almost every aspect, including safety and security is-
sues, can be checked during the design phase with
a matching technique depending on the application
field, goal and available data. All these approaches
have in common that they are applied after flaws
are identified or are performed with potential threats.
However, mitigation or prevention of vulnerabilities
can be performed best if there is a possibility to iden-
tify specific threats and accidents as early as possi-
ble. Architectural pattern recognition represents one
technique to identify design flaws. Events can be pre-
vented in the future if architectural patterns are cre-
ated and queried on models. (Rauscher and Bauer,
2020) present this method to recognize patterns for
safety and security incidents. However, this approach
does not cover the continuative assessment of flaws to
allow the performance of countermeasures.
As discussed, architecture analyses are able to im-
prove systems or single networks in several ways de-
pending on their needs. Therefore, if suited adapta-
tions are performed, an analyses transition from tradi-
tional application fields to IoT is highly suggested to
enable the handling of safety and security flaws early.
There are already some approaches trying to perform
architectural methods in IoT. The work of (Wortman
et al., 2017) propose to use AADL to depict security
information in IoT models to avoid poor security de-
sign. However, this approach does also not include
assessment of flaws. Another approach to design se-
cure IoT offer (Lee and Law, 2017). They define IoT-
based pattern to apply design check, but they focus on
software-based design decisions. Hence, existing ap-
proaches to connect IoT and architectural approaches
either don’t focus on design decisions or missing out
the assessment of identified flaws and the following
identification of to-be design scenarios. In addition,
safety is always only considered in the margin.
2.2 Probability Networks
Many architectural approaches which perform anal-
yses use BBN. BBN are networks that represent the
probabilistic conditional dependencies of network el-
ements respectively variables. These networks are
probabilistic, graphical models with directed and
acyclic relations. The included variables have discrete
states and dependencies to ancestor and descendant
elements. The specific conditional probability distri-
bution of model elements are calculated through Con-
ditional Probability Tables (CPT) using mainly fol-
lowing formula from (Neapolitan et al., 2004) which
have to be selected dependent on the analysis goal:
P(B|A) = P(A|B) ∗ P(B)/P(A) (1)
P(AB) = P(A) ∗ P(B) (2)
P(X) =
n
∏
i=1
P(X
i
|ancestor(X
i
)) (3)
Common BBN approaches often are not able to
cover the design requirements of architectural ap-
proaches. Therefore, (Johnson et al., 2006) have de-
veloped a graphical and mathematical representation,
called Extended Influence Diagrams (EID), to per-
form probabilistic inferences for decision and inter-
operability analyses. The approach covers nodes for
utility, chances and decision makers alternatives to
enable the evaluation of current as-is situations and
possible to-be alternatives. This method can be used
to review safety and security design situations and
support the countermeasure decision.
Adaptation of Architecture Analyses: An IoT Safety and Security Flaw Assessment Approach
321
3 FLAW ASSESSMENT CYCLE
As discussed, there are approaches to identify bad de-
sign decisions respectively flaws during design phase
with the aid of design pattern. Our IoT assessment
tool comes into use after this kind of vulnerability
recognition. However, safety and security manage-
ment does not stop after identification as the main
challenge starts with the prevention or mitigation.
Flaws have to be assessed with diverse quality at-
tributes depending on requirements of the system or
guidelines for critical applications. Additionally, mul-
tiple design alternatives are available with sometimes
unpredictable impacts. Therefore, our tool consists of
two coordinated and consecutive parts: impact assess-
ment (Failure Impact Analysis (FIA) and Quantitative
Impact Analysis (QIA)) and decision support (Coun-
termeasure Decision Support Analysis (CDSA) and
Service Interoperability Analysis (SIA)).
Our approach offers a holistic assessment cycle
embedded in the design environment of IoT models.
After identifying a flawed element the cycle of assess-
ment analyses starts with FIA to identify impacts and
provides the basis for QIA. QIA reviews the flawed
path and estimates the financial impacts. Afterwards
the assessment cycle switches to countermeasure de-
cisions. CDSA provides an approach to model pos-
sible to-be alternatives and offers a comparison of
these. Our assessment comes to a final design deci-
sion with SIA which checks interoperability of new
services.
Application possibilities of our cycle are numer-
ous, but if IoT comes into use in medical or wellbeing
areas the severeness of vulnerabilities increases sig-
nificantly. Architectural safety and security critical
flaws of medical IoT networks are, e.g.:
• IoT devices with limited space and energy, as
smart implanted defibrillators, are easy entry
points for attacks if encryption is neglected.
• Devices with low trust level connected directly to
the internet enable manipulation, e.g. smart pill-
boxes changing medication or ordering drugs.
• Low cost sensors are prone to errors which lead
to wrong calculations of measurements, e.g. on
insulin pumps, caused by external circumstances.
• Authentication can be a safety issue if life-saving
functions are blocked by these methods. E.g.
complicated authentication methods before en-
abling an ambulance call.
In the following sections we describe each approach
in detail. To evaluate and discuss the usage in a con-
secutive and consistent way, we use the first named
security flaw as a running example.
3.1 Failure Impact Analysis
The tool cycle starts with an architectural analysis
of failure impacts (FIA). It aims in the recognition
of safety and security impacts including their severe-
ness and highlights required countermeasure points.
FIA starts with vulnerable elements, received by flaw
identification with patterns and anti-patterns. FIA
reviews whole models to enable recognition of is-
sues in even non-obvious parts. Later analyses only
uses model parts labeled as endangered. (Holschke
et al., 2008) monitored effects through usage of enter-
prise architecture models with linkage to BBN. Since
BBN is mostly used to identify causes of events they
focused on possible reasons of accidents or attacks
through a top-down approach. We adapt the basics
of this approach to change it to a bottom-up approach
aiming in calculating likelihood and severeness of im-
pacts of known events. The adaptation process in-
cluded new layers, analysis components, steps and
calculation basics to cover the new desired goals.
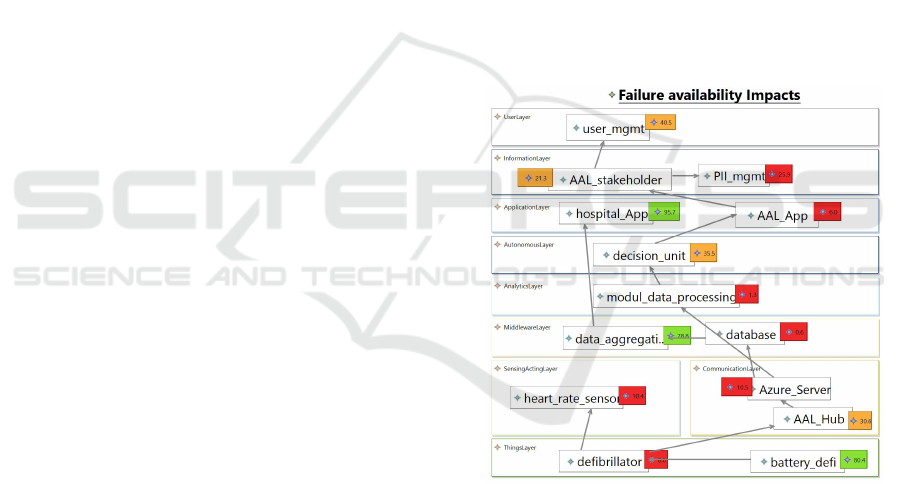
Figure 1: FIA Example.
1) Graphical Representation of IoT Systems:
The representation of an IoT system with a model is
needed to tag the flaw initially and to provide assess-
ment data. It is based on a layered architecture and is
depicted by a modeling editor inspired by ArchiMate
Version 3.0.1 including IoT specific elements.
2) Selection of Assessment Attribute: Impacts
depend on the chosen assessment attributes. Accord-
ingly, different aspects are reviewed as relations differ
dependently. Possible attributes are e.g. availability
or integrity. Only quantifiable attributes are usable
on QIA afterwards, e.g. availability can be quantified
through numbers of Mean Time Between Failures.
HEALTHINF 2021 - 14th International Conference on Health Informatics
322

3) DAG Mapping: To enable the calculations,
the model has to be mapped into a Directed Acyclic
Graph (DAG). DAGs have the same characteristics
as a BBN, but are not limited to BBN typical goals.
Hence, our tool creates a decreased model, only con-
taining relations and elements concerning the assess-
ment attribute. Directed relations present the assess-
ment attribute dependencies. In addition, to make the
DAG mapping suitable for IoT models special uncer-
tainty nodes are introduced which face the possibility
of new unknown devices. These have to be taken into
consideration as they bring new impacts in the model.
4) Discretization of Nodes and Determination
of Probability Tables: Every node in the DAG repre-
sents a variable with value of the assessment attribute.
To enable the usage of probability tables, as required
in BBNs, the values have to be discrete, e.g., discrete
values to assess availability ”Up” and ”Down” time
can be used, i.e. ”Up = 0.3” and ”Down = 0.7”. After
discrete values are set a Probability Table (PT) and a
Joint Probability Table (JPT) per each node are cre-
ated by the tool. A PT represents the current state of
the assessment value, whereas a JPT contains the cal-
culated assessment value of the associated node and
all ancestors. A final joint probability (FJP) of all
nodes is calculated through multiplication of indepen-
dent probabilities. Since the values are independent
without an accident or attack happened, which cause
impacts, the tables contain not conditional values.
5) Simulation of Event: After we defined the cur-
rent state with our tool, we are able to simulate the
identified possible accident or attack in the model. As
the model elements are influenced from now on the
presented BBN formula to calculate the new depen-
dent values of nodes depending on its new ancestors
values are used. Therefore, CPTs are calculated for
every node of the DAG and JPTs respectively FJP
are updated. The final sub-step is the identification
of impacted nodes. Hence, our tool create differen-
tial matrices regarding the changes of assessment val-
ues and highlights the severeness of impacts. Nodes
highlighted in red are endangered and needs further
assessment respectively countermeasures.
To evaluate this part of our IoT tool we used the
introduced case study. Figure 1 shows FIA results of
a wellbeing IoT model. A flaw identification has rec-
ognized a vulnerable heart rate sensor in sensing and
acting layer caused by lack of encryption possibilities.
Hence, a DAG was created with all dependencies of
defibrillator which the sensor is part of. The most im-
portant feature of a defibrillator is guaranteed func-
tionality. Therefore, we chose availability as assess-
ment attribute. After the discretization of all nodes,
the event was simulated and all tables were calculated
or updated. The differential matrices of each element
show their current conditional availability highlighted
depending on the scale. Elements with a low avail-
ability were highlighted red, whereas unharmed ele-
ments with still a high availability stayed green. E.g.
heart rate sensor went down to 10.4%, whereas bat-
tery defi remained high as it was not impacted. As
multiple nodes are endangered and all layers were im-
pacted further assessment is necessary.
3.2 Quantitative Impact Analysis
The financial aspect, mostly of security attacks, have
to be analyzed as often countermeasure decisions de-
pend on possible loss of attacks. QIA aims in quan-
titative assessment of the impacted path discovered
in a previous conducted FIA. Therefore, QIA calcu-
lates costs of services or processes of the impacted
DAG. Through quantity of events, costs per event
and likelihood of occurrence a financial assessment
will be calculated. QIA helps to estimate appropri-
ate efforts to mitigate the impacts, e.g if the occur-
rence is low or the financial impacts are weak coun-
termeasures would cause disproportionate expenses.
Our approach is leaned on (Breu et al., 2008) and
(Innerhofer-Oberperfler and Breu, 2006). They cre-
ated a security enterprise model with a high-level
business security goal and calculate the looses if the
security goal fails. We adapted this approach not even
to make it suitable for IoT but also to enable the as-
sessment of financial impacts of safety events. To
calculate our QIA goals requirements and weights of
nodes or relations are transmitted from FIA results.
1) Impact Graph Generation: Elements which
are not impacted of a flaw don’t have to be checked for
financial effects. To minimize the elements that will
be reviewed, the tool automatically create an impact
graph containing only elements with a negatively dif-
ferential matrix in FIA results. Hence, a flawed path
through the IoT model is created which can be ana-
lyzed for possible costs of events.
2) Setting of Weights and Requirements: To en-
able calculation of costs safety or security require-
ments must be set to identify corresponding risk and
severity. In addition, every leaf node has to be as-
signed a rate of occurrence (RO) depending on its
risk. This can vary from past attacks, happened acci-
dents to average downtime. Leaf nodes are nodes with
direct known safety or security events which cause
further issues. To weigh the graph the contained edges
get assigned values through calculated probabilities of
FIA’s CPTs. This represents the probability relation
of two dependent nodes respectively risks.
Adaptation of Architecture Analyses: An IoT Safety and Security Flaw Assessment Approach
323
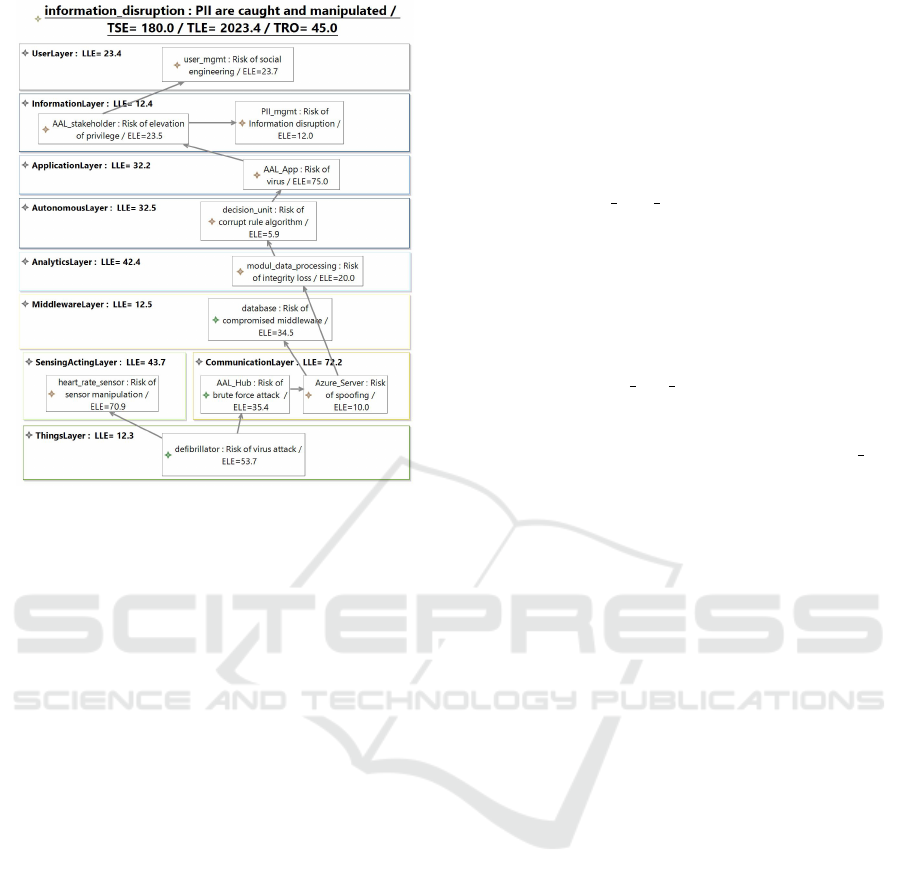
Figure 2: QIA Example.
3) Cost Calculations: The evaluation of costs can
refer to different aspects in the IoT model. Our tool
calculates costs to assess the total model, single layers
and elements. In addition, a severity assessment of the
whole model is estimated. The significance of finan-
cial loss depends on the use case and interpretation of
results is decided individually. Following formula are
used for the quantitative assessment:
ELE = RO ∗ ASLE (4)
LLE = LRO ∗ ASLE (5)
T LE = T RO ∗ ASLE (6)
T SE = Severity ∗ T RO (7)
First, the Element Lost Expectancy (ELE) of a sin-
gle element is calculated by Average Single Loss Ex-
pectancy (ASLE) and RO of an element. Non leaf
nodes calculate their RO through ROs and dependen-
cies of ancestor nodes. ASLE can be defined through
past events, hardware costs, costs per support unit or
other quantitative loss rates. ELE compares impacts
if single components are replaced. Second, our tool
provides assessment of whole layers. Therefore, the
Layered Rate of Occurrence (LRO), is used to de-
fine the Layered Loss Expectancy (LLE) which offers
an evaluation of severely affected layers. Equation 6
provides the formula to calculate the Total Loss Ex-
pectancy (TLE) to assess total costs of the IoT net-
works. This is enabled through a Total Rate of Oc-
currence (TRO) which is determined through multi-
plication of single ROs and relations of nodes respec-
tively propagated flaws. As a last option of QIA the
Total Severity Expectancy (TSE) is provided. Hence,
the severity factor of the system and TRO are used
to offer a review of severity in case of an accident or
attack. This option is especially important for safety
hazards as the severity for human beings is crucial.
A subsequent QIA is shown in figure 2 which an-
alyzed the graph generated from figure 1. Every im-
pacted element presents its risk and calculated ELE
value, e.g. modul data processing faces integrity loss
with an ELE value of 12.0 caused by usage of com-
promised data. On the top, results of TSE (= 180.0),
TLE (= 2023.4) and TRO (= 45.0) can be seen. The
analysis result identified a possible information dis-
ruption which can lead to manipulated personal iden-
tifiable information (PII). This risk can lead to misuse
of an implanted device or transmission of wrong data.
For example, heart rate sensor which was the main
flaw root, faces a sensor data manipulation through
lack of encryption. This causes a lost expectancy of
70.9 and more costs in related elements like AAL Hub
or database since the corrupted sensors have to be re-
placed or a software update has to be enrolled.
3.3 Countermeasure Decision Support
Analysis
After assessing diverse attributes our tool cycle offers
two countermeasure analyses. First, a generic Coun-
termeasure Decision Support Analysis (CDSA) con-
ducts a comparison of current as-is models and pos-
sible to-be model design alternatives. EID is used for
decision support including utility and chance nodes
to evaluate the alternatives. (Sommestad et al., 2008)
and (Johnson et al., 2007) are only a few of plenty ap-
proaches which already successfully used EID for se-
curity analysis. Therefore, we use EID to discover the
best suited countermeasure scenario through calcula-
tion and comparison of utility nodes and regarding
requirement compliances. Depending on available in-
formation or mitigation goals our tool offers a bottom-
up and a top-down type of CDSA. If there is no pre-
defined target value for utility or requirement com-
pliance multiple countermeasure models are set up to
determine the utility from bottom up. Calculated util-
ities can be used to compare alternatives. However,
if there is a pre-defined target value which has to be
reached a top-down approach is conducted. Since this
case requires backwards calculation of countermea-
sures’ CPTs the Bayesian Theorem is used to check
if the scenario can reach the target values of a future
model.
1) Definition of Utility Node: An utility node
represent the main goal of the current analysis by
checking for what is desired. Since our tool fo-
HEALTHINF 2021 - 14th International Conference on Health Informatics
324
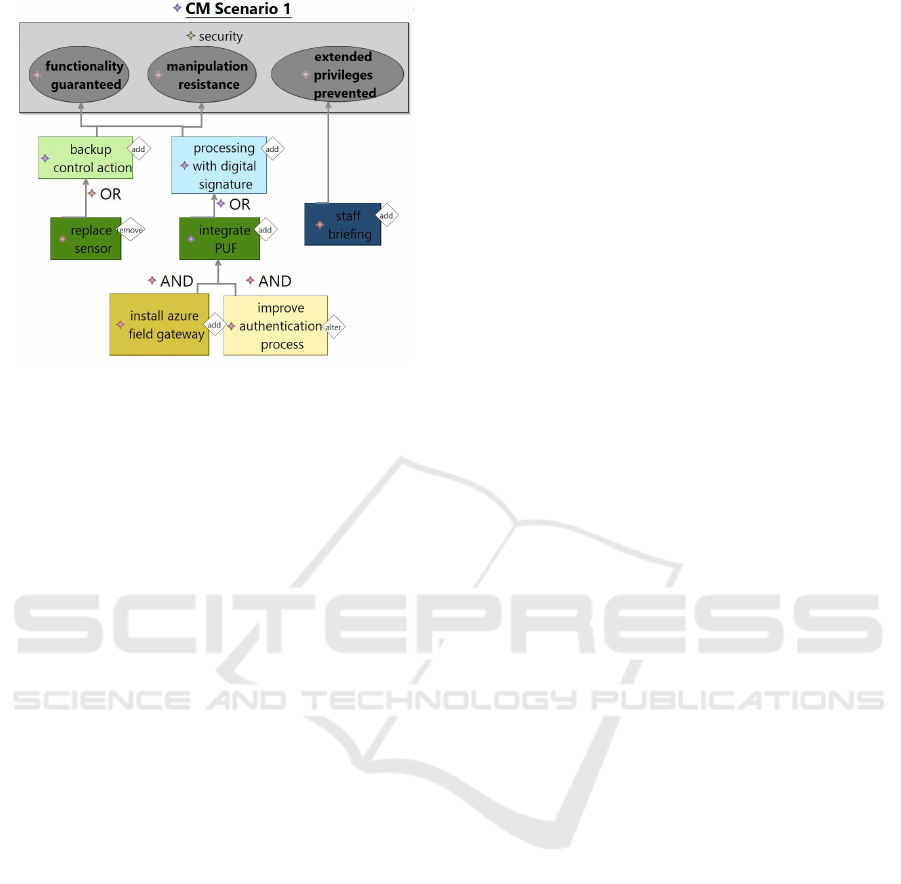
Figure 3: CDSA Example.
cuses on threats and hazards there are utility nodes
for safety and security. As described an utility node
can be set up with a pre-defined value which has to
be reached. Utility nodes are depicted as rectangle
located on the top of the model. In addition, a sce-
nario must be set up which defines different domains
of control.
2) Scenario Specifications: Chance nodes de-
scribe possible countermeasures with type of ”Al-
ter”, ”Add” or ”Remove” and are connected through
”AND” or ”OR” relations depending whether all or
just one countermeasure has to be fulfilled. Chance
nodes are depicted through squares with colors re-
garding their concerning layer. Requirement chance
nodes are located in the utility node representing di-
rect requirements which lead to fulfillment of de-
fined utility and are calculated through their con-
nected chance nodes’ conditional probabilities.
3) Determine CPTs of Chance Nodes: Ev-
ery countermeasure influences its associated require-
ments. To determine the conditional probability of
their requirements’ impacts, their connected counter-
measure ancestors respectively descendants have to
be calculated. Therefore, every chance node has a
PT, JPT and CPT for each requirement they influ-
ence. The fulfillment of requirements must be defined
through discretized values, e.g. ”True” or ”False”.
Again formula of BBN are used to calculate the tables
depending whether they are dependent or independent
specified by their connection type.
4) Calculations by Target Type: Depending
whether a top-down or bottom-up approach is re-
quired our tool calculates the scenario status. If
there is no utility target value JPTs of requirement
nodes are determined by conditional probabilities of
related nodes to analyze how the planned countermea-
sures influences the requirements and utility. In case
of different importance of requirements they can be
weighted to determine utility. In case an utility target
value was set our tool analyses with aid of Bayesian
Theorem and tables whether the planned countermea-
sures are able to reach this goal.
5) Design Decision Support: CDSA offers the
possibility to compare diverse modeled and calcu-
lated countermeasure scenarios. For decision making
the scenarios can compare the reached utility respec-
tively which countermeasures come closest to the tar-
get value. In addition, countermeasures regarding a
specific layer can be checked and single components
can be monitored and changed as the tool automati-
cally determine the impacts of changes.
Figure 3 gives an insight of a performing CDSA to
mitigate the flaw of the known defibrillator risk. Since
this challenge focuses on an attack security was set
as utility node with three requirements: functional-
ity guaranteed, manipulation resistance and extended
privileges prevented. A set of multiple countermea-
sures in diverse layers are defined since the impacts
and risks of FIA and QIA were located in several
layers. For example, to guarantee functionality it is
planned to replace the sensor and set up a backup con-
trol action to install a sensor with encryption possibil-
ities and to ensure the control of captured elements.
In addition, to mitigate the risk of attacks caused by
extended privileges the staff will be briefed. Further-
more, field gateways, better authentication processes,
PUFs and digital signatures are planned against ma-
nipulation. The next step in this analysis will be the
calculation of scenario utility and comparison of other
scenarios to chose the most suited for the use case.
3.4 Service Interoperability Analysis
Once countermeasures are chosen the detailed tech-
nical impacts of these have to be checked. There-
fore, we developed a tool component for a Service In-
teroperability Analysis (SIA) to review new services
of countermeasures and previous existing services to
prevent new vulnerabilities caused by faulty cooper-
ation or mismatching properties. If services are not
able to work together flawlessly, especially in criti-
cal areas, the safety or security for human beings or
systems can not be guaranteed. (Ullberg et al., 2008)
have already proven to use EIDs to review service in-
teroperability in models by checking the quality of
services. Since they mainly focused on run time in-
teroperability our tool adapted the definitions to make
it suitable for IoT design assessment. Design time in-
teroperability consists of three subcategories: Single
services, pairs of services and power set of services:
Adaptation of Architecture Analyses: An IoT Safety and Security Flaw Assessment Approach
325
• Single services: Quality Assessment of indepen-
dent service blocks.
• Pairs of services: Pair-wise comparison of inter-
operability, e.g. data exchange.
• Power set of services: Weighted assessment of all
quality of service attributes must be included.
Quality of services is received through the assess-
ment attributes availability, correctness, verifiabil-
ity and communication compatibility of all contain-
ing services. IoT is mainly based on services of dif-
ferent types regarding autonomous, connected things.
Hence, our tool provides a possibility to model special
service nodes connected with chance nodes to enable
the assessment of IoT specific challenges.
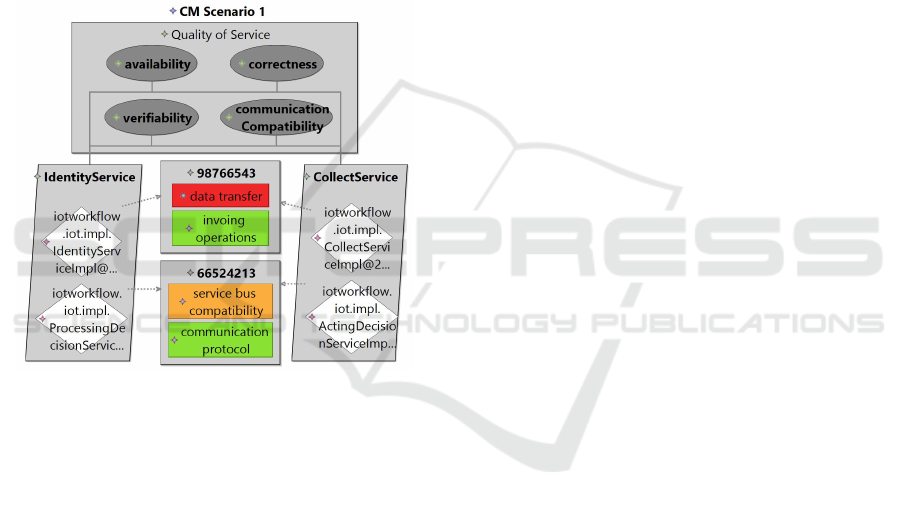
Figure 4: SIA Example.
1) Set Up Original Service Model: Services
which are part of the as-is IoT model before apply-
ing countermeasures have to be transformed into a
SIA model to enable comparison of new services af-
terwards. As SIA models are based on EIDs they
contain an utility node to assess the quality of sce-
nario. Hence, in SIA models the utility node rep-
resent the power set of services that depends on the
described four assessment attributes which are rep-
resented by chance nodes. Under utility and chance
nodes the service nodes are located. They are clus-
tered regarding their service type which are connected
to chance nodes to determine their probable interoper-
ability. Therefore, each service has four assigned PTs
for every assessment attribute with discrete probabil-
ity values of fulfillment, e.g. ”Communication com-
patibility - True = 0.8”.
2) Define Countermeasure Service Model:
Countermeasures can add new services, replace pre-
vious ones or alter some service details. Hence, the
defined original service model has to be adapted into
countermeasure scenarios with new service informa-
tion. In addition, weights of assessment attributes
must be updated and new PTs must be specified.
3) Determine Design Time Interoperability: As
soon as a service is added, changed or removed the
tool automatically determines the new design time in-
teroperability status. First, associated PTs of single
services use independent probability formula to cal-
culate the quality values of assessment attributes re-
spectively chance nodes. Second, our tool creates the
final utility value and evaluate the power set of ser-
vices with quality of service weights. As a last step,
pairs of service interoperability is determined. Hence,
our tool pair up every possible combination of service
pairs, depending on their connections, and create au-
tomatically interoperability interface matrices to com-
pare multiple features to evaluate their cooperation
possibilities. These features can range from used pro-
tocols, provided operations to service bus compatibil-
ity. The matrices are highlighted with a scale regard-
ing their results.
4) Design Decision Support: After the original
service model and possible countermeasure service
scenarios are depicted and analyzed the assigned de-
sign time interoperability can be evaluated to support
the design decision. As described three subcategories
have to be considered to compare the flawed original
scenario with mitigation opportunities. We compare
all SIA models on finale utility values, single service
value changes and provides a report of interface ma-
trices to estimate the status of service pairs. If quality
of service values have increased by countermeasures
the new defined services are suitable. SIA completes
the tool cycle to assess and redesign a flawed IoT
model to mitigate vulnerabilities in the design phase.
Our running example conducts a SIA to check for
interoperability of new planned countermeasure ser-
vices. Figure 4 views a small excerpt of the corre-
sponding countermeasure scenario of figure 3. Two
collect services and two identity services of sensor
respectively database access processes are contained
and compared in their pairs of service matrices for
characteristics like communication protocol or invok-
ing operations. An incompatibility of data transfer
was identified between a sensor collect service and
a database identity service as different data transfer
methods are planned. In addition, the service bus
compatibility of another service pair must examined
more closely. The SIA model calculates next the qual-
ity of service of power set which enables the compar-
ison with other SIA models. Afterwards a final coun-
termeasure design decision can be made and the iden-
tified flaw can be prevented.
HEALTHINF 2021 - 14th International Conference on Health Informatics
326

Our case study performed the whole assessment
cycle to assess and mitigate a flaw. FIA identified the
direct and indirect impacts of a vulnerable defibrilla-
tor and the weak points which come along in diverse
layers. Since different angles should be observed as
well, we calculated the financial expenses of possi-
ble attacks which enables the estimation of needed
resources. To mitigate the impacts we evaluated se-
curity requirements and quality of services to find the
most suitable countermeasures which are not causing
other issues. The to-be scenario alternative with the
highest increase of assessment attribute values will be
chosen to be the new flawless as-is model.
4 CONCLUSION AND FURTHER
WORK
In this paper we discussed the need of architecture
analyses in the medical IoT safety and security man-
agement. As not every IoT component can be updated
harmful design decision have to be detected in the
design phase. However, the detection is not enough.
The consequences of a flaw have to be assessed and
prevented to be able to chose the required counter-
measures. Hence, we presented our holistic IoT tool
approach to support assessment of safety or security
related design flaws in IoT models and the following
evaluation of possible countermeasure options. We
explained the connections and workflow of included
analyses and their steps in detail. Our approach con-
tains two analyses to identify and assess possible
impacts of an accident or attack to estimate techni-
cal and quantitative consequences for single compo-
nents respectively the whole system. After getting an
overview of the meaning of a flaw, our approach pro-
vides an analysis to design and compare countermea-
sure scenarios through the calculation of conditional
probability of single countermeasures and their im-
pact. As a last component our workflow supports the
countermeasure decision with an analysis addressing
new services which come along with countermeasures
to check the interoperability. Through these approach
we were able to develop a holistic safety and security
architecture analysis approach for IoT systems to in-
crease the handling of complex systems to create save
and secure IoT environments for human beings.
ACKNOWLEDGMENT
Electronic Component and Systems for European
Leadership (ECSEL) supported the development of
this approach within the project CPS4EU (Grant
Agreement Number 826276).
REFERENCES
Breu, R., Innerhofer-Oberperfler, F., and Yautsiukhin, A.
(2008). Quantitative Assessment of Enterprise Secu-
rity System. 2008 3rd ARES, pages 921–928.
Holschke, O., N
¨
arman, P., and Flores, W. R. (2008). Using
Enterprise Architecture Models and Bayesian Belief
Networks for Failure Impact Analysis. ICSOC, pages
339–350.
Innerhofer-Oberperfler, F. and Breu, R. (2006). Using
an Enterprise Architecture for IT Risk Management.
ISSA, pages 1–12.
iscoop (2017). Internet of Things – the Complete Online
Guide to the IoT. https://www.i-scoop.eu/internet-of-
things-guide/. Accessed on: 25.08.2020.
Johnson, P., Lagerstr
¨
om, R., N
¨
arman, P., and Simonsson,
M. (2006). Extended Influence Diagrams for Enter-
prise Architecture Analysis. EDOC, pages 3–12.
Johnson, P., Lagerstr
¨
om, R., N
¨
arman, P., and Simonsson,
M. (2007). Enterprise Architecture Analysis with
Extended Influence Diagrams. Information Systems
Frontiers, 9(2-3):163–180.
Lee, W.-T. and Law, P.-J. (2017). A Case Study in applying
Security Design Patterns for IoT- Software System. In
ICASI, pages 1162–1165. IEEE.
Lohm
¨
uller, P., Rauscher, J., and Bauer, B. (2019). Failure
and Change Impact Analysis for Safety-Critical Sys-
tems: Applied on a Medical Use Case. BMSD.
Neapolitan, R. E. et al. (2004). Learning Bayesian Net-
works, volume 38. Pearson Prentice Hall Upper Sad-
dle River, NJ.
Paloalto Networks (2020). IoT Threat Report.
https://bit.ly/2H0kecc. Accessed on 25.08.2020.
Rauscher, J. and Bauer, B. (2020). Design Optimization
of IoT Models: Structured Safety and Security Flaw
Identification. In BMSD, pages 84–102. Springer.
Rauscher, J., Langermeier, M., and Bauer, B. (2016).
Characteristics of Enterprise Architecture Analyses.
BMSD, pages 104–113.
SecurityToday (2020). The IoT Rundown For 2020: Stats,
Risks, and Solutions. https://bit.ly/33i6rFg. Accessed
on 25.08.2020.
Sommestad, T., Ekstedt, M., and Johnson, P. (2008). Com-
bining Defense Graphs and Enterprise Architecture
Models for Security Analysis. EDOC, pages 349–355.
Ullberg, J., Lagerstr
¨
om, R., and Johnson, P. (2008). A
Framework for Service Interoperability Analysis us-
ing Enterprise Architecture Models. SCC, 2:99–107.
Wortman, P. A., Tehranipoor, F., Karimian, N., and Chandy,
J. A. (2017). Proposing a Modeling Framework for
Minimizing Security Vulnerabilities in IoT Systems in
the Healthcare Domain. ITAB, pages 185–188.
Adaptation of Architecture Analyses: An IoT Safety and Security Flaw Assessment Approach
327
