
Fish Gelatin-based Films for Gas Sensing
Inês Pimentel Moreira
a
, Laura Sato, Cláudia Alves, Susana Palma
b
and Ana Cecília Roque
c
UCIBIO, Chemistry Department, School of Science and Technology, NOVA University of Lisbon,
2829-516 Caparica, Portugal
Keywords: Gas-sensing, Electronic Nose, Fish Gelatin, Liquid Crystal, Ionic Liquid, Volatile Organic Compounds.
Abstract: Electronic noses (e-noses) mimic the complex biological olfactory system, usually including an array of gas
sensors to act as the olfactory receptors and a trained computer with signal-processing and pattern recognition
tools as the brain. In this work, a new stimuli-responsive material is shown, consisting of self-assembled
droplets of liquid crystal and ionic liquid stabilised within a fish gelatin matrix. These materials change their
opto/electrical properties upon contact with volatile organic compounds (VOCs). By using an in-house
developed e-nose, these new gas-sensing films yield characteristic optical signals for VOCs from different
chemical classes. A support vector machine classifier was implemented based on 12 features of the signals.
The results show that the films are excellent identifying hydrocarbon VOCs (toluene, heptane and hexane)
(95% accuracy) but lower performance was found to other VOCs, resulting in an overall 60.4% accuracy.
Even though they are not reusable, these sustainable gas-sensing films are stable throughout time and
reproducible, opening several opportunities for future optoelectronic devices and artificial olfaction systems.
1 INTRODUCTION
Artificial olfaction mimics the sense of smell in
humans, which relies on complex systems that start
with a binding event of odours to an array of olfactory
receptors and finish with signal processing and
pattern recognition by the brain (Gutiérrez &
Horrillo, 2014). Electronic noses (e-noses) have
arisen as an emerging tool for the detection of odours
– sets of volatile organic compounds (VOCs) – in
several areas such as medicine, food quality or
environment (Barbosa et al., 2018). Since the
traditionally used gas sensors in e-noses are metal
oxide semiconductors or synthetic conducting
polymers and both present several drawbacks
(Baldwin et al., 2011), there is a continuous search for
alternative gas-sensing materials.
Liquid crystals (LC) are unique responsive
materials due to their ability to change molecular
order as a response to chemical and physical stimuli,
with a long history in a variety of technologies. The
design of LC materials that respond to targeted
biological or chemical species has more recently
a
https://orcid.org/0000-0002-5502-091X
b
https://orcid.org/0000-0002-1851-8110
c
https://orcid.org/0000-0002-4586-3024
arisen for gas sensing technologies (Carlton et al.,
2013). This is made possible due to the high
sensitivity of the LC ordering to molecular-level
events, endowing the amplification of small changes
into optical responses (Shibaev et al., 2015).
Ionic liquids (IL) have also been explored as gas
sensing materials, due to their negligible vapour
pressure and high ionic conductivity (IC) (Rehman &
Zeng, 2015). They are known as designer solvents, as
the choice of the cation and anion endows some
tunability from a large structural and functional
diversity (Meng et al., 2012). Different ionic liquids
have been combined with gelatin to make ionogels as
chemiresistive gas sensors (Carvalho et al., 2014).
More recently, a new type of gas sensors composed
of self-assembled droplets of LC and IL stabilised
within a polymeric matrix has been reported (Hussain
et al., 2017). These materials change their
opto/electrical properties in the presence of VOCs
and can be used as sensing elements in an e-nose. A
study on LC/IL droplets embedded in bovine gelatin
showed that such materials can accurately classify 11
distinct VOCs (Esteves et al., 2019). Gelatin is
achieved from the partial hydrolysis of the fibrous
32
Moreira, I., Sato, L., Alves, C., Palma, S. and Roque, A.
Fish Gelatin-based Films for Gas Sensing.
DOI: 10.5220/0010206200320039
In Proceedings of the 14th International Joint Conference on Biomedical Engineering Systems and Technologies (BIOSTEC 2021) - Volume 1: BIODEVICES, pages 32-39
ISBN: 978-989-758-490-9
Copyright
c
2021 by SCITEPRESS – Science and Technology Publications, Lda. All rights reserved

protein collagen, the principal constituent of animal
skin, bone and connective tissue (Karim & Bhat,
2009). Gelatin from marine sources has gained
importance as it appeared as an alternative to bovine
gelatin, associated with the Bovine Spongiform
Encephalopathy crisis. Additionally, the demand for
non-bovine and non-porcine gelatin has increased due
to religious and social reasons (Sarbon et al., 2013).
This work shows that fish gelatin is a valuable
alternative to bovine gelatin for the immobilization of
LC/IL droplets, yielding stable gas-sensing materials
with VOC-classification ability. Such information
will be beneficial for the future assembly of an array
of materials for sensing complex mixtures of VOCs.
2 MATERIALS & METHODS
2.1 Materials
Gelatin from cold water fish skin was purchased from
Sigma-Aldrich. The ionic liquid 1-Butyl-3-
methylimidazolium dicyanamide [BMIM][DCA]
(>98%) was purchased from IoLiTec (Germany) and
the liquid crystal 4-Cyano-4'-pentylbiphenyl (5CB)
(> 98%) from TCI Chemicals (Belgium). The
solvents dichloromethane and hexane were purchased
from VWR, ethanol (purity ≥ 99.8%) was purchased
from Sigma-Aldrich. Acetonitrile (purity ≥ 99.9%),
chloroform, diethyl ether (HPLC grade), ethyl
acetate, heptane, methanol (HPLC grade) and toluene
were supplied by Fisher Scientific. Acetone (purity ≥
99.5%) was purchased from Honeywell and
isopropanol (purity ≥ 99.5%) from ROTH. All
solvents were used as purchased.
2.2 Film Preparation
[BMIM][DCA], 5CB, fish gelatin and milliQ water
were mixed as previously reported (Hussain et al.,
2017). Gelatin from bovine skin (gel strength ≈ 225
g; Bloom Type B) normally presents a larger
concentration of proline and hydroxyproline when
compared to gelatin from cold water fish (Karim &
Bhat, 2009), which is key for the stabilisation
mechanism (Joly-Duhamel et al., 2002). The amount
added of each reagent was adjusted to ensure proper
gelification.
The gel was then spreaded into films on top of
microscope glass slides with an automatic film
applicator (TQC, The Netherlands) and a quadruplex
VF2168-043 at a defined 15 μm thickness. Three
negative control gels (C0, C1 and C2) were prepared
by following the same procedure described above, but
without including in the composition the ionic liquid
and the liquid crystal (C0), the liquid crystal (C1), or
the ionic liquid (C2). In the absence of ionic liquid,
its volume was replaced by milliQ water. All films
were left to stand at room temperature for at least 24
hours before used.
2.3 Film Characterisation
The films were observed using an optical microscope
(Axio Observer.Z1/7) (Zeiss, Germany) coupled with
an Axiocam 503 color camera. For the morphological
characterisation of LC droplets, images were taken
under crossed (90°) polarizers, giving polarised
optical microscopy (POM) images. ZEN 2.3 software
(ZEN Pro) was used for microscope control, image
acquisition and processing. The magnification used
was 100x.
A black mask with a 5 mm circular hole was
applied on the bottom of each glass slide where the
film was spreaded, in order to delimit the analysis
area to VOC exposure. The panoramic polarised
optical microscopy (POM) image of this circular area
was taken using the Tiles module within ZEN
software and a 100x magnification. The mean grey
value of the circular area was then measured using the
tools of FIJI distribution (Schindelin et al., 2012) of
ImageJ open software (Rueden et al., 2017) by
calculating the grey pixels over the total pixels in the
grey-scale image.
2.4 Acquisition of Optical Signals upon
Exposure to VOCs
3 selected films were placed in an in-house built e-
nose, to study their optical responses to VOC
exposure. The 3 different controls were also added,
filling the 6-sensor slot chamber. Within these films,
the LC molecular rearrangement upon exposure of
sensing films to VOCs is what gives an optical signal
(Figure 1a), which can thus be analysed. As
previously described in (Hussain et al., 2017; Santos
et al., 2019), each slot in the detection system is
composed of a light emitting diode (LED), a sensing
film sandwiched between two crossed polarizers
(90°) and a light dependent resistor (LDR) (which is
represented in Figure 1b). The LC is arranged in
radial configuration when the films are exposed to air
(Figure 1c), being able to rotate the plane of the
incident polarized light, which allows it to cross the
second polarizer and reach the LDR (Figure 1b).
However, the presence of a VOC analyte triggers the
LC configuration to switch from radial to isotropic
Fish Gelatin-based Films for Gas Sensing
33
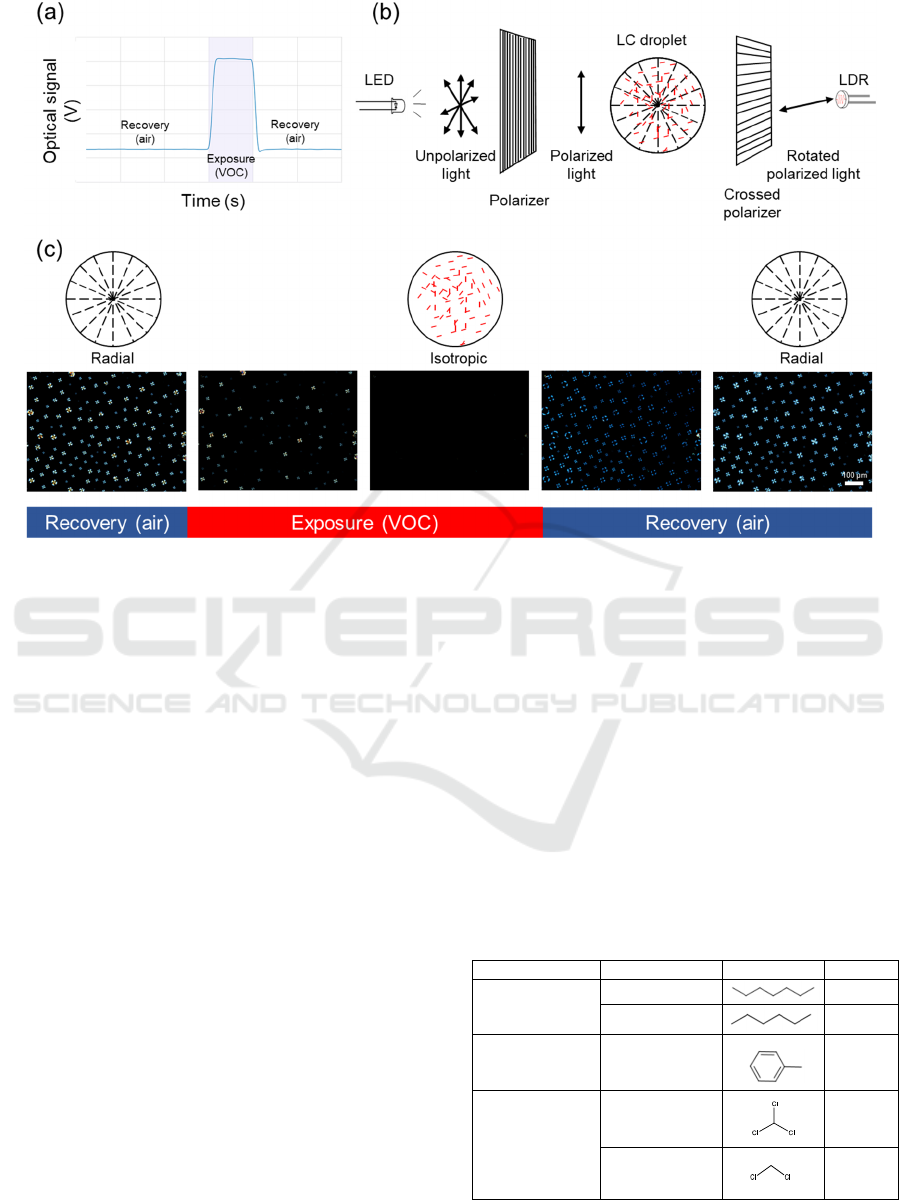
Figure 1: (a) Characteristic optical signal given by the e-nose (upon exposure to hexane, in the example); (b) Schematic
representation of the e-nose working mode, with the film sandwiched between two crossed polarizers: the signal is thus given
by the inability of light to cross the second crossed polarizer when radial-to-isotropic configuration change happens. (c)
Schematic representation of liquid crystal/ionic liquid droplets with LC in radial and isotropic configuration, together with
polarised optical microscopy images of the hybrid gels recorded in real time upon exposure to hexane and recovery with air.
(Figure 1c), losing the ability to rotate the plane of
polarized light and thus hindering light to pass
through the second polarizer (Figure 1b).
The sensing films were exposed to a sequence set
of 11 VOCs, with increased polarity (see partition
coefficients in Table 1). Before starting any
experiment, pure solvents were heated up to 37°C for
15 min in a sample vial to ensure headspace
saturation. The resulting gas in the headspace was
then pumped through the sensors, using cycles of 5
seconds exposure to VOC and 15 seconds recovery
with air, for a total of 15 minutes (45 sequential
cycles). Optical signals were acquired at a sampling
rate of 90 Hz. Different batches of films were
produced so that triplicates were analysed and
reproducibility was assured. Each film was
characterised before and after the exposure to the set
of 11 VOCs.
2.4.1 Signal Processing and Automatic
VOC Classification
Twelve features were extracted from each cycle of the
optical signals and used as input variables to build an
automatic VOC classifier algorithm based on support
Vector Machine (SVM). The chosen features were
the ones that gave the best performances, as reported
in (Santos et al., 2019). Data from three film batches
were used to train, so that the SVM classifier could
learn a VOC classification model. Testing was
performed using data from a fourth film batch. The
normalised classification results were presented in a
confusion matrix (in percentage).
Table 1: Set of 11 VOCs, divided by chemical class,
chemical structure and partition coefficient (logP)
properties.
Chemical class VOC Structure logP
Hydrocarbons
Heptane
3.42
Hexane
3
Aromatic
hydrocarbons
Toluene
2.52
Chlorinated
Chloroform
1.67
Dichloromethane
1.01
BIODEVICES 2021 - 14th International Conference on Biomedical Electronics and Devices
34
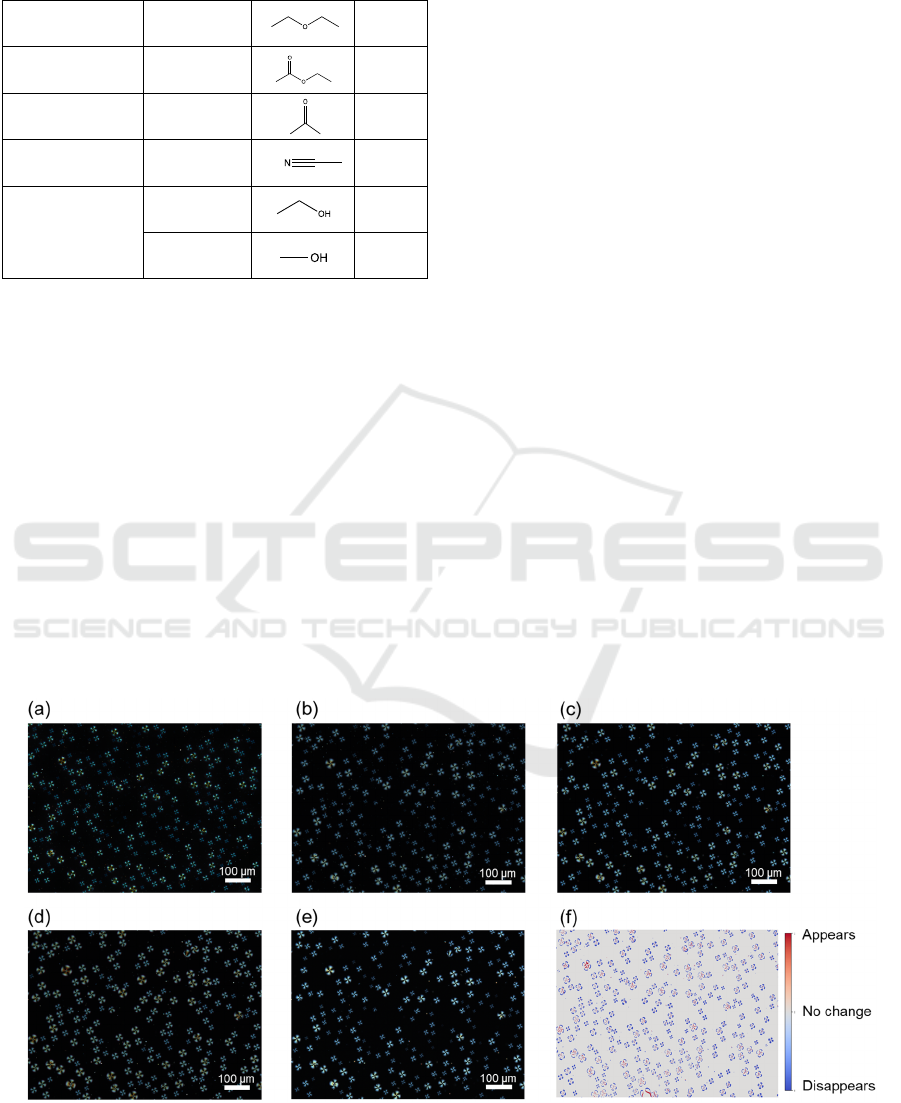
Table 1: Set of 11 VOCs, divided by chemical class,
chemical structure and partition coefficient (logP)
properties (cont.).
Ethers Diethyl ether 0.76
Esters Ethyl acetate
0.29
Ketones Acetone
0.2
Nitrogenated Acetonitrile
0.17
Alcohols
Ethanol
0.07
Methanol
-0.27
3 RESULTS AND DISCUSSION
3.1 Characterisation of Gas-sensing
Films
Before using the films made of 5CB/[BMIM][DCA]
droplets immobilised in a fish gelatin matrix as
sensors for pure VOCs, they were characterised and
studied.
3.1.1 Stability over Time
Polarised optical microscopy (POM) was used to
characterise the morphology of the sensing films. The
images show that it was possible to produce
homogeneous films filled with LC/IL droplets
stabilised by the fish gelatin matrix (Figure 2a). The
film stability over time was studied by following the
same region of interest (ROI) throughout 1 month of
storage at room temperature and humidity, taking
images each 1 week (Figure 2a-e).
The first and last images were aligned with
ImageJ, overlapped and then processed by a Python
script to compare them (Figure 2f). It was possible to
conclude that the films were stable after 1 month of
storage, since they remained in the same positions,
with just some fluctuations in size due to humidity
changes in the laboratory. However, in the following
works, the relative humidity must be controlled to
~50% until all film characterisation and smelling
experiments are complete.
3.1.2 Optically Active Area and Signal
Baseline
The delimited circular area of all the gas-sensing
films was analysed in the polarised optical
microscope before using them as sensors for the set
of 11 VOCs. There can be some variability in the
spreading of the gel, producing slightly different
films within the same gel batch. The presence of less
droplets within the specific 5 mm circular area (as for
the film in Figure 3a compared with the one in Figure
3c) lowers the brightness of the film (as calculated via
the mean grey value). A lower mean grey value
results in higher baselines of the optical signals
(Figure 3d), which will consequently affect the signal
amplitude.
Figure 2: Polarised optical microscopy images of the same area 1 day (a), 1 week (b), 2 weeks (c), 3 weeks (d), 4 weeks (e)
after preparation; Changes on the morphology between images a and e, after superimposed and analysed (f).
Fish Gelatin-based Films for Gas Sensing
35
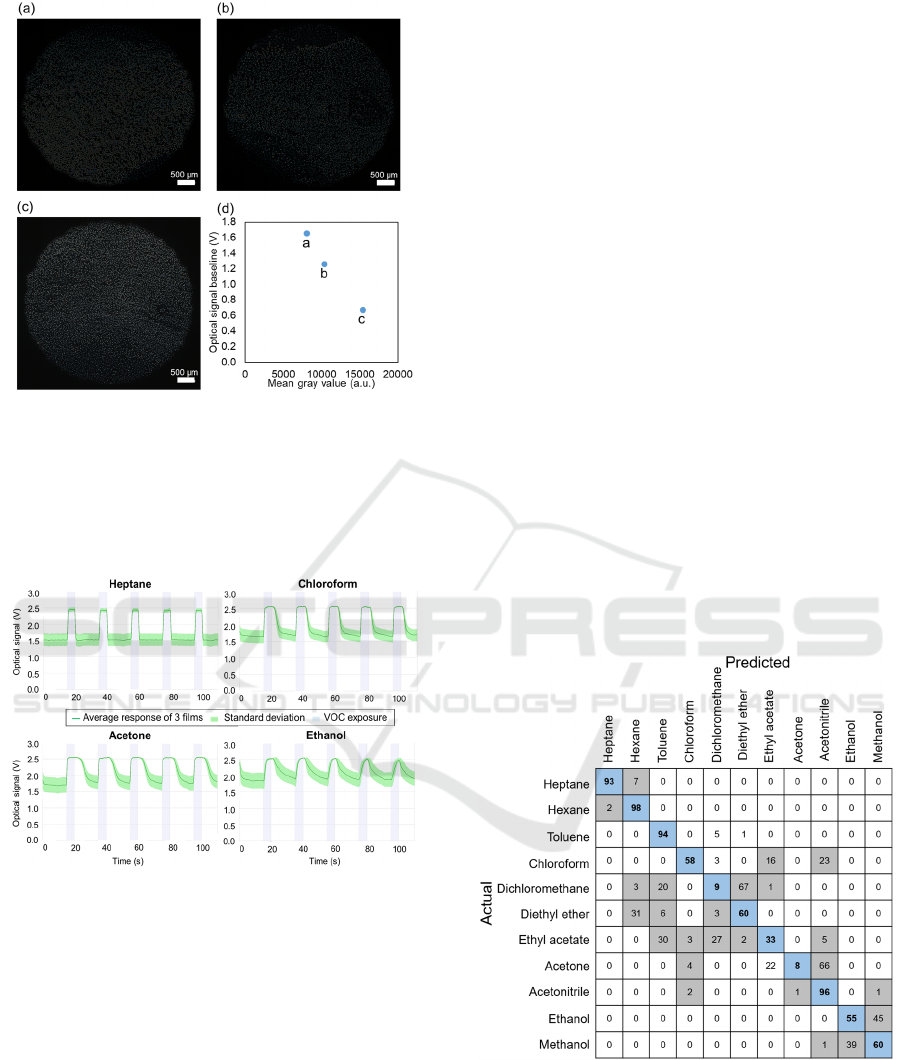
Figure 3: Panoramic polarised optical microscopy image of
the whole optically-active area from 3 exposed films of the
same batch (a-c); Correlation between the optical signal
baseline observed from the e-nose and the mean grey value
taken from the tiles above (d).
3.2 Optical Response to VOCs
Figure 4: Optical signals (average of 3 films from the same
batch of fish-gelatin based gas-sensing films) upon
exposure to heptane, chloroform, acetone and ethanol.
The standard deviation of the average optical signal
(Figure 4) achieved from the 3 films of the same batch
is due to the slight variability in their optically active
area, as previously mentioned (Figure 3). The optical
signals differ for different VOCs (Figure 4), which is
explained by the affinity each of them presents to the
liquid crystal, ionic liquid or even biopolymeric
matrix that compose the films. When using these fish
gelatin-based sensors, the characteristic signal of
heptane is rectangular-shaped, which probably occurs
due to a quick effect on the LC configuration change
upon exposure and consecutive recovery with air. On
the other hand, ethanol follows more of a triangular-
type shape, which can be related to the tendency of its
hydroxyl group (Table 1) to interact with the fish
gelatin by hydrogen bonds. This competitive action
of ethanol into droplets or into the biopolymeric
matrix can possibly explain the slower radial-to-
isotropic and isotropic-to-radial configuration
change, or the destabilisation of the droplets within
the matrix.
3.2.1 VOC Signature and Discrimination
Ability
The characteristic signals yielded by the films allow
for a distinction ability between VOC chemical
classes. The performance of the classifier (accuracy
% of VOC prediction) is presented in a confusion
matrix (Figure 5), whereby the blue squares in the
diagonal represent the correct VOC prediction
accuracies. The best performance is achieved when
predicting the most hydrophobic volatiles
(hydrocarbons), distinguishing satisfactorily the
heptane, hexane and toluene (95% accuracy, in
average). In what concerns the alcohols, the accuracy
is not as high but it confuses only between ethanol
and methanol, which suggests that it is a good
prediction tool for VOC chemical classes.
Figure 5: Confusion matrix for implemented SVM-based
classifier, representing the prediction results for 11 VOCs.
The blue squares represent the frequency of correct
predictions and grey squares the frequency of failed
predictions (in percentage). Overall accuracy represents the
average frequency of correct predictions, calculated as the
average of the blue squares: 60.36%.
BIODEVICES 2021 - 14th International Conference on Biomedical Electronics and Devices
36
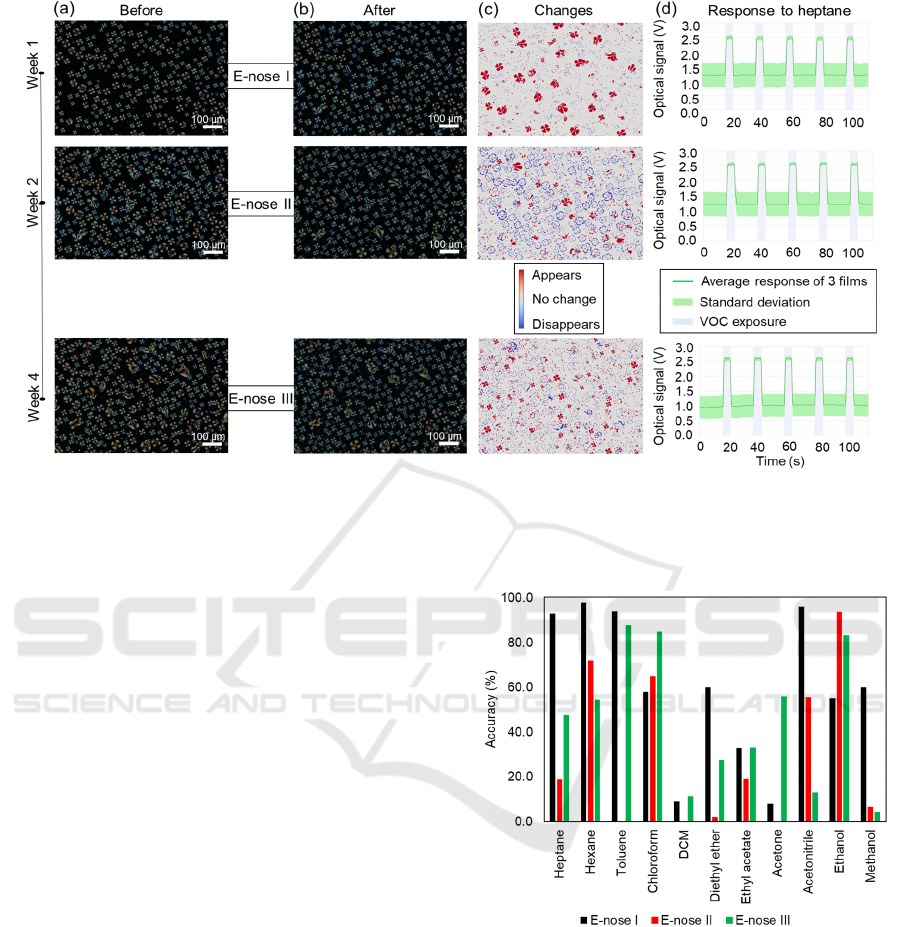
Figure 6: Polarised optical microscopy images of the same region of interest before (a) and after (b) each e-nose experiment
performed with the same gas-sensing films 1 week after preparation, 2 weeks and 4 weeks. (c) Changes on the morphology
between images a and b and for each e-nose experiment, after superimposed and analysed. (d) Response to heptane for each
of the e-nose experiments.
3.3 Sensor Reusability Capability
The same films were then exposed to the sequence of
11 VOCs a second and a third time, in order to study
their reusability capability. The sensing experiments
on the same films were performed 1, 2 and 4 weeks
after their production (Figure 6). When analysing the
morphological images of the same ROI before
(Figure 6a) and after (Figure 6b) each e-nose
experiment, it is obvious that the largest change
happened after the first experiment in the first week
(Figure 6c). Even though the response to heptane is
quite similar in all the repeated e-nose experiments
(Figure 6d), the films change after exposed for the
first time and do not show the exact same optical
signals. In fact, the overall prediction accuracy
decreased from 60.36 to 30.3% on the second
exposure, but it increased again to 45.8% on the third
exposure. Since the prediction accuracies upon a
second and third exposure vary, they cannot be
reused, unless the environmental conditions are
tightly controlled to avoid droplet swelling and
shrinking with relative humidity fluctuations. Even
though the sensing films, in general, decreased their
ability to discriminate VOCs upon sequential
exposures, chloroform, e.g., showed an increasing
accuracy prediction (Figure 7). In fact, some VOCs
as chloroform or ethanol overtook the 60% accuracy
threshold after being exposed more than once.
Figure 7: Comparison of prediction accuracies, for each
VOC, between the first e-nose experiment (as in the
presented confusion matrix) and the 2 next e-nose
experiments. Overall accuracies are 60.36, 30.3% and
45.8% for the first, second and third exposures.
3.4 Control Films
The response to VOCs given when using control
films as sensors was significantly different from the
gas-sensing films shown before (Figure 4). Controls
C0 and C1 do not possess liquid crystal in their
composition and thus do not respond to any VOCs,
presenting a flat line signal (only one example shown
Fish Gelatin-based Films for Gas Sensing
37
for heptane in Figure 8a). The POM images using
crossed polarizers show nothing (Figure 8b-c),
exactly due to the absence of birefringence. The
control C2, which has liquid crystal but no ionic
liquid, is able to detect the presence of VOCs, even
though its response is weaker than the ones given
from the gas-sensing films (Figure 4). The former
presents a lower signal amplitude than the latter, since
the C2 is overall darker (Figure 8d) than the sample
with ionic liquid (Figure 2a). This lower mean grey
value results in a higher baseline, as explored in
Figure 3d. The absence of ionic liquid results in
droplets that are not based on radial LC configuration,
which gives this control some variability and non-
consistency. It is possible to conclude from the
confusion matrix (not shown) that this control has
lower prediction accuracy than the samples with ionic
liquid. The importance of the ionic liquid, as well as
all the other components in the gas-sensing films, is
reiterated for the optical mechanism optimisation of
the e-nose.
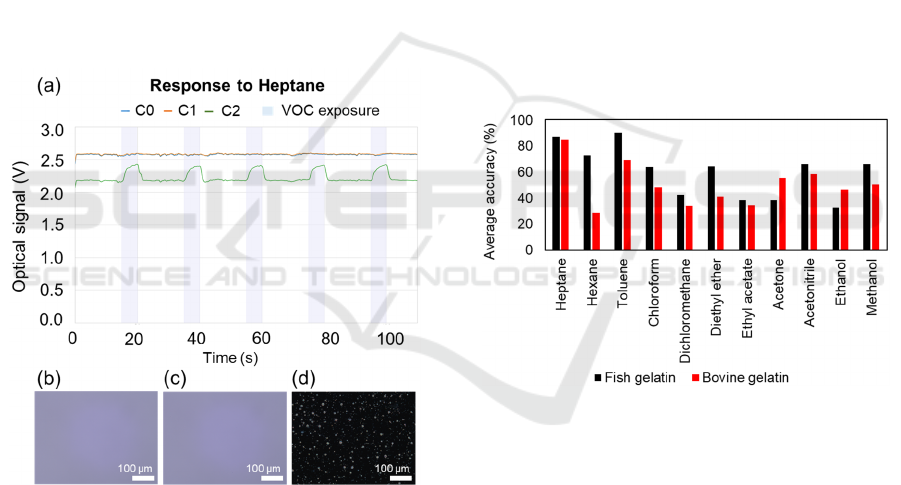
Figure 8: Optical response when using the controls as
sensing films (heptane as an example) (a); Representative
POM images of the three controls: (b) C0 fish gelatin +
water; (c) C1 fish gelatin + IL + water; (d) C2 fish gelatin
+ LC + water.
3.5 Comparison to Bovine
Gelatin-based Sensing Films
Fish gelatin-based sensing films appear as a
promising alternative to bovine gelatin-based sensing
films as they showed more homogeneous results and
lower variability to VOC prediction when comparing
different batches. Since independent validation was
used in this work, it would not be realistic to compare
the presented confusion matrix (Figure 5) with the
previously reported ones for bovine gelatin-based
films in (Esteves et al., 2019; Santos et al., 2019), that
used 10-fold cross validation. Thus, the accuracies of
the predictions for each VOC were taken for the 4
possible permutations of training and validation sets,
whereby 3 different batches were used to train and 1
batch to validate (Figure 9). Looking at the overall
tendency, fish gelatin-based films provided more
accurate predictions when compared to bovine gelatin
ones. In particular, the frequency of correct
predictions of hydrocarbons is dramatically larger
when fish gelatin-based films are used for gas sensing
(83.42% versus 60.92% obtained for bovine gelatin
sensors). In turn, bovine gelatin-based films could
accurately predict acetone and ethanol in a higher
frequency than fish gelatin-based sensors. Even
though firm conclusions cannot be taken because of
some variability between batches and analysis
methods, these variations might be related to the
structural differences between bovine and fish
gelatin. The larger content of proline and
hydroxyproline in bovine gelatin could eventually
increase its affinity to polar VOCs as ethanol.
Figure 9: Comparison of average accuracies, for each VOC,
when using fish gelatin and bovine gelatin-based sensors.
The correct predictions of 4 different analyses were
averaged. In average, the accuracy of fish gelatin sensors
was 60.36% while the one of bovine gelatin sensors was
50.23%.
4 CONCLUSIONS
In summary, we present a new class of gas-sensing
films based on self-assembled liquid crystal/ionic
liquid droplets within a fish gelatin matrix. The
produced homogeneous films have shown to be stable
throughout 1 month, despite some droplet slight
changes in the first week due to relative humidity
fluctuations. We here show that, when using these
gas-sensing films, some volatile organic compounds
have characteristic optical signals, leading to good
BIODEVICES 2021 - 14th International Conference on Biomedical Electronics and Devices
38

accuracies upon prediction of the sensed volatile,
especially for the discrimination of hydrocarbons or
for the distinction of the alcohols chemical class.
The gel production and sensing experiment was
reproducible, even though it was showed that the
films cannot be reused. Since the main morphological
changes happened after the first exposure to the set of
11 VOCs, the prediction accuracy increased for some
VOCs in the third exposure, e.g. chloroform.
The lack of birefringence and optical response
when using the controls without LC as sensor was
expected and reassures the key role of LC as the
optical probe. In turn, the importance of ionic liquids
with surfactant-like properties is also proved by the
control without IL, which detects VOCs but not in a
very consistent way due to the absence of droplets’
radial configuration.
Fish gelatin appeared as an alternative to bovine
gelatin to encapsulate LC/IL droplets and form
stimuli-responsive biosensors. Fish gelatin-based
films showed slightly higher capability to correctly
predict VOCs. Other biopolymeric matrices are being
investigated to create an array of sensors that
enhances selectivity for optoelectronic devices.
ACKNOWLEDGEMENTS
This project has received funding from the European
Research Council (ERC) under the EU Horizon 2020
research and innovation programme (grant agreement No.
SCENT-ERC-2014-STG-639123). This work was
supported by the Applied Molecular Biosciences Unit –
UCIBIO, which is financed by national funds from
FCT/MCTES (UID/Multi/04378/2020).
REFERENCES
Baldwin, E. A., Bai, J., Plotto, A., & Dea, S. (2011, May 2).
Electronic noses and tongues: Applications for the food
and pharmaceutical industries. Sensors, Vol. 11, pp.
4744–4766. https://doi.org/10.3390/s110504744
Barbosa, A. J. M., Oliveira, A. R., & Roque, A. C. A. (2018,
December 1). Protein- and Peptide-Based Biosensors in
Artificial Olfaction. Trends in Biotechnology, Vol. 36,
pp. 1244–1258.
https://doi.org/10.1016/j.tibtech.2018.07.004
Carlton, R. J., Hunter, J. T., Miller, D. S., Abbasi, R.,
Mushenheim, P. C., Tan, L. N., & Abbott, N. L. (2013).
Chemical and biological sensing using liquid crystals.
Liquid Crystals Reviews, 1(1), 29–51.
https://doi.org/10.1080/21680396.2013.769310
Carvalho, T., Vidinha, P., Vieira, B. R., Li, R. W. C., &
Gruber, J. (2014). Ion Jelly: A novel sensing material for
gas sensors and electronic noses. Journal of Materials
Chemistry C, 2(4), 696–700.
https://doi.org/10.1039/c3tc31496k
Esteves, C., Santos, G. M. C., Alves, C., Palma, S. I. C. J.,
Porteira, A. R., Filho, J., … Roque, A. C. A. (2019).
Effect of film thickness in gelatin hybrid gels for artificial
olfaction. Materials Today Bio, 1, 100002.
https://doi.org/10.1016/j.mtbio.2019.100002
Gutiérrez, J., & Horrillo, M. C. (2014, June 15). Advances in
artificial olfaction: Sensors and applications. Talanta,
Vol. 124, pp. 95–105.
https://doi.org/10.1016/j.talanta.2014.02.016
Hussain, A., Semeano, A. T. S., Palma, S. I. C. J., Pina, A. S.,
Almeida, J., Medrado, B. F., … Roque, A. C. A. (2017).
Tunable Gas Sensing Gels by Cooperative Assembly.
Advanced Functional Materials, 27(27), 1700803.
https://doi.org/10.1002/adfm.201700803
Joly-Duhamel, C., Hellio, D., & Djabourov, M. (2002). All
gelatin networks: 1. Biodiversity and physical chemistry.
Langmuir, 18(19), 7208–7217.
https://doi.org/10.1021/la020189n
Karim, A. A., & Bhat, R. (2009, May 1). Fish gelatin:
properties, challenges, and prospects as an alternative to
mammalian gelatins. Food Hydrocolloids, Vol. 23, pp.
563–576. https://doi.org/10.1016/j.foodhyd.2008.07.002
Meng, Z., Zheng, X., Tang, K., Liu, J., & Qin, S. (2012).
Dissolution of natural polymers in ionic liquids : A
review. (028), 1–29.
Mhd Sarbon, N., Badii, F., & Howell, N. K. (2013).
Preparation and characterisation of chicken skin gelatin
as an alternative to mammalian gelatin. Food
Hydrocolloids, 30(1), 143–151.
https://doi.org/10.1016/j.foodhyd.2012.05.009
Rehman, A., & Zeng, X. (2015, July 3). Methods and
approaches of utilizing ionic liquids as gas sensing
materials. RSC Advances, Vol. 5, pp. 58371–58392.
https://doi.org/10.1039/c5ra06754e
Rueden, C. T., Schindelin, J., Hiner, M. C., DeZonia, B. E.,
Walter, A. E., Arena, E. T., & Eliceiri, K. W. (2017).
ImageJ2: ImageJ for the next generation of scientific
image data. BMC Bioinformatics, 18(1), 529.
https://doi.org/10.1186/s12859-017-1934-z
Santos, G., Alves, C., Pádua, A. C., Palma, S., Gamboa, H.,
& Roque, A. C. (2019). An optimized e-nose for efficient
volatile sensing and discrimination. BIODEVICES 2019
- 12th International Conference on Biomedical
Electronics and Devices, Proceedings; Part of 12th
International Joint Conference on Biomedical
Engineering Systems and Technologies, BIOSTEC 2019,
36–46. https://doi.org/10.5220/0007390700360046
Schindelin, J., Arganda-Carreras, I., Frise, E., Kaynig, V.,
Longair, M., Pietzsch, T., … Cardona, A. (2012, July 28).
Fiji: An open-source platform for biological-image
analysis. Nature Methods, Vol. 9, pp. 676–682.
https://doi.org/10.1038/nmeth.2019
Shibaev, P. V., Wenzlick, M., Murray, J., Tantillo, A., &
Howard-Jennings, J. (2015). Rebirth of liquid crystals for
sensoric applications: Environmental and gas sensors.
Advances in Condensed Matter Physics, 2015.
https://doi.org/10.1155/2015/729186.
Fish Gelatin-based Films for Gas Sensing
39
