
Comparison of Algorithms to Measure a Psychophysical Threshold using
Digital Applications: The Stereoacuity Case Study
Silvia Bonfanti
a
and Angelo Gargantini
b
Department of Management, Information and Production Engineering, University of Bergamo, Bergamo, Italy
Keywords:
Stereoacuity Test, Algorithms, Digital Application, Psychophysical Threshold.
Abstract:
The use of digital applications to perform psychophysical measurements led to the introduction of algorithms
to guide the users in test execution. In this paper we show three algorithms, two already well known: Strict-
Staircase and PEST, and a new one that we propose: PEST3. All the algorithms aim at estimating the level of
a psychophysical capability by performing a sequence of simple tests; starting from initial level N, the test is
executed until the target level is reached. They differ in the choice of the next steps in the sequences and the
stopping condition. We have applied the algorithms to the stereoacuity case study and we have compared them
by answering a set of research questions. Finally, we provide guidelines to choose the best algorithm based
on the test goal. We found that while StrictStaircase provides optimal results, it requires the largest number of
steps and this may hinder its use; PEST3 can overcome these limits without compromising the final results.
1 INTRODUCTION
The use of computers and digital applications to per-
form psychophysical measurements has given rise to
several automatic procedures to be applied. The ob-
jective of these procedures is to determine as rapidly
and precisely as possible the value of a psychophysi-
cal variable.
In the paper, we focus on estimating psychophys-
ical thresholds by providing a sequence of simple
tasks to the patients. Following the classification
of methodological for psychophysical evaluation pro-
posed in (Stevens, 1958), we can consider three pa-
rameters: the task of an observer to judge, stimulus
arrangement, and statistical measure. Based on the
proposed classification, the set of algorithms taken
into account for the comparison fall into the follow-
ing groups. Regarding the task, we assume that the
observer’s task is the classification of some type. The
observer, once a stimulus has been presented, has to
judge if some attribute or aspect is present or absent
or to classify the stimulus. Regarding the stimuli to be
presented, we assume that are fixed, i.e. they do not
vary during the time they are being observed
1
. Usu-
a
https://orcid.org/0000-0001-9679-4551
b
https://orcid.org/0000-0002-4035-0131
1
This assumption could be relaxed provided that the classi-
fication of the stimulus is meaningful
ally, of course, they are varied between observations.
Regarding the measure of stimulus, we assume that
a level is associated with every observation and this
level is used to estimate the psychophysical thresh-
old. Furthermore, in our case study, we assume that
the psychophysical of the user could be null as a result
of missing capability by the user and the test should
discover that.
Before the introduction of digital technologies,
psychophysical measurements were made by using
simple devices or printed paper cards and the observer
had to judge the responses. The observer guided the
test procedure that could be partially fixed based on
test execution. Nowadays, tests are becoming more
computerized, partially automatized and the observer
may have only partial control during the test execu-
tion. The test execution and the estimation of the
psychophysical threshold are decided by an algorithm
that should correctly diagnose the level of the mea-
sured parameter, by minimizing the number of false
positive/negative.
The advantages are that the observer cannot in-
terfere with the testing process and the results can
be objectively validated. However, there is the risk
that the algorithms are not precise or they are not as
efficient as the observer would be thanks to the ex-
perience in providing these tests. For this reason,
in this paper, we present and compare three algo-
rithms that could be used for psychophysical mea-
78
Bonfanti, S. and Gargantini, A.
Comparison of Algorithms to Measure a Psychophysical Threshold using Digital Applications: The Stereoacuity Case Study.
DOI: 10.5220/0010204000780086
In Proceedings of the 14th International Joint Conference on Biomedical Engineering Systems and Technologies (BIOSTEC 2021) - Volume 5: HEALTHINF, pages 78-86
ISBN: 978-989-758-490-9
Copyright
c
2021 by SCITEPRESS – Science and Technology Publications, Lda. All rights reserved

surements. As a case study we take the stereoacuity
test using Random-dot stereograms. The stereoacuity
is the smallest measurable depth difference that can be
observed by someone with two eyes and normal brain
functions. It had been invented by Howard and Dol-
man who explained stereoacuity with a mathematical
model (Howard, 1919). The test starts at level N and
finishes when the user reaches his best acuity level
2
.
The paper is organized as follows. In Sect. 2.1
we present the algorithms and the case study is intro-
duced in Sect. 2.2. In Sect. 3 we answer a set of re-
search questions about the features of the algorithms
and we provide guidelines to choose the algorithm
based on the test goal in Sect. 4. Related works are
reported in Sect. 5.
2 MATERIAL AND METHODS
In this section, we present the algorithms under analy-
sis: StrictStaircase, PEST, and PEST3. Furthermore,
we introduce the stereoacuity case study and the sim-
ulation protocol applied.
2.1 Proposed Algorithms
In our study, we have implemented three algo-
rithms to measure a psychophysical threshold: Strict-
Staircase, PEST, both well known in the literature and
widely used, and a new one, PEST3, that tries to im-
prove the performances of the previous two. The ba-
sic idea behind all the proposed algorithms is the fol-
lowing. The test starts at init level N, which corre-
sponds to the easiest level (decided by the observer),
and it is decremented until the person is able to an-
swer correctly. The lowest reachable level that the
person can achieve is called target level that usu-
ally corresponds to level 1, it corresponds to the most
difficult level of the test. When the user finishes the
test, the result can be: 1. PASSED at level X: the user
has passed successfully the test and his psychophys-
ical capability is certified at level X. 2. FAILED: the
user did not pass the test because the algorithm has
found that he does not have the psychophysical ca-
pability. The algorithms differ from one another in
the following aspects: 1. the number of right answers
given at the level to be certified; 2. the errors manage-
ment when the user does not guess the answer; 3. the
policy to interrupt the test and certify or not the level.
All the algorithms are explained in the next sec-
tions. All can be generalized in case the test are per-
2
The data and materials for all experiments are available at
https://github.com/silviabonfanti/3d4ambAlgorithms.git
formed using a different scale of levels, for instance
by starting to 1 and going to a maximum value.
2.1.1 StrictStaircase
Algorithm 1: StrictStaircase.
input : Starting level, target level
output: Certification, reached level
do
switch answer do
case RIGHT do
if currentLevel>targetLevel then
currentLevel - -; currentResult =
CONTINUE;
numRightAns[currentLevel] ++;
else
if numRightAns[currentLevel]
>= 3 then
currentResult = PASSED;
else
currentResult = CONTINUE;
numRightAns[currentLevel]
++;
end
end
case WRONG do
if numWrongAns[currentLevel] >= 2
then
if currentLevel < maxLevel then
currentLevel ++; targetLevel
= currentLevel;
currentResult = CONTINUE;
numWron-
gAns[currentLevel] ++;
else
currentResult = FAILED;
end
else
currentResult = CONTINUE;
numWrongAns[currentLevel] ++;
end
end
while currentResult == CONTINUE;
return [currentResult, currentLevel]
The StrictStaircase algorithm (see Algorithm 1) is the
first algorithm we have implemented to measure a
psychophysical threshold. The test starts at the initial
level N and at each step if the user guesses the answer
(answer=RIGHT) the level (currentLevel) is decre-
mented. The algorithm stops in PASSED state when
the target level is reached (currentLevel=targetLevel)
and the user answers correctly three times (num-
RightAns>=3). If the person makes an error (an-
swer=WRONG) the level is repeated, if another er-
ror is registered (numWrongAns>=2) the level is in-
cremented and it becomes the new target level (only
Comparison of Algorithms to Measure a Psychophysical Threshold using Digital Applications: The Stereoacuity Case Study
79
higher levels can be certified at this point). A level is
PASSED if the user responds correctly three times at
the level. In the event that the person is not able to an-
swer correctly three times at level N the test result is
FAILED. This algorithm takes a lot of time to measure
the psychophysical threshold, mostly when the differ-
ence between the starting level and target level is high.
For this reason, the PEST algorithm, explained in the
next section, has been introduced in the past, with the
aim of reducing the number of steps.
2.1.2 PEST
PEST (Parameter Estimation by Sequential Test-
ing) algorithm (see Algorithm 2) has been presented
in (Taylor and Creelman, 1967). This algorithm be-
longs to the adaptive methods family which are mod-
ified according to the moment-by-moment responses.
The goal of PEST is to identify the psychophysical
threshold with a minimum number of possible steps.
The test starts at level N and the goal is to reach
the target level (usually first level), the most difficult
level. Levels of the test are into a window bounded by
a left limit limitL and a right limit limitR. Initially, the
variables limitL and limitR are set respectively to the
starting level N and the target level 1. The test starts
at level N. If the user answer is RIGHT the left limit is
set to the current level and in the next step the tested
level is equals to the round downward the mean be-
tween limitL and limitR to its nearest integer. The test
continues until limitL and limitR correspond, the test
finishes in PASSED state at current level. If the user
answer is WRONG, the right limit is set to the current
level and in the next step the tested level is equals to
the round upward the mean between limitL and lim-
itR to its nearest integer. Also in this case, the test
continues until limitL and limitR correspond, the test
finishes in PASSED state at current level. There is one
particular case, if the user answers wrongly twice at
starting level N the test finishes in FAILED state.
At the end of the test, we are not sure that the cer-
tified level is the real level owned by the user because
PEST algorithm requires only one correct answer to
certify the target level, and it can be right just for ran-
domness. For this reason, we have extended the PEST
algorithm as explained in the next section.
2.1.3 PEST3
PEST3 (presented in Algorithm 3) is based on PEST
algorithm presented in Sect. 2.1.2. The main differ-
ence compared to the PEST algorithm is that a level
is PASSED if the user answers correctly three times
at the level to be certified. The number of answers
given at level N is saved into a vector at position
Algorithm 2: PEST.
input : Starting level, target level
output: Certification, reached level
do
if answer == WRONG then
if chance > 0 && currentLevel ==
maxLevel then
chance–;
else if chance == 0 && currentLevel ==
maxLevel then
currentResult = FAILED;
else
limitR = currentLevel;
nextLevel = (int) (Math.ceil((limitL +
limitR) / 2));
currentLevel = nextLevel;
limitsOneStep();
end
else if answer == RIGHT then
limitL = currentLevel;
nextLevel = (int) (Math.floor((limitL +
limitR) / 2));
currentLevel = nextLevel;
limitsOneStep();
end
while (currentResult = CONTINUE);
return [currentResult, currentLevel]
Function limitsOneStep:
if (limitL - limitR) == 1 then
currentResult = PASSED; currentLevel =
limitL;
end
end Function
N-1. Initially, the algorithm follows the PEST flow,
until the set of certifiable levels is reduced to two
consecutive levels. A RIGHT answer increments
the number of right answers to the current level,
a WRONG answer decrements the corresponding
value. The test is PASSED if the user gives three right
answers at level i. In the case of two wrong answers
at level i, the level is incremented until a higher
level is certified or the level reaches the maximum
certifiable level. If the user does not answer correctly
three times at the same level, the test finishes in
FAILED state.
2.2 The Stereoacuity Test Case Study
We have applied the proposed algorithms to the
stereoacuity test case study a digital test application
that we have developed (Bonfanti et al., 2015). In or-
der to get a good measurement of stereopsis by avoid-
ing the described problems, the Random-dot stere-
ogram (RDS) is widely used because it permits to ob-
tain a test procedure, named Randot stereotest, that
HEALTHINF 2021 - 14th International Conference on Health Informatics
80

Algorithm 3: PEST3.
input : Starting level, target level
output: Certification, reached level
do
if firstPhase then
if answer == WRONG then
if chance > 0 && currentLevel ==
maxLevel then
chance–;
else if chance==0 &&
currentLevel==maxLevel then
currentResult=FAILED;
else
limitR = currentLevel;
limitsOneStep();
nextLevel =
ceil((limitL+limitR)/2);
currentLevel = nextLevel;
vector[limitR - 1] - -;
end
else if answer == RIGHT then
limitL = currentLevel;
limitsOneStep();
nextLevel = floor((limitL+limitR)/2);
currentLevel = nextLevel;
vector[limitL - 1] ++;
end
else
if answer == RIGHT then
vector[nextLevel - 1] ++;
currentLevel = nextLevel;
else if answer == WRONG then
vector[nextLevel - 1] += weight;
weight = weight * 3; currentLevel =
nextLevel;
end
if vector[nextLevel - 1] >= 2 then
currentResult = PASSED;
currentLevel = nextLevel;
else if (vector[nextLevel - 1] <= -2) &
(nextLevel < maxLevel) then
nextLevel++; weight = 1;
currentLevel = nextLevel;
else if (vector[nextLevel - 1] <= -2) &
(nextLevel == maxLevel) then
currentResult=FAILED; currentLevel
= nextLevel;
end
end
while (currentResult = CONTINUE);
return [currentResult, currentLevel]
Function limitsOneStep:
if (limitL - limitR) == 1 then
firstPhase = false; nextLevel = limitR;
currentLevel = nextLevel;
if limitR != 1 then
weight = weight * 3;
end
end
end Function
is easily administered and not subject to deception.
RDS consists in a stereo pair of random-dot images
viewed either with the aid of a stereoscope or printed
on stereogram (like the Lang II stereo test). In this
way, the RDS system produces a sensation of depth,
with objects appearing to be in front of or behind the
display level. During the test, the difficulty increases
at each level and the test stops when the patient is
no longer able to guess the shown images. Randot
stereotest has been easily emulated using stereo dig-
ital displays. In particular, the random small pattern
elements are the pixels of the digital screen forming
digital images. The digital test can be performed by
patients also without the presence of the doctor, be-
cause the algorithm implemented guides the patient
through the test. The test starts at level N, the level
is decremented when the patient guessed the picture,
otherwise, the level is incremented. If the user is not
able to guess any image the test is not passed. Each
level corresponds to a value of stereoacuity computed
with the Howard and Dolman formula. The choice
of the level at each step of the test follows the algo-
rithm implemented. In stereotest assessment, the use
of StrictStaircase algorithms is widespread (see for in-
stance (Hoffmann and Menozzi, 1999)). In this case
study, we have developed different versions of the test
with the algorithms explained in Sect. 2.1.
To test the operation of the algorithms we have ex-
ecuted the tests on virtual patients, automatically gen-
erated with software. We have adopted this solution
because we needed a huge number of results to make
the algorithms comparable, and it was not possible to
do individually.
2.2.1 Simulation Protocol
We have simulated 30,000 patients, using the pro-
posed algorithms, with different level of stereoacu-
ity or without stereoacuity. For each patient, we have
randomly selected the answers (RIGHT or WRONG).
We have preferred RIGHT answers when the patient
is at level i and his level of stereoacuity is greater
or equal to i, WRONG answers when the level i of
the test is more difficult compared to his stereoacu-
ity or the user does not have stereoacuity. To decide
the distribution of RIGHT and WRONG answer, we
have simulated three scenarios for each patient by as-
signing a probability to the RIGHT and WRONG an-
swers as shown in Table 1. Scenario 0 is ideal, the
patient gives the RIGHT answer if he has the current
stereoacuity level, otherwise, the answer is WRONG.
In practice this does not always happen, the user could
choose an answer that is not the one we expect due to
many factors, e.g. he does not see the image, he tries
to guess and he selects the RIGHT answer. To simu-
Comparison of Algorithms to Measure a Psychophysical Threshold using Digital Applications: The Stereoacuity Case Study
81
Table 1: Probabilities of RIGHT and WRONG answers.
S 0 S 1 S 2
Prob. RIGHT answer:
currentLevel ≥ patient stereoacuity
1 0.9 0.9
Prob. WRONG answer:
currentLevel <patient stereoacuity
1 0.9 0.75
Prob. WRONG answer:
no stereoacuity
1 0.9 0.75
late this we have considered Scenario 1 and Scenario
2. In both scenarios the RIGHT answer is selected
with a probability of 0.9 if the user has the current
stereoacuity level. The WRONG answer is selected
with a probability of 0.9 in Scenario 1 and 0.75 in Sce-
nario 2 when the user does not have stereoacuity or he
does not have the current stereoacuity level. Scenario
2 is likely to happen when the user has a limited set
of answers, for instance four, and a randomly chosen
answer has a not negligible possibility to be the right
one even if the current level is below his stereoacuity
level.
We have simulated all the algorithms with the
same level of probabilities twice, in order to perform
a test-retest assessment too. The goal is to evaluate
test repeatability: the proposed algorithms guarantee
the same level of certification in both simulations (see
Sect. 3 for further details).
Collected Data
The data are saved into a .csv file, which contains the
following information:
• scenario: probabilities used for RIGHT/WRONG
answers in the current simulation (see Table 1);
• idPatient: uniquely identifies the patient under
test;
• target: the target level to be certified;
• testType: the algorithm applied (StrictStaircase,
PEST or PEST3);
• time: 1 indicates the first simulation, 2 indicates
the second simulation;
• steps: number of steps performed;
• level: level certified;
• finalResult: PASSED or FAILED;
The results are analyzed in the next section.
2.2.2 Statistical Analysis
In order to evaluate the algorithms we propose,
we will perform null hypothesis significance testing
(NHST). NHST is a method of statistical inference
by which an experimental factor is tested against a
hypothesis of no effect or no relationship based on a
given observation. In our case, we will formulate the
null hypothesis following the schema that the algo-
rithm X is no better than the others by considering the
feature Y. Then, we will use the observations in or-
der to estimate the probability or p-value that the null
hypothesis is true, i.e. that the effect of X over the
value Y is not statistically significant. If the probabil-
ity is very small (below a given threshold), then the
null hypothesis can be rejected.
3 RESULTS
Given the simulation results, we have performed an
analysis of data by answering a set of research ques-
tions (RQs) in order to extract useful information. For
each RQ, we have formulated a null hypothesis (H
0
)
which posits the opposite compared to what we ex-
pect.
RQ1: Which is the Algorithm that Minimizes the
Number of False Positive/False Negative?
The stereoacuity test shows random dot images and
the user chooses the hidden image from those shown.
Sometimes the user gives the answers randomly
guessing or wrong the image. If this happens many
times during a test session, the measured stereoacuity
could not be compliant with the real value. Particu-
larly, the test results could be PASSED when the pa-
tient does not have the stereoacuity, or FAILED when
the patient has the stereoacuity. These cases are called
false positive and false negative. False positive is an
error in the final result in which the test indicates
the presence of stereoacuity when in reality it is not
present. Contrariwise, false negative is an error in
which the test indicates the absence of stereoacuity
when the patient has it. We expect that one of the pro-
posed algorithms minimize the number of false posi-
tive and false negative compared to the others.
To measure if an algorithm is better than the oth-
ers in terms of false positive/false negative, we have
introduced a statistical test called Proportion Hypoth-
esis Tests for Binary Data (Fleiss et al., 2003). The
result of this test is the p-value, based on this value
we have decided to reject/accept the null hypothesis.
The p-value threshold chose to determine if the null
hypothesis is accepted or not is 0.005, this value guar-
antee that the obtained results are statistically signifi-
cant. We started from two null hypothesis, one for the
false positive and the other for the false negative:
H0_FP: No algorithm is better than other in false
positive minimization.
HEALTHINF 2021 - 14th International Conference on Health Informatics
82
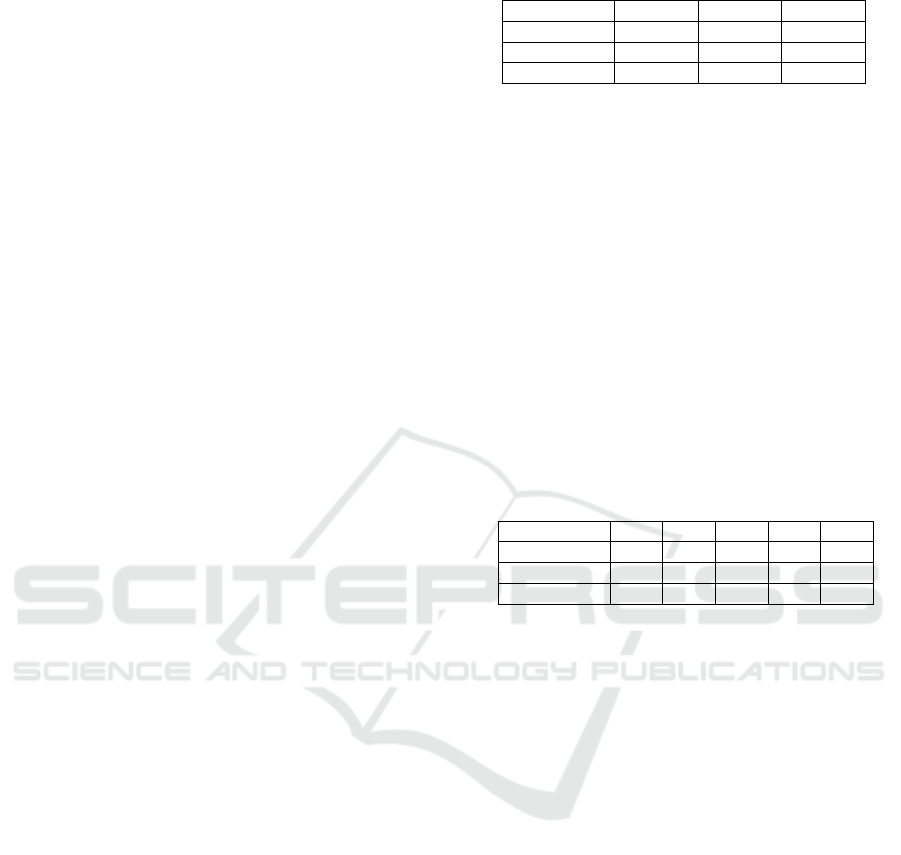
Table 2: Proportion Hypothesis Tests for Binary Data: p-
value.
S 1 S 2
p-value FN
2.2e-16 2.2e-16
p-value FP
0.05085 0.1612
Table 3: Number of false positive and false negative.
Algorithm
False negative False positive
S 1 S 2 S 1 S 2
StrictStaircase 8 148 172 218
PEST 374 877 193 180
PEST3 48 416 220 198
H0_FN: No algorithm is better than other in false
negative minimization.
The p-values obtained are shown in Table 2, the p-
value of Scenario 0 is not reported because this is
ideal scenario in which no false positive/false nega-
tive are detected. Given the results we can reject the
H0_FN and accept H0_FP. This means that there is
an algorithm which guarantees a lower rate of false
negative compare to the others, but in terms of false
positive no algorithm is better than the others.
Furthermore, this is confirmed by the number of
false positive and false negative detected as reported
in Table 3. The data proves that StrictStaircase guar-
antees a lower rate of false negatives, followed by the
PEST3.
Furthermore, to compare the algorithms we mea-
sure the sensibility and the specificity. The sensibil-
ity is the probability that a person without stereoacu-
ity reaches FAILED result, while the specificity is the
probability that a person with stereoacuity reaches
PASSED result. The values are reported in Table 4.
Scenario 0 has the highest value of sensitivity and
specificity (as expected) because it simulates the ideal
situation in which all the patients have been certified
with the target stereoacuity and the patients without
stereoacuity have not been certified by the test. Since
in terms of false negative there is an algorithm bet-
ter than the other, we can notice that the sensitivity
has different values based on the algorithm used and
the scenario tested. The lowest value of sensitivity
belongs to PEST algorithm in both scenarios, particu-
larly in Scenario 2, while the algorithm with the high-
est value of sensitivity is StrictStaircase. The PEST3,
although cannot perform well as the StrictStaircase,
is very close to it. In case of specificity, as suggested
by the p-value FP, no algorithm guarantees a higher
value than the others.
Table 4: Sensitivity and Specificity.
Algorithm
Sensitivity Specificity
S 0 S 1 S 2 S 0 S 1 S 2
Strict-
Staircase
1 0.9193 0.8843 1 0.9996 0.9918
PEST 1 0.8642 0.5361 1 0.9799 0.9553
PEST3 1 0.8952 0.8509 1 0.9973 0.9777
Table 5: Wilcoxon test for number of steps comparison: p-
value.
Algorithm StrictStaircase PEST PEST3
Strict-
Staircase
- 1 1
PEST
<2.2e-16
(PEST < StrictStaircase)
-
<2.2e-16
(PEST < PEST3)
PEST3
<2.2e-16
(PEST3 < StrictStaircase)
1 -
RQ2: Which is the Algorithm that Minimizes the
Number of Steps?
To analyze if an algorithm minimizes the number of
steps, we started from the following null hypothesis:
H0: No algorithm guarantees fewer steps compared
to the others.
To disprove or accept the null hypothesis, we have
compared all the algorithms (in twos) to prove if one
algorithm performs the test with fewer steps than the
others. We have adopted the Wilcoxon test (Noether,
1992), if the resulted p-value is less than 0.005
the null hypothesis is disproved otherwise it is ap-
proved. Table 5 shows the p-values obtained from
the Wilcoxon test under the hypothesis that the algo-
rithm in the row takes fewer steps than the algorithm
in the column. Some p-values are higher than the pre-
fix threshold, this allows us to disprove the null hy-
pothesis. Indeed the StrictStaircase algorithm takes
more steps than the others, while the PEST algorithm
is the one with the least number of steps. The average
of the number of the steps is reported in Table 6.
RQ3: Which is the Algorithm that Guarantees
Measured Level Equals to Target Level?
In this case, we analyse the number of times that the
two levels are the same. We start from the following
null hypothesis.
H0: All the algorithms guarantee that the measured
level is always not equal to the target level.
Table 6: The average of steps number.
Algorithm S 0 S 1 S 2
StrictStaircase 8.99 10.1 11.1
PEST 4.21 4.25 4.28
PEST3 5.91 6.88 7.62
Comparison of Algorithms to Measure a Psychophysical Threshold using Digital Applications: The Stereoacuity Case Study
83
After we have computed the difference between the
measured level and target level, we have discovered
that the null hypothesis is disproved. Table 7 shows
how many times the level measured is equal to the
one to be certified. As expected, in Scenario 0 all the
algorithms correctly certify the target value because
the simulations have been performed with probabil-
ity to give the correct answer is equal to 1 (see Ta-
ble 1). In Scenario 1 and Scenario 2 are admitted also
wrong answers, indeed sometimes the measured level
is not equal to the target level. The more perform-
ing algorithm is the StrictStaircase because it runs se-
quentially all levels until the target is reached and it is
required to guess three times the correct answer at the
target level. When the simulation takes into account
the possibility to provide wrong answers, the PEST
algorithm is the worst compared to the others. This
could be because this algorithm asks the answers only
once at each level and it certifies a level with only one
right answer.
Table 7: Times when measured level is equal to target level
over 18,032 PASSED simulations - the not certified tests are
excluded.
S 0 S 1 S 2
StrictStaircase 18,032 16,192 15,154
PEST 18,032 12,432 9,409
PEST3 18,032 15,142 13,296
RQ4: Which is the Algorithm with the Minimum
Difference between Target Level and Measured
Level?
When the difference between the target level and mea-
sured level is not equal to zero, we are interested to
know this value. To answers at this RQ, we start from
the following null hypothesis:
H0: All the algorithms have the same difference be-
tween the target level and measured level.
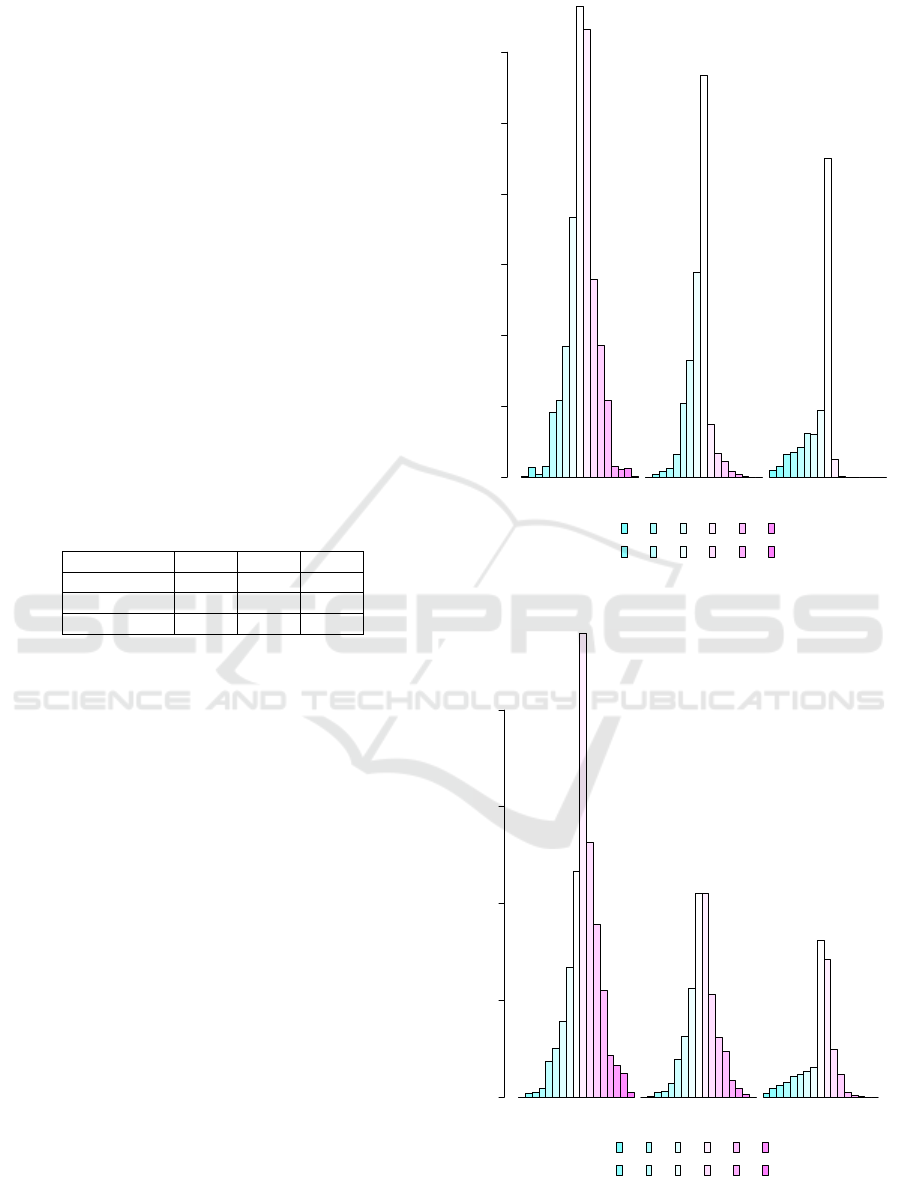
We have computed the difference between target
level and measured level and we have found that the
difference is not always zero, the results are reported
in Fig. 1 and Fig. 2. In Scenario 1, the percentage
of cases in which target and measured level are dif-
ferent for each algorithm simulation is the following:
27,00% PEST, 13,31% PEST3, 8,30% StrictStaircase
(the percentage is computed over the 20.000 simula-
tions for each algorithm). We have further investi-
gated for each algorithm the difference between tar-
get and measured level. PEST algorithm certifies user
with one level plus or minus in 48,01% of cases and
two levels plus or minus in 23,93% of cases. The
difference between target and measured level is more
than two levels in 28,06% of cases. While these two
PEST PEST3 StrictStaircase
0 200 400 600 800 1000 1200
−9
−8
−6
−5
−3
−2
1
2
4
5
7
8
Figure 1: Difference between target level and measured
level in Scenario 1.
PEST PEST3 StrictStaircase
0 500 1000 1500 2000
−9
−8
−6
−5
−3
−2
1
2
4
5
7
8
Figure 2: Difference between target level and measured
level in Scenario 2.
HEALTHINF 2021 - 14th International Conference on Health Informatics
84
algorithms have a distribution centered on ±1 and ±2,
PEST3 and StrictStaircase distributions are centered
on [-4,-1]. StrictStaircase certifies most of the tests
(54,22%) with one level minus and 11,45% of them
are certified with two levels minus. Furthermore, we
have noticed that all the algorithms, except PEST, are
“pessimists” because when the target and measured
level are different, in many cases, they certify a higher
level compared to the target. With the introduction
of higher error probability, Scenario 2, the percent-
age of cases in which target and measured level are
different for each algorithm simulation is the follow-
ing: 42,25% PEST, 22,72% PEST3, 13,33% Strict-
Staircase (the percentage is computed over the 20.000
simulations for each algorithm). As expected the per-
centages are higher compared to Scenario 1 because
the probability of the wrong answer has been incre-
mented. The difference between target and measured
level is centred on [-1,3] for PEST algorithms and [-
2,2] for PEST3 and StrictStaircase algorithms. In de-
tails, PEST has 68,30% of cases in the [-1,3] interval,
while the percentage in interval [-2,2] is 70,47% and
72,47%for PEST3 and StrictStaircase respectively.
RQ5: Which is the Best Algorithm with the Best
Performance in Test-retest?
Test-retest evaluates the repeatability of a test admin-
istered at two different times, T1 and T2. A test is
repeatable if the measure does not change between
the two measurements, under the hypothesis that in
T1 and T2 the symptomatology is not changed.
We have started the analysis from the following
null hypothesis:
H0: All the algorithms have the same performance in
test-retest.
In our case study, we have measured the reliability
of test-retest with the Pearson Correlation Coefficient.
First of all, we have simulated again the patients in
different scenarios and we have computed the Pear-
son Coefficient which results are shown in Table 8.
As expected, in Scenario 0 the correlation is equal to 1
for all the algorithms because this scenario guarantees
that for every simulation the certified level is always
the target. In Scenario 1 and Scenario 2 the algorithm
with the highest correlation is StrictStaircase, respec-
tively the Pearson coefficient is 0.88 and 0.83 which
are both considered good reliability coefficients. At
the opposite, the algorithm with the lower correlation
is PEST. The reliability is questionable in Scenario 1
(0.77) and it is poor in Scenario 2 (only 0.60). PEST3
has good reliability in Scenario 1 (the Pearson coef-
ficient is 0.87) while in Scenario 2 the reliability is
acceptable (0.77).
Table 8: Pearson correlation test-retest.
Scenario 0 Scenario 1 Scenario 2
StrictStaircase 1 0.88 0.83
PEST 1 0.77 0.60
PEST3 1 0.87 0.77
4 DISCUSSION
In the previous section, we have answered to a set of
RQs to measure sensitivity and sensibility, number of
steps, number of times that the measured level is equal
to the target level, the difference between target level
and measured level (when they are different), and the
test-retest reliability. In this section, we want to dis-
cuss the results and provide some guidelines to choose
the algorithm based on the test goal. For each RQ we
have assigned a score from one to three (see Table 9),
one is assigned to the algorithm which better satisfies
the research question, three is assigned to the worst
algorithm under analysis.
Table 9: Comparison between RQs: which algorithm guar-
antee the best performance?
Algorithm RQ1 RQ2 RQ3 RQ4 RQ5
StrictStaircase 1 3 1 1 1
PEST 3 1 3 3 3
PEST3 2 2 2 2 2
The algorithm with the best performance is Strict-
Staircase. It guarantees the lowest number of false
positive and false negative, target level, and measured
level are the same most of the time and when they are
different the difference is mostly ±1 level. Further-
more, it guarantees the best test-retest reliability, but
due to the fact that it tests all the levels, it requires
a high number of steps to complete the test and this
may jeopardize its use when the testing time can be
a critical factor, for example with children. PEST al-
gorithm has the performance level opposite to Strict-
Staircase. It requires, more or less, half of the number
of steps (it is the algorithm with the lower number of
steps) but in most cases, the target level is not equal
to the measured level and test-retest reliability is the
lowest. When it is required an algorithm with good
performance, but with a limited number of steps to
complete the test, PEST3 is a good compromise be-
cause it can be applied in around half of the steps
compared to StrictStaircase. It has high sensitivity
and sensibility, the measured level is equal to the tar-
get in a large number of cases and when they are not
equal the difference is minimal. Furthermore, in case
of test-retest, it guarantees good reliability.
Comparison of Algorithms to Measure a Psychophysical Threshold using Digital Applications: The Stereoacuity Case Study
85

5 RELATED WORK
In this section, we present the algorithms used in
literature for the stereoacuity measurement. In pa-
pers (Bach et al., 2001; Kromeier et al., 2003) the au-
thors apply the PEST algorithm to measure stereoacu-
ity using the Freiburg Test and, as demonstrated also
by our case study, the proposed algorithm allowed
to save time during the stereoacuity measurement.
We found that Staircase algorithm is often used in
the literature, with some minimal differences. In pa-
pers (Wong et al., 2002; Li et al., 2016; Vancleef et al.,
2018; Ushaw et al., 2017), stereoacuity is measured
using staircase, the disparity is increased/decreased of
one level. The disparity is increased of one level and
decreased of two levels in paper (Hess et al., 2016).
In paper (Tidbury et al., 2019), staircase is compared
to book based clinical testing and the result is that the
threshold measured with digital test is more reliable
also due to the possibility to increase the number of
level of disparity.
6 CONCLUSION
In this paper, we have presented the first analysis of
virtual patients to understand the applicability of the
algorithms and evaluate their performances. The next
step will be to run the stereoacuity test on patients
using our mobile application (Bonfanti et al., 2015)
to evaluate the performance of the three algorithms
presented and collect information about usability de-
pending on the algorithm. Furthermore, we would
evaluate if the probabilities applied in this study to
the three different scenarios represent reality or not.
REFERENCES
Bach, M., Schmitt, C., Kromeier, M., and Kommerell,
G. (2001). The freiburg stereoacuity test: Auto-
matic measurement of stereo threshold. Graefe’s
Archive for Clinical and Experimental Ophthalmol-
ogy, 239(8):562–566.
Bonfanti, S., Gargantini, A., and Vitali, A. (2015). A mo-
bile application for the stereoacuity test. In Duffy,
V. G., editor, Digital Human Modeling. Applications
in Health, Safety, Ergonomics and Risk Manage-
ment: Ergonomics and Health, pages 315–326, Cham.
Springer International Publishing.
Fleiss, J. L., Levin, B., and Paik, M. C. (2003). Statisti-
cal methods for rates and proportions; 3rd ed. Wiley
Series in Probability and Statistics. Wiley, Hoboken,
NJ.
Hess, R. F., Ding, R., Clavagnier, S., Liu, C., Guo, C., Viner,
C., Barrett, B. T., Radia, K., and Zhou, J. (2016). A
robust and reliable test to measure stereopsis in the
clinic. Investigative Opthalmology & Visual Science,
57(3):798.
Hoffmann, A. and Menozzi, M. (1999). Applying
anaglyphs for the assessment of stereopsis to a PC-
based screening system. Displays, 20(1):31–38.
Howard, H. J. (1919). A test for the judgment of distance.
Am J Ophthalmol, 2:656–675.
Kromeier, M., Schmitt, C., Bach, M., and Kommerell, G.
(2003). Stereoacuity versus fixation disparity as in-
dicators for vergence accuracy under prismatic stress.
Ophthalmic and Physiological Optics, 23(1):43–49.
Li, R. W., So, K., Wu, T. H., Craven, A. P., Tran, T. T.,
Gustafson, K. M., and Levi, D. M. (2016). Monocular
blur alters the tuning characteristics of stereopsis for
spatial frequency and size. Royal Society Open Sci-
ence, 3(9):160273.
Noether, G. E. (1992). Introduction to Wilcoxon (1945)
Individual Comparisons by Ranking Methods, pages
191–195. Springer New York, New York, NY.
Stevens, S. S. (1958). Problems and methods of psy-
chophysics. Psychological Bulletin, 55(4):177–196.
Taylor, M. M. and Creelman, C. D. (1967). Pest: Efficient
estimates on probability functions. The Journal of the
Acoustical Society of America, 41(4A):782–787.
Tidbury, L. P., O’Connor, A. R., and Wuerger, S. M. (2019).
The effect of induced fusional demand on static and
dynamic stereoacuity thresholds: the digital synop-
tophore.BMC Ophthalmology, 19(1).
Ushaw, G., Sharp, C., Hugill, J., Rafiq, S., Black, C.,
Casanova, T., Vancleef, K., Read, J., and Morgan, G.
(2017). Analysis of soft data for mass provision of
stereoacuity testing through a serious game for health.
In Proceedings of the 2017 International Conference
on Digital Health - DH’17. ACM Press.
Vancleef, K., Read, J. C. A., Herbert, W., Goodship,
N., Woodhouse, M., and Serrano-Pedraza, I. (2018).
Two choices good, four choices better: For measur-
ing stereoacuity in children, a four-alternative forced-
choice paradigm is more efficient than two. PLOS
ONE, 13(7):e0201366.
Wong, B. P. H., Woods, R. L., and Peli, E. (2002).
Stereoacuity at distance and near. Optometry and Vi-
sion Science, 79(12):771–778.
HEALTHINF 2021 - 14th International Conference on Health Informatics
86
