
Annotations in Different Steps of Visual Analytics
Christoph Schmidt
1 a
, Bastian Grundel
2 b
, Heidrun Schumann
1
and Paul Rosenthal
1 c
1
Institute for Visual and Analytic Computing, University of Rostock, Rostock, Germany
2
Eye Care Center, University of Greifswald, Greifswald, Germany
Keywords:
Annotation, Visual Analytics, Heterogeneous Clinical Data, Data Preprocessing, Data Cleansing, Data
Exploration.
Abstract:
Annotations in Visual Analytics (VA) have become a common means to support the analysis by integrating
additional information into the VA system. Here, annotations often differ between the individual steps of VA.
For example, during data preprocessing it may be necessary to add information on the data, such as redundancy
or discrepancy information, while annotations, used during exploration, often refer to the externalization of
findings and insights. Describing the particular needs for these step-dependent annotations is challenging. To
tackle this issue, we examine the data preprocessing, data cleansing, and data exploration steps for the analysis
of heterogeneous and error prone data in respect to the design of specific annotations. By that, we describe their
peculiarities for each step in the analysis, and thus aim to improve the visual analytics approach on clinical
data. We show the applicability of our annotation concept by integrating it into an existing visual analytics
tool to analyze and annotate data from the ophthalmic domain. In interviews and application sessions with
experts, we assess the usefulness of our annotation concept for the analysis of the visual acuity development
for patients, undergoing a specific therapy.
1 INTRODUCTION
Data preprocessing, data cleansing, and data ex-
ploration are common steps in visual analytics
(Gschwandtner et al., 2012; Sacha et al., 2014). Each
of these steps has its own challenges. Data prepro-
cessing often requires consideration of multiple data
sources, which can lead to redundant and potentially
conflicting data point values. During data cleansing,
the detected data discrepancies and incompleteness
must be resolved to create a consistent data set. Dur-
ing data exploration, the characteristics must be as-
sessed by experts with domain knowledge to identify
findings that may lead to new insights. While anno-
tations have proven useful to be supportive in visual
analytics (Zhao et al., 2017), their particular use with
respect to the needs, described above, is challeng-
ing. This regards, for example, how annotations can
help (i) to mark and communicate data redundancies
and discrepancies, (ii) to inform and support users
about data cleansing decisions or recurring data er-
a
https://orcid.org/0000-0002-5358-0673
b
https://orcid.org/0000-0003-3791-0414
c
https://orcid.org/0000-0001-9409-8931
rors, and (iii) to perpetuate and/or comment on results
in single-user, asynchronous, or collaborative envi-
ronments. Our approach addresses these issues by de-
signing tailored annotations for each of these different
steps. For the data preprocessing step, we insert auto-
matically generated annotations for data value redun-
dancy, discrepancy, and discrepancy resolution. For
data cleansing, we integrate annotations that enable
users to explain decisions about resolved discrepan-
cies on the one hand and to automatically detect re-
curring errors on the other hand. The latter facilitates
the further cleansing process by reducing the effort for
the detection of recurring errors. The annotations for
the exploration step are designed to capture the users’
knowledge, required for the analysis, to support iden-
tification and externalization of findings and insights,
and allow for user communication. Our annotations
follow the principle of being as automatic as possible,
while also increasing the trust in the data by reliability
and transparency. Under this premise, we identify and
describe these customized annotations for individual
steps in the visual analytics process, generating an an-
notation concept for these steps. We are aware of the
fact that this problem also affects other steps of the
Schmidt, C., Grundel, B., Schumann, H. and Rosenthal, P.
Annotations in Different Steps of Visual Analytics.
DOI: 10.5220/0010198001550163
In Proceedings of the 16th International Joint Conference on Computer Vision, Imaging and Computer Graphics Theory and Applications (VISIGRAPP 2021) - Volume 3: IVAPP, pages
155-163
ISBN: 978-989-758-488-6
Copyright
c
2021 by SCITEPRESS – Science and Technology Publications, Lda. All rights reserved
155

analysis, such as validation or knowledge generation.
However, integrating annotations into these steps re-
quires further detailed considerations, and goes be-
yond the scope of this paper.
To show the applicability of our concept, we ex-
tend an existing visual analytics tool, described by
Schmidt et al. (2019), and enable the description, cap-
ture, and communication of additional information,
that support the users in their visual analytics process.
We apply the advanced tool to heterogeneous,
contradictory, and incomplete data from an oph-
thalmic clinic. Here, domain experts want to assess
the development of visual acuity values, which repre-
sent the patients’ ability to see sharply and in detail,
after a change in therapy. With the support of our
annotation-enriched tool, domain experts are able to
process and analyze data from several thousand pa-
tients efficiently. This allows to examine large single-
center data (from one clinic) in sufficient time, and
thus avoids the spreading of the work to multiple
centers (several clinics), generating possibly biased
multi-center data.
This work is structured as follows: Section 2 de-
scribes existing work on annotations in the different
steps of visual data analysis. In Section 3, we show
our approach, whose implementation into an existing
tool is sketched in Section 4. In Section 5, we de-
scribe its usefulness by means of user sessions and
application on a use case. A summary and an outlook
on future work can be found in Section 6.
2 RELATED WORK
The use of annotations can be critical for visual ana-
lytics (Lipford et al., 2010; Mahyar et al., 2012) and
plays a role in different perspectives. First, there are
approaches to introduce general classifications for an-
notations (Saur
´
ı, 2017; Schmidt et al., 2018; Vanhulst
et al., 2018). Second, there are approaches to use an-
notations within the different steps of visual analytics.
As we specifically examine annotations during these
steps, we will discuss related work in the following.
As data preprocessing generally has the goal to
structure and fuse the data, data preprocessing anno-
tations support that process by gathering additional
information. Existing literature shows automatic (Jin
et al., 2017; Lakiotaki et al., 2018; Shabana and Wil-
son, 2015) and manual (Kr
¨
uger et al., 2015; Schmidt
et al., 2019) approaches. For the communication of
these annotations, Kr
¨
uger et al. (2015) have shown
that a direct communication within the data visu-
alization can be useful, while Shabana and Wilson
(2015) communicate the added information as an ex-
tra layer on demand. Although there are approaches
to combine both direct and on-demand communica-
tion (Schmidt et al., 2019), a thorough analysis of
such presentations is ongoing research.
The reason for data cleansing is the correction
of erroneous data (M
¨
uller and Freytag, 2003). Data
Cleansing Annotations can support that process when
they integrate the knowledge of the user. McCurdy
et al. (2019) apply this approach to epidemiological
data, where they gather the information from the user
via an extra view and communicate the information
on demand via interaction functions in the visualiza-
tion system. While there are further approaches for
data cleansing visualizations (Gschwandtner et al.,
2014; Schmidt et al., 2019), we focus on annotation
use for recording and visualizing the circumstances
of the cleansing process.
Data Exploration Annotations have been used to
support the exploration step by, e.g., (i) locating the
findings (Heer et al., 2007; Willett et al., 2011), (ii)
documenting the findings (Willett et al., 2011; Zhao
et al., 2018), and (iii) externalizing the findings and,
if applicable, the gained insights (Zhao et al., 2017).
Data exploration annotations can be gathered either
directly in the visualization, (Groth and Streefkerk,
2006), next to the visualization, (Willett et al., 2011),
or via extra views (Schmidt et al., 2019). Concerning
the communication of annotations during exploration,
Groth and Streefkerk (2006) and Heer et al. (2007),
among others, show them directly in the visualization,
while Zhao et al. (2017) and Mahyar and Tory (2014)
design a dedicated tool for annotation visualization.
To sum up, previous work often describes the use
of annotations for only one step of the analysis, while
we aim at analyzing the fundamental characteristics
of annotations within the three steps: data prepro-
cessing, data cleansing, and data exploration. Al-
though literature has shown supporting effects of an-
notations in the analysis of heterogeneous real-world
data, to our knowledge there is no consideration of the
specifics of annotations during the different steps in
visual analytics. To find remedy, we describe differ-
ent ways to collect and communicate the annotations
for each step.
3 OUR APPROACH
The steps preprocessing, cleansing, and exploration
are of special interest, since previous analyses in the
field of heterogeneous real-world data have shown
their importance (Gschwandtner et al., 2012).
IVAPP 2021 - 12th International Conference on Information Visualization Theory and Applications
156
To identify reasonable characteristics of annota-
tions, we first define the requirements. These require-
ments arose from the results of the discussions with
experts and previous annotation descriptions in liter-
ature. In general, annotations may well support the
analysis, yet manual annotations are often time con-
suming. Previous work has shown that manual anno-
tations, e.g., for labeling image data, increase the time
needed by a factor of five, compared to a combination
of manual and automatic annotation (Jin et al., 2017).
On the other hand, there is still a scepticism of users
towards subsequently added information to the analy-
sis system, especially, if this has been done automat-
ically (Krishnan et al., 2016). In the discussion with
our experts, these two aspects were confirmed. This
results in the conflict, that experts do not have the time
get involved with thousands of data points via manual
annotation, yet want to understand all changes made
in the data. We have the impression that the experts
regard the data as ”their data” as long as they can trace
where the data came from and what happened to it.
To reflect that contrast, we define the following two
requirements for our approach:
• R1 - Use automatic annotation where possible and
manual annotations where necessary.
• R2 - Ensure a high reliability and transparency of
annotations, and thus increase the trust in the an-
notations.
With that in mind, we design the annotations for the
VA steps. For each step, we shortly describe its key
elements, followed by a thorough annotation descrip-
tion.
3.1 Data Preprocessing Annotation
The data preprocessing step has the goal to collect
and structure necessary information from all avail-
able data sources. These data may stem from different
sources, as data is often collected from more than one
electronic device and/or manually recorded. When
these sources are merged, redundancies and discrep-
ancies within the data may appear. For a structured
data analysis, these redundant values are often consol-
idated to one value. To solve consolidation conflicts
in case of discrepancies, rules have to be applied, with
which the final consolidated value is retrieved. Dur-
ing that process, various supplementary information
is produced: source names, the redundant values for
the data point, the existence of discrepancies, the de-
cision information on the final value used.
Making that information available to users via an-
notations increases the transparency of the consolida-
tion process, and thus can help to better understand
and judge the consolidated data. So, we introduce the
possibility to gather and communicate that informa-
tion.
Figure 1: Annotation creation during the data preprocess-
ing consolidation process. The annotation content is created
during the redundancy removal and discrepancy resolution
by deriving the respective information automatically. For
processing during the later analysis steps, a link to the con-
solidated data point is preserved.
As data preprocessing often includes operations,
that have to reflect the peculiarities of the domain
data, tacit knowledge of the domain experts may be
required to be included. This can be done manually
via direct input by the domain expert, e.g., by solv-
ing data discrepancies for each affected data value.
Yet, if the experts’ knowledge is represented by pre-
defined, domain-specific consolidation rules, the con-
solidation process can be automated, including auto-
matic annotation recording. In reference to R1, we
achieve that, by utilizing a recording process that au-
tomatically captures the consolidation and result in-
formation during the application of the consolidation
rules as shown in Figure 1. In case of a structuring
or consolidation incident, we store all source names
and data values for that data point in an annotation.
We obtain the information, whether there is a redun-
dancy (no. of sources > 1) and/or a discrepancy (no.
of different values > 1). We also store the informa-
tion, what consolidated value is chosen and which
rule applies. To increase the understanding of the an-
notation creation parameters, the annotation is stored
with some meta information, such as timestamp, user
name, and a link to the associated data point. So,
the resulting annotation holds the information, what
data sources were considered, if redundancy and/or
discrepancies apply, what rule lead to the choice of
value, as well as meta information.
We communicate our preprocessing annotations
to show the causation and circumstances of the con-
solidation results, in order to enable an assessment by
experts. The decision on how to communicate them
is driven by the close linkage between the annota-
tions, the data, and the rule-based automatic changes,
made to the data. We show the linkage by directly
Annotations in Different Steps of Visual Analytics
157
Figure 2: The preprocessed data shown without visual en-
coding of consolidation annotations (a) and different encod-
ings of redundancy and discrepancy information (b). The
encodings can include values with only one source (1), con-
sistent values (2), values with discrepancies solved by rule
(3), and/or values with discrepancies, where user action is
needed (4). The shown design is taken from our exemplary
implementation.
altering the original data encodings in the exemplary
adapted tool. In our case, these are color-coded cat-
egories on a time-line visualization (Figure 2). As
our visual design should allow easy interpretation of
where and with what result data consolidation was
performed, we intend to find intuitive encodings for
redundancy and discrepancy information. As a result,
we decide to not indicate fully consistent data points
at all, as there is no need for user attention (2). If
there is some source missing (so there is no redun-
dancy), we encode this information by reducing the
area of color coding, so some color is ”missing” (1).
In case there is a discrepancy during consolidation,
which was solved by the user defined rules, we rep-
resent that by showing the consolidation result with
some transparency. This indicates that the result is
not discrepancy-free (3). Finally, if there is a discrep-
ancy and no rule could be applied, we indicate the
discrepancy by not encoding any of the contradictory
data values (4). This ensures that the user sees the
need for action without being mislead by an encoding
of a value that could be wrong due to the discrepancy.
Yet, the other information gathered for each anno-
tation would lead to visual clutter, if shown directly in
the visualization. So, we display them on demand in
an extra view (Figure 3). With these information pro-
vided, users are able to judge the annotation content,
and thus increase their trust in the annotations (R2).
3.2 Data Cleansing Annotations
Data cleansing usually has the goal to reduce the
number of missing, misleading, or wrong data points;
Figure 3: Detail view with further information on the con-
solidation process, which is shown on demand to avoid clut-
ter.
short - to ”correct dirty data” (Gschwandtner et al.,
2014). This can be achieved by amending the pre-
processed data through adding, changing, or deleting
data points. In contrast to preprocessing, many data
points to be cleansed require the experts’ knowledge
in combination with context information, such as
nearby data points, so that manual corrections are
necessary. If fully allowed and undocumented, these
corrections can completely alter the original data, and
thus bear the risk to introduce new errors and to leave
the user unconscious of changes made. To reduce
these risks, annotations can provide information
on when, how, and by whom, which data values
have been edited. We address these questions by
developing specific ways to gather and communicate
annotations during data cleansing.
Figure 4: Via dedicated interaction with the data cleansing
visualization, the specific cleansing view is shown. Here,
the changes (added, changed, deleted value) are recorded
together with supplementary information. They are stored
in an annotation, linked to the data point.
IVAPP 2021 - 12th International Conference on Information Visualization Theory and Applications
158
As the focus during data cleansing lays on
the detection and correction/amendment of erro-
neous/missing data points (Gschwandtner et al.,
2014), the annotation gathering process should avoid
a disturbance of that focus. We achieve that by inte-
grating the gathering process into the cleansing pro-
cess, so that the necessary information is recorded
”on the side”. Our design of this process is shown
in Figure 4. The user starts the cleansing via inter-
action with the visualization. The additional anno-
tation information is collected in the cleansing view
by dedicated additional fields. As there are recurring
errors, we introduce the possibility to automatically
annotate all errors of a specific type. This concerns,
e.g., if a certain source always produces an error with
a certain value, the user can decide to change all val-
ues, with the respective annotation generated auto-
matically (R1). As this process is user initiated, and
the information is always stored in an annotation, and
thus is transparent, the trust in the change remains
high (R2).
When the editing operation is finished and the
additional annotation fields are filled, both, the edited
data point(s) and the annotation(s) information are
stored and mutually linked for later reference. To
allow users to judge the edited value, for example
in asynchronous collaborative environments or
discontinuous processing, as described by Zhao et al.
(2018), editing information beyond the changed
value, such as the user name, the concrete process
(add, change or delete), the timestamp, etc., are also
stored. This enables users to see and judge, in what
moment of the analysis (timestamp), with which
qualification (user), what action (add, change, delete)
a data point has undergone (R2).
Figure 5: The cleansed data shown without visual encod-
ing of annotations (a). As seen, there is no indication, and
thus no recognition of the data changes made. In contrast,
view (b) indicates the data changes via varying annotation
encodings. The encodings can include deleted values (1),
changed values (2), and added values (3).
During the data cleansing step, changes in the data
are made. The goal of annotations in this step is to
communicate (highlight) the changes and their cir-
cumstances. Here, several aspects have to be consid-
ered. On the one hand, the focus during this step re-
mains on detecting erroneous data-points and cleans-
ing them, which the displayed annotations must not
disturb. On the other hand, the annotations should
provide sufficient information that is helpful in judg-
ing the changes made.
To fulfill both needs, we use overview and detail
techniques, as shown in Figure 5 (b), similar to the
preprocessing step. To avoid misleading altering of
the cleansing visualization, we provide an extra layer
on top of the visualization with the highlighting in-
formation. For that extra layer, we do not use the data
encoding colors and forms, but represent the meta in-
formation by separate forms and colors. In doing so,
we are able to represent the meta information on the
cleansed data without disturbing the original data rep-
resentation, but still indicating locations, where data
cleansing applies.
The meta information shows the location of
changes (location of red colored glyphs Figure 5 (1)-
(3)) and the type of change (form of glyph). To rep-
resent deleted data points, we intent to indicate the
disappearance of that data point by fully overlaying
the color-coded value with a data point shaped glyph
(1). Altered values are indicated with a circular glyph
(2), to highlight the data point and still show the al-
tered value encoding. For added values, we indi-
cate the location with an additional mark on the en-
coded data value (3). To switch between the indi-
cation of cleansed data points and the visualization
of the ”pure” cleansed data, we include a function
to hide the extra layer with the cleansing annotation
encoding (see difference between Figure 5 (a) - no
annotations and Figure 5 (b) - annotated). To fully
understand what has been done, the user can display
detail information on demand via mouse hovering on
the respective annotation in the visualization.
3.3 Data Exploration Annotations
According to Sacha et al. (2014), data exploration has
the goal to identify findings and gain insights. They
state that ”a finding is an interesting observation made
by an analyst using the visual analytics system. The
finding leads to further interaction with the system
or to new insights”. Annotations at this stage have
been used to support that process by, e.g., (i) locating
the findings, (ii) documenting the findings, and (iii)
externalize the findings and, if applicable, the gained
insights. For our annotation concept, we differentiate
between these three goals, as they impose different
gathering and communication aspects.
Annotations in Different Steps of Visual Analytics
159
Figure 6: The concept on annotation gathering during data
exploration. Via dedicated interaction methods annotations
are recorded. That concerns either marking, commenting,
or externalization.
Gathering annotations during data exploration of-
ten means recording the thoughts of experts in ref-
erence to the visualization (Groth and Streefkerk,
2006). By working with experts and analyzing exist-
ing literature, we have seen that the recording char-
acteristics often depend on the annotation purpose.
To reflect the different purposes, we organized the
gathering process respectively (Figure 6). To mark
identified findings within the visualization, we sup-
port locally drawn annotations within the visualiza-
tion, comprised of different forms like circles or el-
lipses. For the recording of comments, we use free
text entries. The gathering is initiated either directly
in the visualization for feature commenting or within
a separate view for general commenting or user com-
munication. To externalize findings, all exploration
annotations are automatically exported via standard-
ized JSON objects (R1). This includes the visual-
ization information (e.g., screenshot or visualization
stage), the annotation characteristics (data-point ref-
erences, type), any comment made by the annotator,
and meta information (such as user name, timestamp,
existing references to other annotations, etc.). The lat-
ter is important, to support comments or discussions
on previously made annotations (Willett et al., 2011).
Additionally, we store verification information for all
exploration annotations (R2). That verification infor-
mation consists of the annotator’s qualification as well
as positive or negative confirmations from other users.
Communicating our annotations during explo-
ration also depends on their purpose. If users want to
mark findings, the communication should be locally
connected to the finding as shown in Figure 7 (a). By
that, the user instantly recognizes, where the finding
is situated. For the forms of communicating marks,
we are inspired by Heer et al. (2007) and use glyphs
or simple geometric forms to highlight the location
on the one hand and reduce the distraction from the
Figure 7: The data with annotation view during explo-
ration. Annotations include markings in the visualization to
highlight findings (a) and comments next to the visualiza-
tion for recording of insights or discussion between experts
(b).
actual finding on the other hand. To show additional
comments for the marked findings, mouse hovering is
used to display the comment on demand and locally
near the mark. Especially for the marks within the vi-
sualization, there is a particular difference to the other
steps. While annotation glyphs during preprocessing
and cleansing were locally linked to a specific data
point and predefined in form, here, we do not restrict
the location, form, or size. By that, we aim to support
the localization and marking of features and findings
of any size and location in the visualization.
Yet, more complex comments, even though they
have been localized in the visualization, as by Groth
and Streefkerk (2006), are likely to clutter the over-
all visualization. We therefore apply visual separa-
tion in accordance with Schmidt et al. (2018), which
means to assign an extra space next to the visualiza-
tion. The advantage is that more than one comment
can be shown and brought into context by the user.
For the design of the extra view, we were inspired by
Willett et al. (2011), who suggest a forum style, which
sufficiently supports analysis and discussion function-
ality. Figure 7 (b) shows our design concept, fitted to
comments from different experts with different quali-
fications with the need for mutual judgement.
To analyze externalized findings, we support a
structured export for further usage with other tools.
For the externalization process, we provide an extra
view within the system to show the annotations to be
externalized. It allows users to parameterize and filter
the annotations and related data-points.
3.4 Summary
In conclusion to the details provided above on the
different steps, we summarize our analysis as follows:
IVAPP 2021 - 12th International Conference on Information Visualization Theory and Applications
160
Data preprocessing has the goal to generate a
structured and consolidated data set based on the
available raw data. Annotations provide information
on the structuring and consolidation process, and thus
increase the trust in the consolidated data.
Data cleansing has the goal to generate a seman-
tically correct data set, based on the preprocessed
data by adding missing values and deleting or chang-
ing erroneous data values. Annotations highlight the
changes and provide additional information on the
changes, so that the user knows when and where what
changes were made by whom.
Data exploration has the goal to generate findings
and insights by exploring the cleansed data. Anno-
tations mark these findings in the visualization, inte-
grate experts thoughts into the VA system and allow
for discussion between users. By that, the reason-
ing process is supported and highlighted features are
made persistent. With annotations, both are available
for later recall via externalization.
4 IMPLEMENTATION
In this section, we show that our annotation con-
cept can be integrated into an existing visual analyt-
ics tool by providing additional annotation function-
ality. The tool we extended, already provides visual
analytics functionality and rudimentary annotation
function (GitLab: https://git.informatik.uni-rostock.
de/cschmidt/topos-tool).
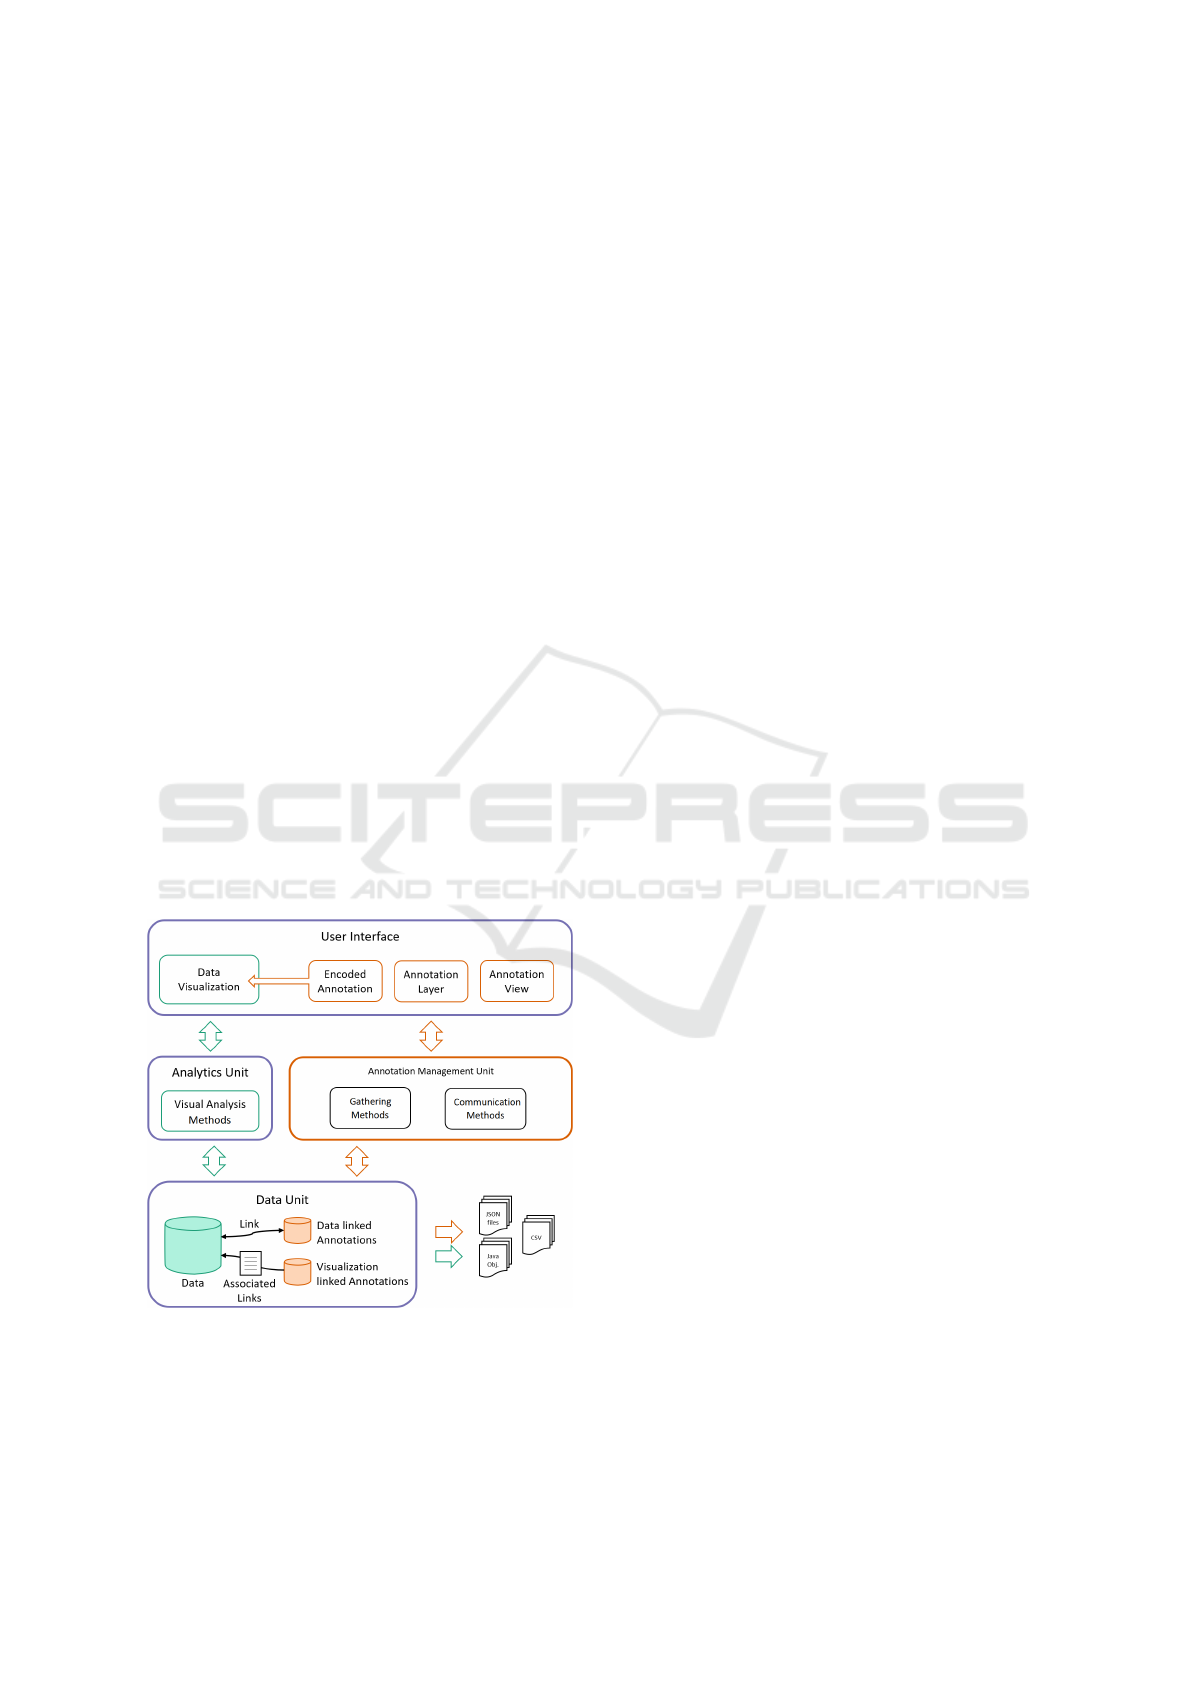
Figure 8: The extended high level architecture of the tool
with additional annotation functionality.
The extended architecture of the tool is shown in
Figure 8. We add an annotation unit and annotation
functionality (orange) to the existing units (purple)
and existing functionality (green). Due to the mod-
ularized architecture of the existing tool, the integra-
tion of the additional annotation management unit can
be easily integrated. For the visualization- and data-
integrated annotation-functions, we alter the existing
units.
Our extensions in the data unit encompass the
setup and processing of the annotation structures,
including the interplay with the original data (Fig-
ure 8 lower left). To distinguish between data and
annotations, we set up two additional internal data
structures, one for data linked annotations and one for
visualization linked annotations.
The added annotation management unit is respon-
sible for the annotation management within the sys-
tem. It receives and structures the annotation infor-
mation from the user interface unit and sends it to
the data unit for storage. Conversely, it requests the
necessary information from the data management unit
and forwards it to the user interface unit or to the file
system for externalization.
The extended user interface unit (Figure 8 top)
contains the original data visualization functionality
together with additional screen management func-
tions. These ensure the appearance of the annotations
dependent on their characteristics and the current step
in the analysis.
Concerning the interaction, we introduce a ded-
icated annotation interaction function (right mouse
button) for all visualizations to ensure consistency for
better usability. With this dedicated interaction event,
we are able to implement all annotation interaction
functionality independently from the existing event
management.
In summary, the extended tool allows annotation-
enhanced data preprocessing, -cleansing, and -
exploration of real-world data.
5 USE CASE AND EXPERT
FEEDBACK
Our use case is situated in the medical domain. The
data stem from an ophthalmic clinic, where about
3,600 patients were diagnosed with different macula
diseases. The macula is located in the rear of the eye
and responsible for sharp and detailed vision.
The goal of the experts is to first convert the raw
data into a structured and cleansed data-set. Second,
they want to filter all patients that had a particular
change in therapy, such as an altering of the medi-
cation used. As the data were derived from various
clinical systems and are comprised of various dimen-
sions, they are heterogeneous and erroneous.
Annotations in Different Steps of Visual Analytics
161

This leads to the tasks to (i) allow the program to
do as much automatically as possible, (ii) share the
remaining work with different experts with different
levels of qualification and knowledge on the data, and
(iii) be always informed on the actions taken to keep
the control over the data and the analysis results.
To assess our solution in terms of its ability to
perform the tasks, we arranged two user sessions in
combination with several interviews and discussions
of results with the experts.
The first user session was dedicated to the data
preprocessing and data cleansing step. The session
was designed as a collaborative session with one do-
main expert and one visualization expert. Combining
the domain knowledge with the tool and visualization
knowledge helped to avoid misunderstandings in the
tool usage.
Data from roughly 200 patients were preprocessed
and cleansed. The domain expert appreciated the au-
tomatic preprocessing functions in combination with
the automatic annotations. He said that the additional
information on the sources of a data point allowed to
understand from which sources the data value came
from and how the system made its decision on the
chosen value. If that process would have to be done
in the conventional way, the time needed would have
severely increased. Yet, due to the annotations, the
domain expert trusted the consolidated data. Addi-
tionally, the domain expert saw in the preprocess-
ing annotations that many data discrepancies can be
routed to the text mining source. The text mining al-
gorithm, as described by Grundel et al. (2020), was
conveniently able to identify and extract the visual
acuity values within the doctoral letters for a specific
appointment. As doctors tend to note also the last
visual acuity value from the previous visit, the text
mining source often also contained that information,
leading to discrepancies, as the value often differed
from the current one. Due to that finding, the consol-
idation rules for automatic data preprocessing could
be updated, so that the visual acuity value could be
assigned to the correct date. This generated an addi-
tional redundant source for visual acuity values, in-
creasing its validity.
For the cleansing step, the domain expert concen-
trated on the validation and correction of specific in-
jections with a certain medication, as he knew that in
some cases the data had missing values or false en-
tries. To test the cleansing annotations, the visualiza-
tion expert applied an eight hour session of adding
missing values and verifying the mentioned existing
injections in reference to rules provided by the ex-
pert for 500 patients. Based on the cleansed data, the
domain expert applied a one hour session to validate
the work. By using the annotations, which provided
him with information on where and by whom what
change has been made, the domain expert stated that
he could easily see and judge the changes and, if nec-
essary, correct the cleansing actions taken. In doing
so, the expert noticed an increasing risk of copying
errors in the data, as visual acuity values are not al-
ways automatically transferred to the doctoral letter,
but sometimes are copied by hand.
The second session was dedicated to the data ex-
ploration and lasted roughly three hours. The set-up
again was the application of the extended tool by one
domain expert and one visualization expert with a part
time support of a second domain expert.
The domain experts noted that especially the use
of pre-defined comments was helpful. They first
marked a specific patient and then assigned a stan-
dardized comment, which can be seen as some form
of classification. In doing so, the domain experts
could divide the patients into different groups, such as
patients with successful, indifferent, and less success-
ful therapy changes. Finally, they used externalization
of the therapy change results, which allowed them to
use familiar tools for further aggregations and exami-
nations.
6 CONCLUSION
With our approach we have shown that annotations
can support different steps in visual analytics, if
they are individually characterized and customized
for each phase. We created (i) automatic annotations
for data preprocessing, (ii) semi-automatic annota-
tions for data cleansing, and (iii) manual annotations
for data explorations. By providing transparency on
the circumstances of data structuring, cleansing, as
well as exploration results, we allowed users to al-
ways be informed.
Even though we use our concept on clinical data
from ophthalmology, we see the possibility to apply it
to other scenarios. It would be interesting to investi-
gate to what extend our concept would require amend-
ment on other scenarios. Hereby, general suggestions
for the use of specific annotation designs in visual an-
alytics could be developed. Finally, we would like to
examine annotations that support the remaining steps
in visual analytics, such as the validation and knowl-
edge generation step.
IVAPP 2021 - 12th International Conference on Information Visualization Theory and Applications
162

ACKNOWLEDGEMENTS
This work has been supported by the German Federal
Ministry of Education and Research (Project TOPOs).
REFERENCES
Groth, D. and Streefkerk, K. (2006). Provenance and
annotation for visual exploration systems. IEEE
Transactions on Visualization and Computer Graph-
ics, 12(6):1500–1510.
Grundel, B., Bernardeau, M.-A., Langner, H., Schmidt, C.,
B
¨
ohringer, D., Ritter, M., Rosenthal, P., Grandjean,
A., Schulz, S., Daumke, P., and Stahl, A. (2020).
Merkmalsextraktion aus klinischen routinedaten mit-
tels text-mining. Der Ophthalmologe.
Gschwandtner, T., Aigner, W., Miksch, S., G
¨
artner, J.,
Kriglstein, S., Pohl, M., and Suchy, N. (2014). Time-
Cleanser: A Visual Analytics Approach for Data
Cleansing of Time-Oriented Data. In Proceedings of
the i-KNOW ’14.
Gschwandtner, T., G
¨
artner, J., Aigner, W., and Miksch,
S. (2012). A taxonomy of dirty time-oriented data.
In Multidisciplinary Research and Practice for In-
formation Systems, pages 58–72, Berlin, Heidelberg.
Springer.
Heer, J., Vi
´
egas, F. B., and Wattenberg, M. (2007). Voy-
agers and voyeurs: Supporting asynchronous collabo-
rative information visualization. In Proceedings of the
SIGCHI Conference on Human Factors in Computing
Systems, CHI ’07, pages 1029–1038, New York, NY,
USA.
Jin, Y., Li, J., Ma, D., Guo, X., and Yu, H. (2017). A semi-
automatic annotation technology for traffic scene im-
age labeling based on deep learning preprocessing. In
2017 IEEE International CSE and IEEE International
Confernece on EUC, pages 315–320.
Kr
¨
uger, R., Herr, D., Haag, F., and Ertl, T. (2015). Inspec-
tor Gadget: Integrating Data Preprocessing and Or-
chestration in the Visual Analysis Loop. In EuroVis
Workshop on Visual Analytics (EuroVA).
Krishnan, S., Haas, D., Franklin, M. J., and Wu, E. (2016).
Towards reliable interactive data cleaning: A user
survey and recommendations. In Proceedings of
the Workshop on Human-In-the-Loop Data Analytics,
pages 9:1–9:5, New York, NY, USA. ACM.
Lakiotaki, K., Vorniotakis, N., Tsagris, M., Georgakopou-
los, G., and Tsamardinos, I. (2018). BioDataome:
a collection of uniformly preprocessed and auto-
matically annotated datasets for data-driven biology.
Database, 2018.
Lipford, H. R., Stukes, F., Dou, W., Hawkins, M. E., and
Chang, R. (2010). Helping users recall their reasoning
process. In 2010 IEEE Symposium on Visual Analytics
Science and Technology, pages 187–194.
Mahyar, N., Sarvghad, A., and Tory, M. (2012). Note-
taking in co-located collaborative visual analytics:
Analysis of an observational study. Information Vi-
sualization, 11:190–204.
Mahyar, N. and Tory, M. (2014). Supporting communi-
cation and coordination in collaborative sensemak-
ing. IEEE Transactions on Visualization and Com-
puter Graphics, 20:1633–1642.
McCurdy, N., Gerdes, J., and Meyer, M. (2019). A frame-
work for externalizing implicit error using visualiza-
tion. IEEE Transactions on Visualization and Com-
puter Graphics, 25:925–935.
M
¨
uller, H. and Freytag, J. C. (2003). Problems, meth-
ods, and challenges in comprehensive data cleansing.
Humboldt-Universit
¨
at zu Berlin, 10099.
Sacha, D., Stoffel, A., Stoffel, F., Kwon, B. C., Ellis, G., and
Keim, D. A. (2014). Knowledge generation model for
visual analytics. IEEE Transactions on Visualization
and Computer Graphics, 20:1604–1613.
Saur
´
ı, R. (2017). Building FactBank or How to Annotate
Event Factuality One Step at a Time, pages 905–939.
Springer Netherlands, Dordrecht.
Schmidt, C., R
¨
ohlig, M., Grundel, B., Daumke, P., Rit-
ter, M., Stahl, A., Rosenthal, P., and Schumann, H.
(2019). Combining visual cleansing and exploration
for clinical data. In 2019 IEEE Workshop on Visual
Analytics in Healthcare (VAHC), pages 25–32.
Schmidt, C., Rosenthal, P., and Schumann, H. (2018). An-
notations as a support for knowledge generation - sup-
porting visual analytics in the field of ophthalmology.
In Proceedings of the 13
th
International Joint Con-
ference on Computer Vision, Imaging and Computer
Graphics Theory and Applications, pages 264–272.
SCITEPRESS - Science and Technology Publications.
Shabana, K. M. and Wilson, J. (2015). A novel method for
automatic discovery, annotation and interactive visu-
alization of prominent clusters in mobile subscriber
datasets. In 2015 IEEE 9
th
International Confer-
ence on Research Challenges in Information Science
(RCIS), pages 127–132.
Vanhulst, P.,
´
Ev
´
equoz, F., Tuor, R., and Lalanne, D. (2018).
Designing a classification for user-authored annota-
tions in data visualization. In Proceedings of the
13th International Joint Conference on Computer Vi-
sion, Imaging and Computer Graphics Theory and
Applications - Volume 2 : IVAPP,, pages 85–96.
SCITEPRESS - Science and Technology Publications.
Willett, W., Heer, J., Hellerstein, J., and Agrawala, M.
(2011). Commentspace: Structured support for col-
laborative visual analysis. In Proceedings of the
SIGCHI Conference on Human Factors in Computing
Systems, pages 3131–3140. ACM.
Zhao, J., Gl uck, M., Isenberg, P., Chevalier, F., and
Khan, A. (2018). Supporting handoff in asynchronous
collaborative sensemaking using knowledge-transfer
graphs. IEEE Transactions on Visualization and Com-
puter Graphics, 24:340–350.
Zhao, J., Glueck, M., Breslav, S., Chevalier, F., and Khan,
A. (2017). Annotation graphs: A graph-based vi-
sualization for meta-analysis of data based on user-
authored annotations. IEEE Transactions on Visual-
ization and Computer Graphics, 23:261–270.
Annotations in Different Steps of Visual Analytics
163
