
Effectiveness of Comments on Self-reflection Sheet in Predicting
Student Performance
Rumiko Azuma
College of Commerce, Nihon University, Setagaya-ku, Tokyo, Japan
Keywords: Learning Analytics, Machine Learning, Text Mining, Educational Support, Reflection Sheet.
Abstract: In recent years, schools and universities have become more focused on how to allow learners to learn
successfully, and it has become an expectation to design instruction in a way that takes into account the
individual differences of learners. Accordingly, the purpose of this study is to predict, at an earlier stage in a
course, which students are likely to fail, so that adequate support can be provided for them. We proposed a
new approach to identify such students using free-response self-reflection sheets. This method uses the
unrestricted comments from the students to create a comment vector that can be used to predict who are likely
to fail the course. Subsequently, we conducted experiments to verify the effectiveness of this prediction. In
comparison to methods used in existing research which predict potential failures using quiz scores and the
students’ subjective level of understanding, our proposed method was able to improve the prediction
performance. In addition, when cumulative data after several sessions were used to predict which students
were likely to fail, the predictions made by the support vector machine (SVM) algorithm showed a consistent
prediction performance, and the prediction accuracy was higher than that of other algorithms.
1 INTRODUCTION
Recently, Learning Analytics (LA) that is a study of
estimating or predicting learners' performance
through Learning Management System (LMS) or e-
learning system has been actively performed (Hirose,
2019a). The most common use of LA is to identify
students who appear less likely to succeed
academically and to enable targeted interventions to
help them achieve better outcomes (Scapin, 2018).
Providing some kind of feedback to the learners based
on the analysis results in LA enable learners to take
learning support tailored to each learner. It offers
promise for predicting and improving learners
success and retention (Uhler et al., 2013).
On the other hand, a decline in academic ability of
university students has become a problem in Japan,
and universities are required to find students who
cannot keep up with classes at an early stage and
follow them up. Therefore, it is important for
educational institutions to predict the student's real
understanding level or their grade from the student's
learning data by LA.
In many Japanese universities, students’ class
evaluation questionnaire is adopted as one of the
methods for measuring students' understanding level.
The questionnaire is for students to evaluate their
subjective understanding level, their attitude towards
class, lecturer and class contents. However, student’s
subjective evaluations often do not reflect the
student's real understanding level or learning
conditions (Azuma, 2016). In addition, since the
questionnaire is often conducted at the final lesson, it
serves to improve the future offering of the class than
to provide feedback to the student. For these reasons,
in order to measure the level of understanding and
satisfaction of students in a class, the lecturers
increase the frequency of questionnaire conducting
surveys with.
One of the methods for lecturers to grasp students'
level understanding and satisfaction is “a minute
paper” (Davis et al., 1983). “A minute paper” is
defined as a very short comment of a student, in-class
writing activity (taking one minute or less to
complete). It prompts students to reflect on the day’s
lesson and provides the lecturer with useful feedback.
In this study, we propose a method to predict
students who have a risk of failing course from their
comments in self-reflection sheets like “a minute
paper”. The purpose of this study is to improve the
student's learning behavior by predicting the student's
grade and providing useful feedback to the student. In
394
Azuma, R.
Effectiveness of Comments on Self-reflection Sheet in Predicting Student Performance.
DOI: 10.5220/0010197503940400
In Proceedings of the 10th International Conference on Operations Research and Enterprise Systems (ICORES 2021), pages 394-400
ISBN: 978-989-758-485-5
Copyright
c
2021 by SCITEPRESS – Science and Technology Publications, Lda. All rights reserved

addition, lecturers could quickly find out students
with low level understanding and provide
personalized advice.
2 RELATED STUDIES
It is very important for both learner and lecturer to
grasp learner's performance because feedback of the
information obtained from these can help improve
their learning.
Hirose (2018, 2019a) analyzed the accumulated
weekly testing results to identify students who may
fail in the final examination, using item response
theory. He also proposed a method with high
predictive accuracy which predicts the risk for failing
courses and/or dropping out for students using the
learning check testing scores, the follow-up program
testing success/failure times, and attendance rate
(Hirose, 2019b). Although the subjects dealt with in
his paper are limited to mathematics, it describes this
kind of system will easily be applied to other subjects.
On the other hand, there are several studies which
predict student performance based on student
comments in the lesson. Sorour et al., (2014, 2015)
proposed the model to predict university students’
grade from their comments written according to the
PCN method. Their paper describes that they can
clearly distinguish high score group, but the
prediction accuracy of lower score group became
lower. The PCN method (Goda et al., 2011)
categorizes student comments into three items of
P(previous), C(current) and N(next). Item P is
learning activities for preparation of a lesson such as
review of previous class. Item C is understanding of
the lesson and learning attitudes to the lesson. Item N
is the learning activity plan until the next lesson. Luo
(Luo et al., 2015) discussed the prediction method of
student grade based on the comments of item C using
Word2Vec and Artificial Neural Network. Their
study expressed the correlation between self-
evaluation descriptive sentences and academic
performance. Niiya and Mine (2017) also verified the
accuracy of model which predicts junior high school
students score from their comments based on the PCN
method.
However, students' freestyle comments such as
the minute paper used in universities often do not
limit what is written because it is effective for
increasing student satisfaction. It is different from
student's comments using PCN with limited writing
content. This study discusses a method that be able to
predict students' final examination score (pass or fail)
using the reflection sheets based on "a minute paper".
An aim of this study is to quickly find students who
may fail in the course and give them feedback.
Therefore, we consider the method that does not
predict their score or grade, but predicts the
possibility of whether they will fail in the final
examination.
3 OVERVIEW OF STUDENTS'
DATA
In previous study (Azuma, 2017), we tried to predict
student's final exam score by multiple regression
analysis based on student's understanding level,
background knowledge level, quiz scores, and
reflection sheets. Regarding the reflection sheet, the
number of characters and technical terms extracted
from the reflection sheets were used quantitatively as
independent variables. The final model had a
coefficient of multiple determination, R
2
, of 0.211
(p<0.001), and predictive accuracy was low.
In this study, we used 193 university students’
data for 3 years (from 2012 to 2014) that is data from
the previous study (Azuma, 2017) plus new data.
Then, we discuss the prediction model using machine
learning algorithms.
This study’s data were collected from 13 lessons
of “basic statistics” course in three years. The
reflection sheet is a freestyle comment sheet that
students can write freely about things they have
learned, noticed, understood, did not understand,
questions, requests, etc. Number of reflection sheets
is 2501 and number of sentences is 6051. Mean of
characters per sheet is 87.35, maximum of it 686, and
minimum of it 6. This study uses the following data
except student’s background knowledge level
because of very weak correlation with student's score.
Score of final examination
Score of quizzes
Understanding level for a lesson (5-level
evaluation based on student's subjectivity)
Comments in reflection sheets (Japanese)
To predict failed student from these data, we
classified final examination score to two categories
such as “Passed” or “Failed”. Table 1 shows a
corresponding relation between the categories and the
scores. Scores less than 60 were classified as the
Failed group, and others were classified as the Passed
group. Table 2 shows the summary statistics of
examination score. The correlation coefficient
between the final score and each features is shown in
Table 3.
Effectiveness of Comments on Self-reflection Sheet in Predicting Student Performance
395
Table 1: The corresponding relation between the categories
and the range of examination scores.
Category Passed Failed
Score 60~100 0~59
Grade S, A, B, C D
Number of students 129 64
Table 2: The summary statistics of examination scores.
Mean 63.63
Standard deviation 21.83
Max 100
Min 1
Rate of Failed students 0.33
Table 3: The correlation coefficient between the final score
and each features (p<0.01).
Score of quizzes 0.35
Understandin
g
level 0.24
Comments in reflection sheets
Num. of characters 0.31
Num. of technical terms 0.33
4 PREDICTION
METHODOLOGY OF FAILED
STUDENT
4.1 Prediction Methodology using Four
Features
In the previous study (Azuma, 2017), it was clarified
that students with high score tend to have more
comments and technical terms in the reflection sheet,
although a weak positive correlation with students’
score. Therefore, first of all, we selected the number
of characters and technical terms in comments, the
quiz scores and the understanding level as features to
predict. Each value was the average of 13 lessons.
4.1.1 Performance Measures of Failed
Student Prediction
The ML models used in the prediction are followings:
Decision Tree (DT), Random Forest (RF), Support
Vector Machine (SVM), Logistic Regression (LR),
Generalized Linear Model (GLM), and Naive Bayes
(NB).
We evaluated the performance of each machine
learning (ML) models by 10-fold cross validation
using four features. We randomly separated dataset to
training and test data set, taking into account the
balance of the categories so that they are the same as
the original dataset. 80% of the data is randomly
assigned to the training data and the remaining 20%
is assigned to the test data.
Table 4: The confusion matrix.
Actual value
1 0
Predicted
outcome
1 T
P
F
P
0 F
N
T
N
Table 5: The prediction results of “Failed” by basic
method.
ML
Mo
d
el
Precision Recall F-measure Accuracy
DT 1.000 0.071 0.133 0.675
RF 0.500 0.285 0.333 0.650
SVM 0.400 0.285 0.333 0.600
LR 0.400 0.285 0.333 0.600
GLM 0.400 0.285 0.333 0.600
NB 0.571 0.571 0.571 0.700
The experiment results show the test accuracy and
F-measure for each of the models. These values are
defined using TP (True Positive), FP (False Positive),
TN (True Negative), FN (False Negative) in Table 4
as follows:
𝑝𝑟𝑒𝑐𝑖𝑠𝑖𝑜𝑛 =
𝑇𝑃
(
𝑇𝑃 + 𝐹𝑃
)
(1)
𝑟𝑒𝑐𝑎𝑙𝑙 =
𝑇𝑃
(
𝑇𝑃 + 𝐹𝑁
)
(2)
𝐹𝑚𝑒𝑎𝑠𝑢𝑟𝑒= 2×
(𝑝𝑟𝑒𝑐𝑖𝑠𝑖𝑜𝑛 × 𝑟𝑒𝑐𝑎𝑙𝑙)
(
𝑝𝑟𝑒𝑐𝑖𝑠𝑖𝑜𝑛 + 𝑟𝑒𝑐𝑎𝑙𝑙
)
(3)
𝐴𝑐𝑐𝑢𝑟𝑎𝑐𝑦 =
𝑇𝑃 + 𝐹𝑁
𝑇𝑃 + 𝑇𝑁 + 𝐹𝑃 + 𝐹𝑁
(4)
Recall tells us how confident we can be that all the
instances with the positive target level have been
found by the model. Precision tells us how confident
we can be that an instance predicted to have the
positive target level actually has the positive target
level (Kelleher et al., 2015). In this study, “Failed”
students are the positive target. F-measure is the
harmonic mean of precision and recall and offers a
useful alternative to the simpler misclassification rate.
It reaches its best value at 1 and worst score at 0.
4.1.2 Prediction Results using ML
The prediction results using four features are shown
in Table 5. We call this method the basic method.
ICORES 2021 - 10th International Conference on Operations Research and Enterprise Systems
396
Precision, Recall, and F-measure in Table 5 are
values when "Failed" is the positive target.
Although accuracies were over 60% in all models,
all F-measure scores were low. As for accuracy and
F-measure, the results of NB were the highest, which
scores 70.0% and 57.1%.
4.2 Prediction Methodology by
Quantification of Student
Comments
We analyzed quantitatively student comments in
reflection sheets using KHcoder (Higuchi, 2004). KH
Coder is software for quantitative content analysis or
text mining. KHcoder supports multilingual analysis.
The number of analysis target words extracted by
KHcoder was 123046 in this study. The average of
words used per sheet was 43.9. In this section, we
describe a method for treating student comments as
features.
4.2.1 Creating a Comment Vector
We assigned some labels to sentences of student
comment containing specific words that were
extracted by correspondence analysis. Each label was
defined as shown in Table 6.
“Positive Understanding” means whether or not a
phrase indicating understanding is included in the
student's comment. For example, if a student's
comment contains the sentence “I understood today's
lesson”, the comment was labeled the PU-. On the
other hand, if a technical term is included, such as “I
understood about the Bayes' theorem”, the comment
was labeled the PU+.
Similarly, "Negative Understanding" means a
comment with a phrase that expresses what student
could not understand. For example, if a comment
contains a technical term such as “I did not
understand the conditional probability well”, the
comment was labeled NU+, and otherwise NU-. In
addition, seven labels including “Negative Words”,
“Vagueness Words”, and “phrase for Expressing
Willingness” were assigned to each sentence.
Moreover, it was allowed to be assigned multiple
labels to one sentence. A sentence like "I did not
understand today's lesson because it was difficult"
was labeled NU- and NW. Then we counted the
number of sentences for each label and created a 7-
dimensional comment vector that has the number of
occurrences of each label as elements, for each
student. The correlation coefficient between each
element of comment vector and the number of
characters or technical terms are shown in Table 7. In
addition to 4 features of the previous section, the
comment vector and the number of words were added
as features to improve predictive accuracy.
Table 6: The kinds of label associated with specific words.
Meaning Label
Specific words
Positive Understanding
co-occurrence with
technical terms
PU+
I understood xxxx,
I got xxxx
no co-occurrence with
technical terms
PU-
Negative Understanding
co-occurrence with
technical te
r
ms
NU+
I could not
understand xxx,
I am not sure xxx
no co-occurrence with
technical terms
NU-
Negative Words NW
difficult, many,
poor, tough,
anxiety, forget
Vagueness Words VW
feel, to an extent,
a little
phrase for Expressing
Willingness
EW
I want to,
I need to,
I have to
Table 7: The correlation coefficient between each element
of comment vector and the number of characters or
technical terms (p < 0.01).
PU+ PU- NU+ NU- NW VW EW
Characters
0.41 0.23 0.30 0.41 0.40 0.30 0.50
Technical
terms
0.43 -0.01 0.19 0.25 0.12 0.02 0.33
4.2.2 Prediction Results using Comment
Vector
The results predicted by the dataset including the
comment vectors are shown in Table 8. For all models
except DT and NB models, F-measure and accuracy
were increased. In particular, the F-measure of RF
model was the highest score and was improved from
33.3% to 58.3% compared to the basic method. The
F-measure score of NB also improved slightly from
57.1% to 57.8% in this method, but accuracy, which
was the highest in the basic method, was declined
from 70.0% to 66.0%.
4.3 Prediction of Potential Students of
Failed Examination
4.3.1 Category of Potential Students
Next, students with grades C or D, less than 70 score
are regarded as a “problem” group. We calculated the
prediction performance of “problem” students. Table
Effectiveness of Comments on Self-reflection Sheet in Predicting Student Performance
397
9 displays a corresponding relation between new
categories and the range of scores.
Table 8: The prediction results of “Failed” by comment
vector + basic method.
ML
Mo
d
el
Precision Recall F-measure Accuracy
DT 0.500 0.062 0.111 0.600
RF 0.875 0.437 0.583 0.750
SVM 0.545 0.375 0.444 0.625
LR 0.666 0.375 0.480 0.675
GLM 0.714 0.312 0.434 0.675
NB 0.500 0.687 0.578 0.660
Table 9: The corresponding relation between new
categories and the range of examination scores.
Category No problem Problem
Score 70~100 0~69
Grade S, A, B C, D
Number of students 88 105
Table 10: The prediction results of “Problem” students by
comment vector + basic method.
ML
Mo
d
el
Precision Recall F-measure Accuracy
DT 0.615 1.000 0.761 0.625
RF 0.700 0.875 0.777 0.700
SVM 0.724 0.875 0.792 0.725
LR 0.720 0.750 0.734 0.675
GLM 0.714 0.833 0.769 0.700
NB 0.700 0.875 0.777 0.700
Table 11: The prediction results of “Problem” students
using only data of reflection sheets.
ML
Mo
d
el
Precision Recall F-measure Accuracy
DT 0.615 1.000 0.761 0.625
RF 0.666 0.833 0.740 0.650
SVM 0.656 0.875 0.750 0.650
LR 0.740 0.833 0.784 0.725
GLM 0.714 0.833 0.769 0.700
NB 0.700 0.875 0.777 0.700
4.3.2 Prediction Results by New Category
Students of category "Problem" were predicted using
features, which the understanding level, quiz score,
number of characters, number of technical terms, the
number of words, and comment vector, as well as in
section 4.2. The prediction results are shown in Table
10.
As for F-measure and accuracy, the result of SVM
model was the highest, which scores 79.2% and
72.5%. In all models, the F-measure scores were over
70%. RF, which had the highest predictive accuracy
in the previous section (the prediction of “Failed”
students), was the second highest accuracy in this
case.
4.3.3 Prediction Results using Only
Reflection Sheets
Since the purpose of this study is to predict the failure
by using only the student's comments, we also
checked performance for prediction of "Problem"
students using only data of reflection sheets; those are
the comment vector, the number of characters, and
the number of technical terms, the number of words.
Table 11 shows the results. In all models, its F-
measure scores were more than 70%. The result of LR
model was the highest, with F-measure score 78.4%
and accuracy 72.5%. Secondly, the results of NB
were better, with F-measure score 77.7% and
accuracy 70.0%. Those scores in the DT model did
not change.
We compared this results with the results of the
method added comment vector to the basic method in
prediction of “Problem”. As shown in Figure 1, in
LR, GLM, and NB, prediction performances of the
method using only data of reflection sheets were
better or equal to the method with comment vector
added to the basic method. In the other three
algorithms, adding the comment vector to the basic
method had higher accuracy and F-measure.
Therefore, we can see that it is possible to predict
potential students of failed examination only with the
reflection sheets depending on the machine learning
algorithm.
4.4 Prediction Results using
Cumulative Data from Prior Weeks
Finally, we examined the performance of the
prediction of potential students who may fail using
cumulative weekly data.
All weeks (1-13) training data was used to
construct the SVM and LR models, which had higher
predictive performance on the comment vector. Then,
the model was evaluated on cumulative data from
each weeks labeled as test data.
The results are shown in Figure 2 and 3. In both
figures, the x-axis represents the cumulative test data
from week 1 to n. For example, the 1-3 on x-axis
shows the prediction result using average of students’
data from week 1 to 3. Figure 2 displays the plot of
results with the comment vector and basic method.
ICORES 2021 - 10th International Conference on Operations Research and Enterprise Systems
398
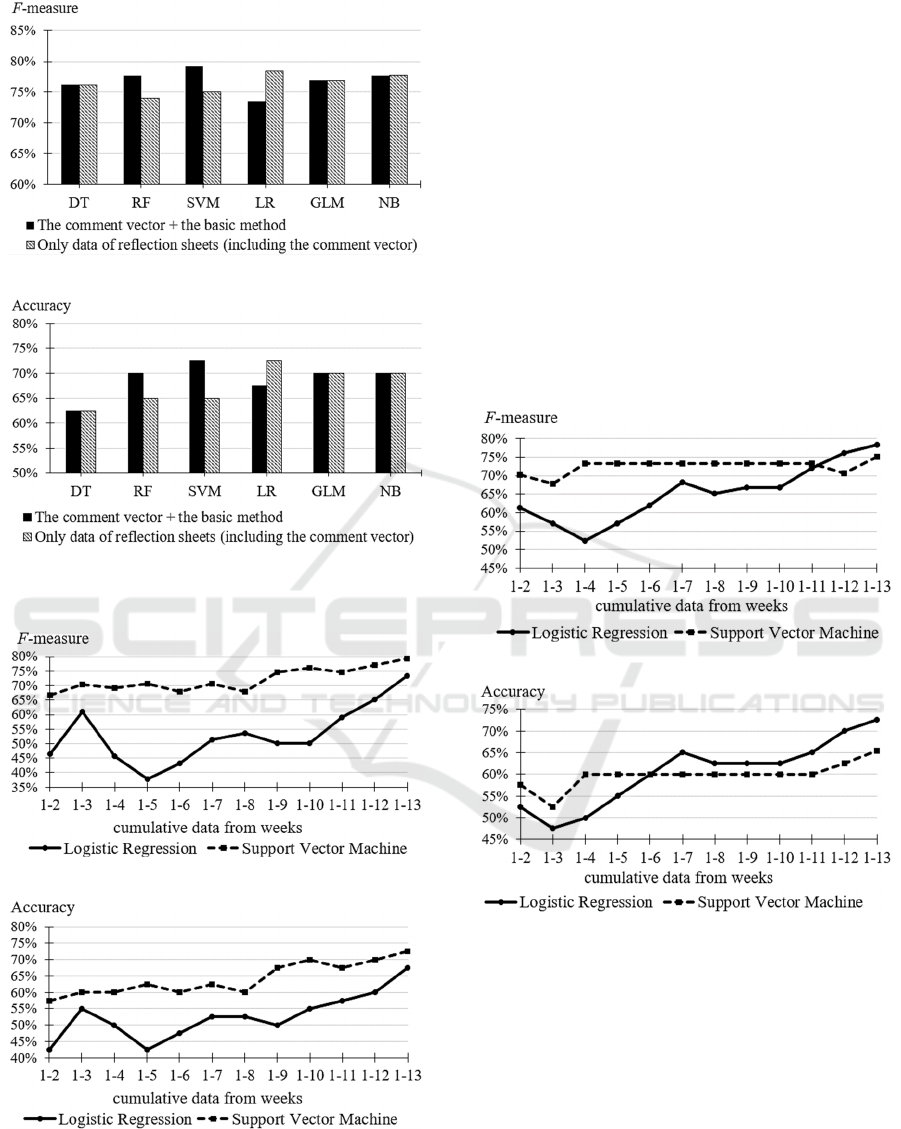
(a) Comparison of F-measure scores in prediction results.
(b) Comparison of accuracies in prediction results.
Figure 1: Comparison of the results of Tab. 8 with Tab. 9.
(a) F-measure using the comment vector + basic method.
(b) Accuracy using the comment vector + basic method.
Figure 2: The prediction results of “Problem” students
using the comment vector + basic method in each week.
The used model is constructed from all weeks (1-13) data.
Similarly, Figure 3 shows the test accuracy based
on reflection sheets including the comment vector.
As shown in Figure 2 and 3, SVM showed
consistent prediction performance on both the test
sets. Unlike SVM, LR had a higher variance in
accuracy of the prediction results, for instance with
comment vector and basic method the F-measure
ranged from 37.8% to 73.4%. As the number of
weeks progressed, the prediction accuracy improved.
This is to be expected as the learning algorithm is
given more data points which gives a better reflection
of the level of student’s understanding of concepts. It
is worth highlighting that half way into the semester,
SVM achieves at least 60% accuracy in identifying
“problem” students. This is very useful in instituting
remedial help for these at-risk students in the second
half of the semester.
(a) F-measure using only the data of reflection sheets.
(b) Accuracy using only the data of reflection sheets.
Figure 3: The prediction results using of “Problem”
students only the data of reflection sheets in each week. The
used model is constructed from all weeks (1-13) data.
5 CONCLUSIONS AND FUTURE
WORK
In this study, we proposed the method to predict
students who may fail the examination using
reflection sheets. In addition to conventional features
of the previous study, adding the comment vector
Effectiveness of Comments on Self-reflection Sheet in Predicting Student Performance
399

extracted from the reflection sheets to features
improved the prediction performance. Moreover, the
prediction using only the reflection sheets did not
significantly reduce the accuracy. Therefore, we
believe the comment vector is an effective feature to
predict failing students.
Furthermore, we examined the performance using
cumulative weekly students’ data on the prediction of
potential students who may fail. As the result based
on models constructed from all data, the prediction by
support vector machine (SVM) was relatively stable.
The prediction with only the data of reflection sheets
showed lower accuracy than one including basic
method, but the F-measure, which is a predictive
measure for "Problem" students, was around 70%. In
order to predict "Problem" students with high
accuracy at an early stage, improvements in the
method are needed.
Another issue is whether this method can also be
applied to other courses in the prediction of failed
student. Also, it is necessary to examine a comment
vector or factors (McKenzie et al., 2001) more
strongly associated with predicting academic
performance than the labels defined in this study,
through data mining. Furthermore, we need to
consider about predicting student performance from
English comments using our proposed method. In the
future, we will try to investigate these issues.
REFERENCES
Azuma, R., 2016. Analysis of the Students' Level of
Understanding using Reflective Sheet. The 41st
conference of Japanese Society for Information and
Systems in Education, PP.263-264.
Azuma, R., 2017. Analysis of Relationship between
Learner's Characteristics and Level of Understanding
using Text-mining. The 42nd annual conference of
Japanese Society for Information and Systems in
Education, PP.73-74.
Davis, B. G., Wood, L., Wilson, R. C., 1983. ABCs of
teaching with excellence. Berkeley: University of
California.
Goda K., Mine T., 2011. Analysis of Students’ Learning
Activities through Quantifying Time-Series
Comments. International Conference on Knowledge-
Based and Intelligent Information and Engineering
Systems, KES 2011, PP.154-164.
Higuchi, K., 2004. Quantitative Analysis of Textual Data:
Differentiation and Coordination of Two Approaches.
Journal of Sociological Theory and Methods, 19(1),
PP.101-115. Japanese Association for Mathematical
Sociology.
Hirose, H., 2018. Difference Between Successful and
Failed Students Learned from Analytics of Weekly
Learning Check Testing. Information Engineering
Express, Vol.4, No.1, PP.11 – 21. IIAI Publications.
Hirose, H., 2019a. Prediction of Success or Failure for Final
Examination using Nearest Neighbor Method to the
Trend of Weekly Online Testing. International Journal
of Learning Technologies and Learning Environments,
Vol. 2, No. 1, PP.19 – 34.
Hirose, H., 2019b. Key Factor Not to Drop Out is to Attend
the Lecture. Information Engineering Express, Vol.5,
No.1, PP.59 – 72. IIAI Publications.
Kelleher, J. D., Namee, B. M., D’Arcy, A., 2015.
Fundamentals of Machine Learning for Predictive
Data Analytics, The MIT Press. Cambridge,
Massachusetts London, England.
Luo, J., Sorour, E. S., Goda, K., Mine, T., 2015. Predicting
Student Grade based on Free-style Comments using
Word2Vec and ANN by Considering Prediction
Results Obtained in Consecutive Lessons. The 8
th
International Conference on Educational Data Mining
(EDM). International Educational Data Mining Society.
Niiya, I., Mine, T., 2017. Comment mining to estimate
junior high-school student performance toward
improvement of student learning. IPSJ SIG Technical
Report. The Information Processing Society of Japan.
Scapin, R., 2018. Learning Analytics: How to Use
Students’ Big Data to Improve Teaching. Article of
Vitrine technologie-éducation. https://www.
vteducation.org/en/articles.
Sorour, S. E., Mine, T., Goda, K., Hirokawa, S., 2014.
Examining students' performance based on their
comments data using machine learning technique. Joint
Conference of Electrical and Electronics Engineers in
Kyushu, P.350.
Sorour, S. E., Mine, T., Goda, K., Hirokawa, S., 2015. A
predictive model to evaluate student performance.
Journal of Information Processing, Volume 23, Issue 2,
PP.192-201. The Information Processing Society of
Japan.
Uhler, D. B., Hurn, E. J., 2013. Using Learning Analytics
to Predict (and Improve) Student Success: A Faculty
Perspective. Journal of Interactive Online Learning,
Volume 12, Number 1.
Kirsten McKenzie and Robert Schweitzer, 2001. Who
Succeeds at University? Factors predicting academic
performance in first year Australian university students,
Higher Education Research and Development, 20(1),
PP.21-33.
ICORES 2021 - 10th International Conference on Operations Research and Enterprise Systems
400
