
Wavelet Correlation of Non-stationary Bursts of EEG
S. V. Bozhokin
a
and I. B. Suslova
b
Peter the Great Saint-Petersburg Polytechnic University, Polytechnicheskaya str. 29, Saint-Petersburg, Russia
Keywords: EEG, Continuous Wavelet Transform, Wavelet Correlation Function.
Abstract: The problem of non-stationary correlation of signals recorded in various EEG channels of the human brain
is considered. Each signal is represented as a sequence of bursts occurring at different times in different
spectral ranges. To solve the problem of detecting the relationship of these signals, the authors introduced a
new wavelet correlation function WCF. The WCF function allows you to detect the correlation of individual
bursts of different EEG channels that have the same frequency, but different times of occurrence. The WCF
function is built on the basis of continuous wavelet transforms of two signals taken at different points in
time. For the considered recording data of two EEG channels, the burst correlations were classified. The
proposed solution to the problem of correlation of EEG signals makes it possible to trace the propagation of
disturbances in the cerebral cortex (traveling waves) and to reveal the synchronization of movement of
evoked potentials.
a
https://orcid.org/0000-0001-5653-6574
b
https://orcid.org/0000-0002-4497-1867
1 INTRODUCTION
It is known that human electroencephalogram (EEG)
shows electrical activity of a great number of
neurons in the brain. The signal from each EEG
channel is an alternation of bursts in different
spectral ranges
{}
,, ,μ= δθαβ
. EEG is essentially a
nonstationary process, since its spectral and
statistical properties change over time (Mandel and
Wolf, 1995; Papandreou-Suppappola, 2003; Adeli
and Ghost-Dastidar, 2010; Hramov et al., 2015). The
unsteady character of EEG signal can be observed
both at rest of the subject and during functional tests
(photo-stimulation, hyperventilation).
To analyze changes in the spectral composition
of nonstationary signals (NSs), the windowed
Fourier transform (STFT - Short Time Fourier
Transform) is often used (Subha et al., 2010). In this
case, the entire measurement interval
T
is divided
into a number of consecutive windows, each having
the duration equal to
/WTN=
, where
N
is the
total number of windows. The consistent behavior of
two different processes
()
J
Zt
and
()
K
Zt
recorded
from different EEG channels
J
and
K
is
characterized by the value of coherence. The
coherence of the brain shows the degree of intra-
cortical interactions in different parts of the brain
and the presence of functional relations between
them.
The calculation of the coherence function
includes the averaging of Fourier components of two
signals over many realizations (Kulaichev, 2011;
Sheikhani and Behnam, 2008; Seleznov et al., 2019;
Reiser et al., 2012; Kropotov, 2012; Bendat and
Pierrsol, 2011). Phase coherence of the two signals
is characterized by the value
()
JK
P
LV f
called the
Phase Locking Value (Piqueira, 2011; Trofimov et
al., 2015; Duc et al. 2019). However, we should note
that as shown in (Kulaichev, 2011), the value of the
coherence of two signals depends on the averaging
procedure, choice of the window size, window
function, and the value of the window step shift.
Therefore, the coherence value cannot be
considered as a strict quantitative measure of the
correlation of two signals
()
J
Zt
and
()
K
Zt
, where
J
and
K
are the numbers of EEG channels. In
addition, various computer programs use different
types of windows and numbers of averaging. Thus,
142
Bozhokin, S. and Suslova, I.
Wavelet Correlation of Non-stationary Bursts of EEG.
DOI: 10.5220/0010196701420149
In Proceedings of the 14th International Joint Conference on Biomedical Engineering Systems and Technologies (BIOSTEC 2021) - Volume 4: BIOSIGNALS, pages 142-149
ISBN: 978-989-758-490-9
Copyright
c
2021 by SCITEPRESS – Science and Technology Publications, Lda. All rights reserved

it is difficult to compare the results obtained in the
works of various authors.
The purpose of this work is to find the
correlation of nonstationary signals from different
EEG channels. We introduce the new type of
correlation function, and use it to determine the
matching of various EEG bursts occurring in
different spectral ranges at different points in time.
2 WAVELET CORRELATION
FUNCTION
Currently, the continuous wavelet transform (CWT)
method is often used to quantitatively describe the
nonstationary EEG (Mallat, 2008; Cohen, 2003;
Advances in Wavelet, 2012; Chui and Jiang, 2013;
Addison, 2017; Hramov, 2015; Bozhokin and
Suvorov, 2008; Bozhokin and Suslova, 2014, 2015;
Wavelets in Physics, 2004).
We determine continuous wavelet transform
()
,Vt
ν
for the time-dependent signal
()
Z
t
by the
formula
() () ( )
()
*
,ΨV ν t ν Zt ν ttdt
∞
−∞
′′′
=−
. (1)
The function
()
x
Ψ is a mother wavelet. The * sign
means complex conjugation. The mother wavelet in
(1) has two properties. The average value of
()
x
Ψ
over the entire argument
x
−∞ < < ∞
is zero. The
squared norm
()
2
x
Ψ
is equal to one. The main
types of mother wavelets are given in the book
(Hramov, 2015). In our study we use the Morlet
mother wavelet function
()
x
Ψ with the control
parameter
m
:
() ()
()
2
2
2
exp exp 2 exp
2
mm
x
xD ix
m
Ψ= − π− −Ω
, (2)
where
2
m
mΩ=π . The control parameter
m
allows us to change the spectral and temporal
resolution of the signal under study. The Fourier
component
()
ˆ
F
Ψ of the mother wavelet function
and the normalization constant
m
D
(2) are given in
(Bozhokin et al. 2017). We derive the formula
() () ()
*
ˆ
ˆ
,exp2
f
Vt Zf iftdf
∞
−∞
ν= Ψ π
ν
(3)
by performing twice the Fourier transform of (1).
Here
()
ˆ
Z
f is the Fourier component of the signal
()
Z
t
.
Consider the particular case of an infinite
harmonic signal
()
()
0
cos 2
Z
tft=π with constant
frequency
0
f
. The Fourier component of such a
signal is the superposition of two Dirac delta
functions:
()
()()
00
ˆ
/2Zf f f f f=δ + +δ −
. The
maximum value of
()
,Vt
ν
(1) will be observed
exactly at the frequency value
0
f
ν
=
. For
()
2
exp 2 1
m
−Ω <<
, this maximum will not depend on
time.
Assume that
()
,
J
Vt
ν
corresponds to
()
J
Z
t and
()
,
K
Vt
ν
, − to
()
K
Z
t . The cross wavelet spectrum
of two signals is determined by the formula
() ()()
*
,,,
JK J K
CWS t V t V t
ν
=ν ν
. (4)
By averaging the function
()
,
JK
CWS t
ν
both
over frequencies
ν
and time
t
, and by normalizing
this value, one can obtain the square of the wavelet
coherence function
()
2
,tΓν
. The details of the
averaging procedure for calculating the function
()
2
,tΓν
, as well as its application to various non-
stationary signals, can be found in (Lachaux et al.,
2002; Klein et al., 2006; Banfi et al., 2012; Grinsted
et al., 2004; Li et al., 2007; Kang et al., 2019;
Chaves and Cazelles, 2019; Yang et al., 2019;
Schuck and Bodmann, 2019).
Unfortunately, the values of
()
2
,tΓν
depend on
the mother wavelet, as well as on the averaging
procedure over
ν
and
t
. It is important to
emphasize that the time-averaging procedure of the
wavelet coherence function associated with the idea
of the short time Fourier transform (STFT) negates
the main advantage of CWT for studying NS, whose
spectral and temporal properties can vary
significantly over time. Indeed, the correlations of
NS signals can develop and disappear at small time
scales. However, the function
()
2
,tΓν
based on the
averaging procedure over many epochs cannot
detect this effect.
Let us introduce the wavelet correlation function
()
,
JK
WCF t
ν
for two signals
()
J
Z
t and
()
K
Z
t as
Wavelet Correlation of Non-stationary Bursts of EEG
143

()( )
*
(,) , ,
JK J K
WCF ν tVν tV ν ttdt
∞
−∞
′′′
=+
. (5)
In contrast
()
,
JK
CWS t
ν
(4), the function
()
,
JK
WCF t
ν
(5), describes the correlation between
two signals at different times. The complex
conjugate wavelet transform of the first signal
()
*
,
J
Vt
′
ν
is taken at the time moment
t
′
. The
wavelet transform of the second signal
()
,
K
Vtt
′
ν
+
is taken at time
tt
′
+
. Representing (5) in terms of
Fourier components, we get:
( ) () () ()
2
*
ˆˆ ˆ
,Ψexp2
JK J K
f
WCF ν tZfZf πift df
ν
∞
−∞
=
. (6)
Using the wavelet correlation function
()
,
JK
WCF t
ν
(5)-(6), we get an opportunity to study the
correlation in time of various channels in the EEG
record. The EEG signal from each channel will be a
sequence of bursts occurring at different points in
time in different spectral ranges
(,, ,,)
μ
=δθα
βγ
.
3 RESULTS
In this study, we use a spontaneous EEG of a healthy
subject at rest with his eyes closed. The background
of the EEG signal represents desynchronized activity
of the neural ensembles of the cerebral cortex. In
addition to the background activity, the EEG signal
includes various oscillatory patterns. Such patterns
represent continuously appearing and disappearing
bursts of rhythms related to the coherent electrical
activity of neural ensembles. When registering EEG,
standard channels are used according to the 10-20%
scheme, where index
J
=1,2, ... 21 takes the values
{Fp1, Fpz, Fp2; F7, F3, Fz, F4, F8; T3, C3, Cz, C4,
T4; T5, P3, Pz, P4, T6; O1, Oz, O2}. The shifts of
the electrical activity maxima for different channels
are small, therefore the signal sampling frequency is
d
F = 500 Hz, which corresponds to the signal
sampling time 2 ms.
By the burst of EEG activity in the frequency
range
{
}
,, ,
μ
=δθα
β
, we mean appearance and
disappearance of a group of waves different from the
background EEG activity in frequency, shape and
amplitude. The maximum electrical activity of such
a burst is localized at a certain point in time
max
t
.
Each burst has its beginning and end, as well as its
own characteristic duration. For each burst, it is
possible to estimate the characteristic spectral range.
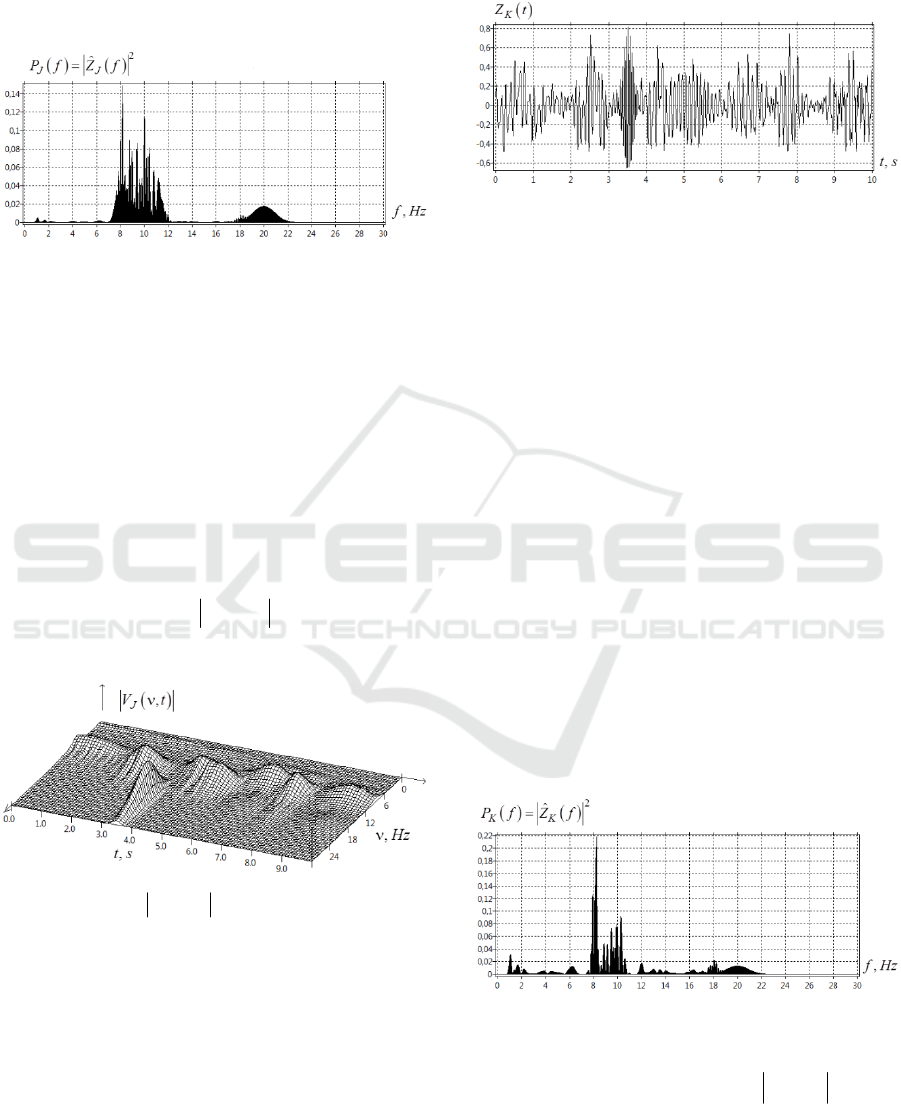
Fig.1 shows the signal
()
J
Z
t from occipital
channel
Z
O
.
Figure 1: EEG signal time dependence (channel
Z
J
O=
).
Visual analysis of
()
J
Z
t shows the presence of
alpha activity bursts (
[7 14 ]
H
zα= −
) in the rhythm.
The centers of these bursts are localized at the
moments of time approximately equal to
J
t =
{0.5;
2.5; 4.3; 5.0; 6.5; 7.6; 9.2 s}. Let us analyze the
characteristic frequencies of all flashes in the
[7 14 ]
H
zα= −
and
β
[14-30 Hz] ranges using the
STFT method with the window
2W =
s. For each
burst, the STFT estimation gives a characteristic
burst maximum
J
t
, measured in s, and one or
several characteristic frequencies
J
ν
in Hz. For
signal
()
J
Z
t , we have the burst matrix
{
}
;
J
JJ
M
atrixZ tαν= {{8.2; 0.51}, {12.0; 0.49},
{10.2; 2.58}, {13.0; 2.59}, {9.2; 4.28}, {14.0; 4.30},
{11.2; 5.10}, {7.8 ; 6.41}, {9.8; 7.62}, {8.8; 9.23},
{6.2; 9.21}}.
In addition to the natural signal
()
J
Z
t , we insert
into the signal the artificial (model) burst of activity
having a Gaussian shape located at
0
t =
0.35 s. This
burst has constant frequency
0
20
ν
=
Нz and
characteristic half-width
0
τ
= 0.09 s. In
β
-range, the
total matrix of signal bursts
()
J
Z
t has the form
{
}
;
J
JJ
M
atrixZ tβν={{20.0; 3.50}, {15.1; 5.18},
{16.3; 6.11}, {16.9; 7.43}, {18.1; 9.21}}. All bursts
in
α
and
β
frequency ranges are sorted by the time
of their occurrence.
The power spectrum
() ()
2
ˆ
JJ
Pf Z f=
of
signal
()
J
Z
t is determined as the squared modulus
BIOSIGNALS 2021 - 14th International Conference on Bio-inspired Systems and Signal Processing
144
of the signal Fourier component
()
ˆ
J
Z
f . This
Fourier spectrum is calculated for the entire
observation interval of the signal
010t≤≤
s
(Fig.2).
Figure 2: Power spectrum
()
J
Pf of the signal
()
J
Z
t .
The analysis of the signal power spectrum
()
J
Pfshows that throughout the signal duration
010t≤≤
s, its spectrum contains bursts with
frequencies in
α
-range. The chaotic bursts of
β
-
rhythm appear in the range [17-19 Hz]. In addition
to these
β
- bursts, in the power spectrum, we have
an ideal Gaussian peak located at
0
ν
= 20 Hz with
the width
00
1/ 1.1Δν = τ ≈
Hz. This peak is
associated with the model Gaussian burst of activity
with the parameters
{
}
00
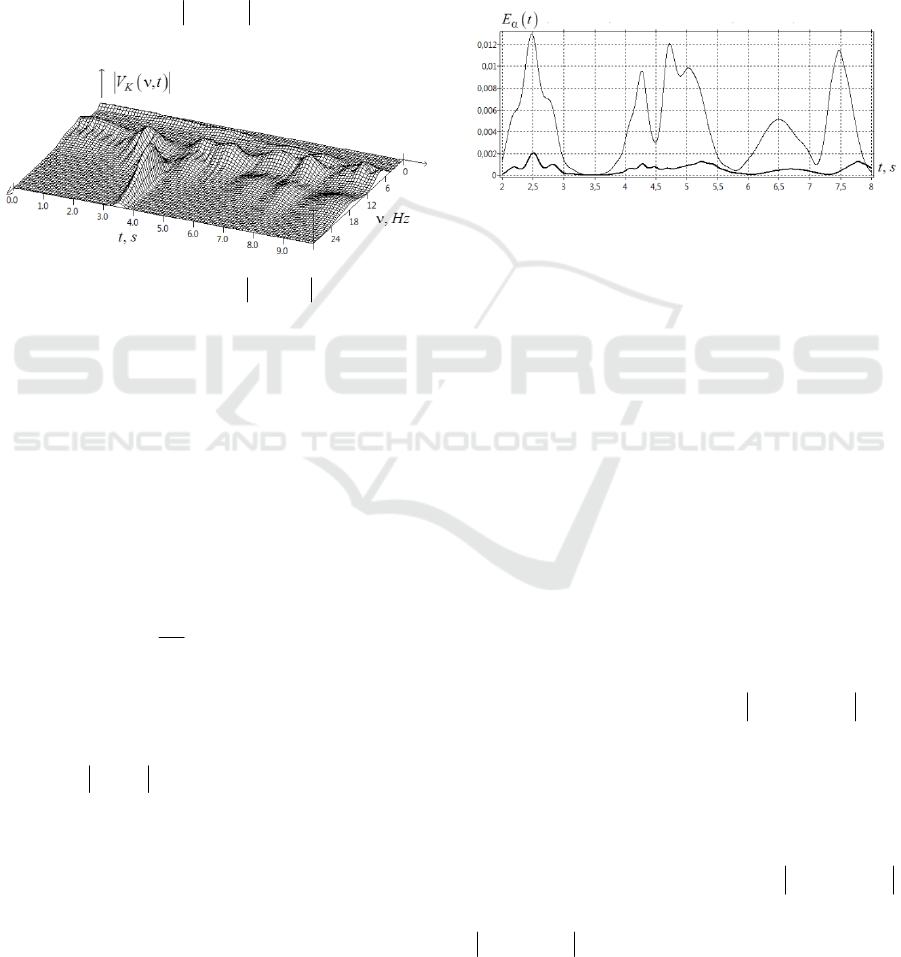
;tν ={20; 3.50}. Fig.3
represents the modulus
()
,
J
Vt
ν
of CWT image for
signal
()
J
Z
t .
Figure 3: Modulus
()
,
J
Vtν of CWT image for the signal
()
J
Z
t .
The advantage of applying CWT method over
the STFT is that for the CWT method the window
size is selected automatically depending on the
frequency of the signal. In addition, for the control
parameter of the Morlet mother wavelet
1m =
, the
shape of the envelope and the value of the burst
frequency completely coincide with the parameters
of the test Gaussian signals (Bozhokin et al., 2017).
A similar problem is solved for the second signal
()
K
Z
t obtained from the central channel
Z
KC=
.
Figure 4: Time dependence of EEG signal
()
K
Z
t
(channel
Z
K
C=
).
The matrix of bursts for
()
K
Z
t in
α
-range has
the form
{
}
;
K
KK
M
atrixZ tαν= {{8.1; 0.52}, {12.0;
0.52}, {10.1; 2.53}, {13.1; 2.53}, {8.9; 4.31}, {14.0;
4.31}, {10.1; 5.25}, {8.1; 6.68}, {9.0; 7.81}, {8.1;
9.55}, {6.2; 9.27}}. In
β
-range, the total matrix of
bursts in signal
()
K
Z
t has the form
{
}
;
K
KK
M
atrixZ tβν={{20.0; 3.52} {15.0; 5.25},
{16.0; 6.73}, {16.9; 7.85}, {18.1; 9.58}}.
Similarly to signal
()
J
Z
t , we insert an artificial
model signal into
β
-range of the signal
()
K
Z
t
spectrum. It is an ideal Gaussian peak with the
characteristics
{
}
01
;tν ={20.0; 3.52}. This specially
introduced
β
-burst in the signal
()
K
Z
t has the same
frequency
0
20
ν
=
as that in
()
J
Z
t . However, the
burst in the signal
()
K
Z
t lags behind in time from
the burst in the signal
()
J
Z
t by
tΔ
=
10
tt−
= 0.02 s.
Figure 5: Power spectrum
()
K
Pf of the signal
()
K
Z
t .
The power spectrum
() ()
2
ˆ
KK
Pf Z f=
for the
signal
()
K
Z
t calculated over the entire observation
interval
010t≤≤
s (Fig.5) differs from that for the
Wavelet Correlation of Non-stationary Bursts of EEG
145
signal
()
J
Z
t (Fig.2). The power spectrum
()
K
Pf
(Fig.5) has much more bursts in the low-frequency
region
[1 7f =−
Hz]
δ
and
θ
- rhythms in
comparison with the spectrum
()
J
Pf (Fig.2). The
spectrum
()
K
Pf in
α
-range [7-14 Hz] has fewer
harmonics compared to
()
J
Pf. However, the
spectrum of bursts in
β
-range in the signal
()
K
Z
t
is much wider than in the signal
()
J
Z
t . Fig.6 shows
the modulus of CWT
()
,
K
Vt
ν
for the signal
()
K
Z
t
.
Figure 6: Modulus of CWT
()
,
K
Vt
ν
for the signal
()
K
Z
t .
Three-dimensional patterns of EEG bursts for the
signal
()
J
Z
t (Fig.3) plotted on the
,
ν
Hz and
t
, s
plane differ from those for
()
K
Z
t (Fig.6).
To study the dynamics of the rise and fall of the
bursts with different frequencies, we introduce
spectral integrals
()
Et
μ
, which depend on time
t
(Bozhokin and Suvorov, 2008; Bozhokin and
Suslova, 2014, 2015).
() ()
/2
/2
1
,Et td
μ
μ
ν−Δν
μ
ν−Δν
=ενν
Δν
. (7)
Spectral integral
()
Et
μ
is the average value of
signal energy spectrum local density
() ()
()
2
,2 ,/tVt C
ψ
εν = ν ν
, integrated over the
certain frequency interval
/2; /2
μμ
ν−Δν ν+Δν
,
where
μ
ν
is the middle of the corresponding
spectral interval,
Δν
is the width of the interval.
Studying the behavior of spectral integrals over time
()
Et
μ
, we perform a kind of filtering of our signal
by summing the contributions from the local
spectrum density
()
, tεν in a certain frequency
range
{
}
,, ,
μ
=δθα
β
. The constant C
ψ
was
calculated in the article (Bozhokin et al, 2017).
To compare the bursts accurately let us consider
the values of the spectral integral
()
Et
α
in the
α
-
range for the signals
()
J
Z
t
and
()
K
Z
t
. For this
purpose, we take the time interval
t
= [2-8 s] (Fig.7),
where the main bursts of these signals are
concentrated.
Figure 7: Spectral integrals
()
Et
α
versus time
t
for
α
-
range. The thin line corresponds to the signal
()
J
Z
t
(channel
z
O
). The bold line is for the signal
()
K
Z
t
(channel
Z
C
).
The analysis of spectral integrals
()
Et
α
in
α
-
range shows (Fig.7) that the structure of the bursts
changes when the disturbance moves from the
occipital channel
Z
O
()
()
J
Z
t
to the channel
Z
C
()
()
K
Z
t
. With this movement, the amplitude of the
bursts decreases. The speed
V
α
≈
3-5 m/s of
α
-burst
maximum movement can be estimated from the shift
of this maximum, which is
tΔ≈
0.02-0.03 s.
Thus, using two EEG channels as an example,
we have shown that the frequency spectrum and
temporal position of bursts change as they propagate
through the cerebral cortex. Then, let us calculate
the wavelet correlation function
()
,
JK
WCF t
ν
(5)-
(6) for the signals
()
J
Z
t and
()
K
Z
t . This function
will allow us to find the correlation of two bursts,
whose maxima of which are located at different time
moments for the fixed frequency
ν
varying in the
interval
[1 30 ]
H
z
ν
=−
.
We consider the time argument of
()
,
JK
WCF t
ν
varying in the interval
[10;10t =−
s]. The graph of
()
,
JK
WCF t
ν
is shown in Fig.8.
BIOSIGNALS 2021 - 14th International Conference on Bio-inspired Systems and Signal Processing
146

Figure 8: Wavelet correlation function
()
,
JK
WCF t
ν
of
two signals
J
and
K
depending on frequency
, Hz
ν
and
time
,ts
.
Let us explain the main peaks of
()
,
JK
WCF t
ν
in Fig.8. Suppose that there is a single burst in
signal
()
J
Z
t , characterized by frequency
ν
time
J
t
of its maximum. In this case, the maximum value
of CWT image
()
*
,
J
Vt
′
ν
will be observed at the
moment of time
J
tt
′
=
.
In turn, there is a single burst in signal
()
K
Z
t ,
characterized by the same frequency
ν
and the time
moment
K
t
. The maximum of
()
K
Vtt
′
+ will be at
K
tt t
′
+=
. The consequence of these two equalities
is the condition that the maximum of
()
,
JK
WCF t
ν
(5), (6) will be observed at the frequency
ν
at the
moment of time
KJ
tt t=−
.
Let us explain the origin of the maxima in Fig.8
in the range of the alpha rhythm
[7;14 ]
H
zα=
in
the time interval
[10;10]ts=−
. We introduce the
designation
{
}
;
JJ
J
tν
⇔
{
}
;
KK
K
tν , which means
the correlation of an individual burst
()
J
Z
t ,
characterized by frequency
J
ν
and center
localization time
J
t
, with a specific burst having the
parameters
K
ν
and
K
t
.
The leftmost maximum of
()
,
JK
WCF t
ν
(Fig.8)
is located in the frequency range
[8;9 ]
H
z
ν
=
in the
time interval
[6;5]ts=− −
. This leftmost maximum
is associated with the correlations of the following
bursts:
{
}
7.8;6.41
J
⇔
{
}
8.1;0.52
K
;
{
}
8.8;9.23
J
⇔
{
}
8.9;4.31
K
. The next leftmost maximum of
()
,
JK
WCF t
ν
is located in the frequency range
[9;10 ]
H
z
ν
=
in the time interval
[3.5;2]ts=− −
.
This maximum is associated with the following
correlations:
{
}
9.8;7.62
J
⇔
{
}
10.1;5.25
K
.
A large number of bursts in
α
-range, which
have approximately the same frequencies and times
of occurrence, form a large correlation peak located
nearby
0t =
. Reasoning similarly, the rightmost
peak of
()
,
JK
WCF t
ν
located in the interval of
times
[6 10 ]ts=−
near the frequencies
10
H
z
ν
≈
is
associated with correlations:
{
}
8.2;0.51
J
⇔
{
}
8.1;9.55
K
;
{
}
8.2;0.51
J
⇔
{
}
8.1;6.68
K
. The most
striking correlation (5), (6) in
β
-range is a high
peak centered at the point
{
}
20.0;0.02 . The reason
for this peak is the correlation of two bursts:
{
}
20.0;3.50
J
⇔
{
}
20.0;3.52
K
.
Thus, we introduced the function
()
,
JK
WCF t
ν
,
which adequately describes the wavelet correlation
of two signals
()
J
Z
t and
()
K
Z
t , each consisting of
a large number of EEG bursts. The ensemble of
signal bursts
()
J
Z
t differs from the ensemble of
signal bursts
()
K
Z
t both in the time of their
occurrence and in the frequency composition. In
addition, each burst has its own amplitude, phase,
and characteristic time scale.
4 CONCLUSIONS
The aim of the article is to introduce a new wavelet
correlation function
()
,
JK
WCF t
ν
. The electrical
activity of neural ensembles is analyzed using EEG
signals from many brain channels in different
spectral ranges. We discussed the shortcomings of
the methods based on the windowed Fourier
transform (short-time Fourier transform - STFT) for
the study of the synchronization of various EEG
channels. The disadvantages include the ambiguity
in the choice of the window duration, the problems
of selecting the window function, and the degree of
window overlapping.
The known wavelet methods for studying signal
correlation make it possible to analyze the
interdependence of two EEG signals occurring only
at the same time. The study of real EEG signals, in
which correlated bursts occur at different times,
requires the use of another type of wavelet
correlation function.
Wavelet Correlation of Non-stationary Bursts of EEG
147

In the article, we use the modification
()
,Vt
ν
of
continuous wavelet transform, which has advantages
over the standard CWT form
()
,Wt
ν
(Mallat, 2008;
Chui and Jiang, 2013; Hramov, 2015). These
involve the accurate reflection of the ratios by both
frequencies and amplitudes of the signals and their
CWT images. Furthermore, by including an
additional control parameter
m
into the Morlet
mother wavelet, we get the opportunity to further
adjust both the amplitude and frequency resolution
of signals.
An example of two EEG channels is analyzed.
The signals from these channels
()
J
Z
t and
()
K
Z
t
are the alternation of bursts, which occur at different
times in different frequency intervals. The spectral
powers of these signals
()
J
Pfand
()
K
Pf are
calculated, as well as their CWT images
()
,
J
Vt
ν
and
()
,
K
Vt
ν
. A new correlation function
()
,
JK
WCF t
ν
is introduced and calculated. It allows
us to determine the correlation of bursts occurring in
signals at different times, but having the same
frequency. For the specific example of two
nonstationary signals from different EEG channels, a
classification of correlations of different bursts is
suggested.
The proposed method assuming the calculation
of the function
()
,
JK
WCF t
ν
can be used to analyze
the propagation of disturbances over the surface of
the brain, and to study the synchronicity of the
evoked potentials arising as a response of neural
ensembles to the sensory stimulation. The
()
,
JK
WCF t
ν
can be useful in the study of rapidly
changing burst processes in plasma physics and
astrophysics, as well as for the determination of
coherent space-time structures for media with strong
dispersion.
ACKNOWLEDGMENTS
The work was performed within the framework of
the Russian State tasks for conducting fundamental
research (topic code FSEG-2020-0024).
REFERENCES
Addison, P.S., 2017. The illustrated wavelet transform
handbook. Introductory theory and application in
Science, engineering, medicine and finance, CPC
Press, Second Edition.
Adeli, H., Ghost-Dastidar, S., 2010. Automated EEG-
based diagnosis of neurological disorders: Inventing
the future of neurology, CRC Press.
Advances in Wavelet Theory and Their Applications in
Engineering, Physics and Technology. 2012. Edited by
Dumitru Baleanu
Banfi, F., Ferrini, G., 2012. Wavelet cross-correlation and
phase analysis of a free cantilever subjected to band
excitation,
Beilstein J. Nanotechnol. 3: 294–300.
Bendat, J. S., and Piersol, A. G., 2011. Random Data:
Analysis and Measurement Procedures, (Vol. 729),
NY: John Wiley & Sons, New York.
Bozhokin S.V., Suvorov N.B., 2008. Wavelet analysis of
transients of an electroencephalogram at
photostimulation, Biomed. Radioelektron, N3: 21-25.
Bozhokin, S.V., Suslova, I.B., 2014. Wavelet Analysis of
Non-Stationary Signals in Medical Cyber-Physical
Systems (MCPS), International Conference on Next
Generation Wire/Wireless Networking, Lecture Notes
of Computer Science, LNCS, 8638: 467-480.
Bozhokin, S.V., Suslova, I.B., 2015. Wavelet-based
analysis of spectral rearrangements of EEG patterns
and of non-stationary correlations, Physica A.
421:151–160.
Bozhokin, S.V., Zharko, S.V., Larionov, N.V., Litvinov,
A.N., Sokolov, I.M., 2017. Wavelet Correlation of
Nonstationary Signals, Technical Physics, 62(6):837-
845.
Chavez, M., Cazelles, B., 2019. Detecting dynamic spatial
correlation patterns with generalized wavelet
coherence and non-stationary surrogate data, Scientific
Reports 9(1): 7389-7398.
Chui, C.K., Jiang O., 2013. Applied Mathematics. Data
Compression, Spectral Methods, Fourier Analysis,
Wavelets and Applications. Mathematics Textbooks
for Science and Engineering, v.2, Atlantis Press.
Cohen A., 2003. Numerical Analysis of Wavelet Method,
Elsevier Science, North-Holland.
Duc N.T., Lee B., 2019. Microstate functional
connectivity in EEG cognitive tasks revealed by a
multivariate Gaussian hidden Markov model with
phase locking value, Journal of neural engineering,
16(2):026033
Grinsted, A., Moore, J.C., Jevrejeva S., 2004. Application
of the cross wavеlet transform and wavelet coherence
to geophysical time series, Nonlinear Processes in
Geophysics 11(5/6): 561-566.
Hramov, A.E., Koronovskii, A.A., Makarov, V.A.,
Pavlov, A.N., Sitnikova, E., 2015. Wavelets in
neuroscience, Springer Series in Synergetics,
Springer-Verlag, Berlin, Heidelberg.
Klein, A., Sauer, T., Jedynak,A., Skrandies,W., 2006.
Conventional and wavelet coherence applied to sensory-
evoked electrical brain activity, IEEE transaction on
biomedical engineering. 53(2): 266-272.
Kropotov, J. D., 2010. Quantitative EEG, Event-Related
Potentials and Neurotherapy, San Diego, CA:
Academic Press.
BIOSIGNALS 2021 - 14th International Conference on Bio-inspired Systems and Signal Processing
148

Kulaichev, A.P., 2011. The informativeness of coherence
analysis in EEG studies, Neuroscience and behavioral
physiology. 41(3): 321-328.
Lachaux, J.-P, Lutz, A., Rudrauf, D., Cosmelli, D., Quyen,
L.V., Martinerie, J., Varela, F., 2002. Estimating the
time-course of coherence between single-trial brain
signals: an introduction to wavelet coherence,
Neurophysiologie Clinique. 32: 157-174.
Li, X., Yau, X., Fox,J., Jefferys,J.G., 2007. Interactions
dynamics of neuronal oscillations analysed using
wavelet transform, Journal of Neuroscience Methods.
160:178-185.
Kang, S.H., McIver,R.P., Hernandes,J.A., 2019. Co-
movements between Bitcoin and Gold: A wavelet
coherence analysis, Physica A: Statistical Mechanics
and its Applications, 536: 120888.
Mallat, S., 2008. A Wavelet Tour of Signal Processing,
Academic Press, New York, 3rd ed.
Mandel L, Wolf E., 1995. Optical Coherence and
Quantum Optics, Cambridge University Press.
Papandreou-Suppappola A., 2003. Application in time-
frequency signal processing, CRC Press.
Piqueira J.R.C., 2011. Network of phase-locking
oscillators and a possible model for neural
synchronization, Commun. Nonlinear Sci. Numer.
Simul., 16(9): 3844–3854.
Reiser, E. M., Schulter, G., Weiss, E. M., Fink, A.,
Rominger, C., and Papousek, I., 2012. Decrease of
prefrontal-posterior EEG coherence: loose control
during social-emotional stimulation, Brain Cogn.. 80,
144–154. doi: 10.1016/j.bandc.2012.06.001
Schuck, Jr. A., Bodmann, B.E.J., 2019. On the
Development of an Alternative Proposition of Cross
Wavelet Analysis for Transient Discrimination
Problems, Integral Methods in Science and
Engineering, 409-423.Springer Nature Switzerland.
https://doi.org/10.1007/978-3-030-16077-7
Seleznov I., Zyma I., Kiyono K., Tukaev S., Popov.A.,
Chernykh M., Shpenkov O., 2019. Detrended
fluctuation, coherence, and spectral power analysis of
activation rearrangement in EEG dynamics during
cognitive workload, Frontiers in Human
Neuroscience, https://doi.org/10.3389/fnhum.2019.00
270
Sheikhani A., Behnam H., 2008. Connectivity analysis of
quantitative electroencephalogram background activity
in Autism disorders with short time Fourier transform
and coherence values, Congress on Image and Signal
Processing. IEEE, DOI: 10.1109/CISP.2008.595.
Subha, D.P., Joseph, P.K., Acharya, R.U., Lim C.M.,
2010. EEG Signal Analysis: A Survey, Journal of
medical systems. 34: 195-212.
Trofimov, A.G., Kolodkin, I.V., Ushakov, V.L.,
Velichkovski, B.M., 2015. Agglomerative method for
isolating microstates related to the characteristics of
the traveling wave, Neuroinformatic-2015, Russian
Scientific and Technical Conference, M.:MIFI. Part 1:
66-77.
Wavelets in Physics, 2004. Edited by J.C. Van.den Berg,
Cambridge University Press.
Yang, Xi. X., Shi C., et al., 2019. Surface
Electromyography-Based Daily Activity Recognition
Using Wavelet Coherence Coefficient and Support
Vector Machine, Neural Process Lett. 50:2265–2280.
Wavelet Correlation of Non-stationary Bursts of EEG
149
