
NAND-measure: An Android App for Marker-based Spatial
Measurement
Maik Benndorf
1
, Maximilian Jugl
2
, Thomas Haenselmann
2
and Martin Gaedke
1
1
Department of Computer Science, Technische Universit
¨
at Chemnitz, Chemnitz, Germany
2
Faculty Applied Computer Sciences & Biosciences, University of Applied Sciences Mittweida, Germany
{mjugl, thomas.haenselmann}@hs-mittweida.de
Keywords:
Spatial Measurement, Pinhole Camera Theory, Stereoscopy, Android.
Abstract:
In a disaster scenario, a quick decision must be made whether a bridge is stable enough to be used. The natural
frequencies of a bridge can provide information about its condition. The actual frequencies (e.g. measured by
the acceleration sensor built into a smartphone) must be compared with the desired frequencies. The desired
frequencies can be approximated for example with the Finite Element Method (FEM).Among other parameters,
the FEM requires the dimensions of the bridge. Numerous applications for spatial measurement for different
purposes are offered in the mobile App-stores. However, most of these apps are limited to short distances of up
to five meters and are not suitable for the aforementioned scenario. In this article, we present NAND-Measure
- an application for spatial measurements for short distances (below one meter) up to distances of 50 meters.
Two methods have been implemented - a stereoscopic approach with a single camera and an approach based on
the pinhole camera model. Both methods were evaluated by taking sixty over different distances. Overall, the
approach based on the pinhole camera model was more accurate and showed smaller deviations.
1 INTRODUCTION
Our overall objective, is a mobile ad-hoc evaluation of
the condition of a bridge using Android devices. To
assess the condition of a bridge the natural frequen-
cies can be used - for this purpose the actual natural
frequencies are compared with the desired values of
the natural frequencies. In ((Benndorf et al., 2017)
and (Benndorf et al., 2016)) we were able to prove
that the sensors built into a smartphone are capable of
recording the vibrations of the bridge. By transform-
ing these vibrations into frequency domain the actual
natural frequencies can be determined. The desired
values of natural frequencies are specified during the
planning and construction of the bridge and finally
recorded in the construction diary. This construction
diary is usually handed over to the authorities after
the building is completed, yet, in some cases, these
diaries are not available in a timely manner. In these
cases, it is necessary to approximate these frequencies.
Since these frequencies depend on the bridge type as
well as the material and the dimensions of the bridge,
we were able to determine this information by classi-
fying the bridge type and the material of the bridge
based on photos. The missing part are the bridge di-
mensions that we will determine with a measurement
app. For this purpose, we propose NAND-Measure
1
.
This application implements two methods of spatial
measurement - a stereoscopic approach with only one
camera and an approach based on the pinhole cam-
era model. The application and the two implemented
approaches are presented in this paper, which is struc-
tured as follows. The following section 2 provides an
overview of the topic of spatial measurement apps and
spatial measurement methods and discusses related
work. In the METHODOLOGY section, we present
our application and discuss the details of its implemen-
tation. In EVALUATION section, the implemented
methods are evaluated and the results are discussed.
Finally, in Section CONCLUSION AND OUTLOOK,
we summarize this work and provide an outlook on
future research.
2 RELATED WORK
For the described use case we were searching for ap-
plications/approaches that range from short distances
1
https://github.com/JoogsWasTaken/nand-measure
646
Benndorf, M., Jugl, M., Haenselmann, T. and Gaedke, M.
NAND-measure: An Android App for Marker-based Spatial Measurement.
DOI: 10.5220/0010196206460652
In Proceedings of the 16th International Joint Conference on Computer Vision, Imaging and Computer Graphics Theory and Applications (VISIGRAPP 2021) - Volume 4: VISAPP, pages
646-652
ISBN: 978-989-758-488-6
Copyright
c
2021 by SCITEPRESS – Science and Technology Publications, Lda. All rights reserved
(less than one meter) to long distances (more than 50
meters) with low requirements to working well on
all Android phones. The methods used should de-
termine measurements solely based on an image and
return a unit of length. In the App-Stores for Android
different measurement applications are already avail-
able. In many cases, the measurement method used
depends on the use case of the application. Google,
for example, uses the Simultaneous Localization and
Mapping (SLAM) method in the application Measure
with ARCore(Google Developers, nda) to determine
the position of the smartphone in its environment. The
ARCore detects feature points in the camera images
and uses these points to calculate its change of position
over time. By fusing these feature points with the val-
ues measured by the Inertial Measurement Unit (IMU),
the position and orientation of the device relative to
the world can be determined(Google Developers, ndb).
At the same time, the distances of the device to the
feature points can be determined. However, in order to
use the application, the device has to meet some condi-
tions: The device must be supported
2
. This requires at
least Android 7 to be running on the device, OpenGL
ES 3.0 must be supported and the Playstore must be
installed. The application covers the entire range of the
distances mentioned above. Nevertheless, due to the
requirements of the application, it may not work well
on all Android devices. Another approach is to deter-
mine measurements based on cartographic data((Esri,
nd), (Farmis, 2013), and (Christensen, 2010)). In this
approach, the starting or endpoints are chosen by the
user or GPS is used to determine them. This approach
works on long distances but cannot be used on short
distances. Ruler applications (NixGame, 2016; Smart
Tools co., 2010) scale the display width as a ruler
which makes them suitable for short distances only.
Away from the App-Stores some methods exist to de-
termine the depth information of an image. For Exam-
ple, in (Saxena et al., 2006) the authors used machine
learning to create a depth image from textures in an
image. However, the illustrations are only estimates
and depth can only be described by the proximity to
the observer. Furthermore, the correlation to a unit of
length is not given. This depth information can also
be determined by using stereoscopy. For this purpose,
an object is captured from two locations that are a
short distance apart. By superimposing the two im-
ages, the illusion of a three-dimensional image can be
created. Moreover, by triangulating and focusing a
point in both shots, depth information can be obtained.
The authors of (Mrovlje and Vran, 2008) used two
cameras and a circular marker. Using Matlab, they
2
List of supported devices https://developers.google.com/
ar/discover/supported-devices
determined the distances between the camera and the
marker at distances up to 60 meters. They report an
average deviation of 1.32 meters with a standard de-
viation of 2.84 meters over a distance of 50 meters
with camera distances between 0.2 and 0.7 meters. In
(Cao et al., 2013) the authors propose a marker-based
measurement approach based on the pinhole imaging
theory (PIT) with a single camera. They applied this
approach to distances up to 1.40 meters and achieved
a deviation of 0.23 cm.
3 METHODOLOGY
In order to eventually measure a bridge in the field
only using a smartphone, we decided to adapt both
the stereoscopic and the PIT approach. For this pur-
pose, we tried to reduce the stereoscopic approach
to one camera. The parallelism of the two images
had to be guaranteed with the sensors built into the
smartphone. With the PIT approach, the measuring
range was extended from 1.40 meters (in (Cao et al.,
2013)) to approximately 50 meters. Finally, these two
approaches will be evaluated in terms of accuracy.
3.1 Basic Workflow
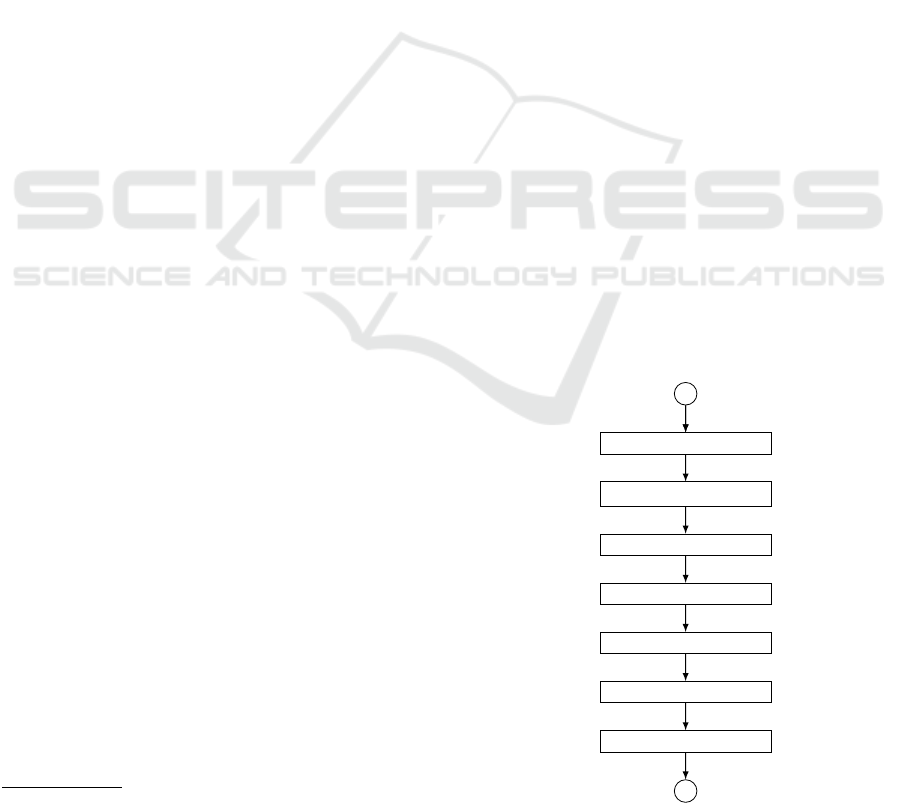
Figure 1 shows the basic workflow of a measure-
ment with NAND-Measure. The first step is to ac-
tivate the fullscreen, which is followed by enabling
OpenCV(OpenCV Contributors, 2018). OpenCV pro-
vides the interface between the camera and our app as
well as various methods for image processing. After
Activate fullscreen
Inizialize OpenCV
Activate camera
Fix Focus
MEASUREMENT
Deactivate camera
Deactivate Fullscreen
Figure 1: Basic workflow of spatial measurement.
NAND-measure: An Android App for Marker-based Spatial Measurement
647
OpenCV is initialized, the camera component is acti-
vated and the focus is fixed to prevent other objects
from being automatically or accidentally focused, thus
ensuring consistent results for the measurements. In
the MEASUREMENT step the user may choose be-
tween the stereoscopy and the PIT approach. For both
approaches, the measurement starts with a calibration
depending on the approach (described in the respective
section). This is followed by a preprocessing of the
input image for both approaches. Therefore, a blur
is applied to minimize the noise in the image. After-
wards, the image is binarized, and then the OpenCV
method
findContours
is used to find the contour of
the marker in the binarized image. The user can limit
the search area by framing the contour with a bounding
box - thus, minimizing the number of wrongly detected
contours. Finally, the detected contour is stored in an
accumulator including its position and area. The mea-
surement is repeated until the accumulator is filled
with measured values. The concept of the accumulator
is applied to avoid outliers. The default value for the
size of the accumulator is 50, yet this value can be ad-
justed. In the final step, the mean value of the values
in the accumulator is returned as a measured value and
the camera component and the fullscreen are deacti-
vated. The detailed steps differ in both approaches and
are described in the following two subsections.
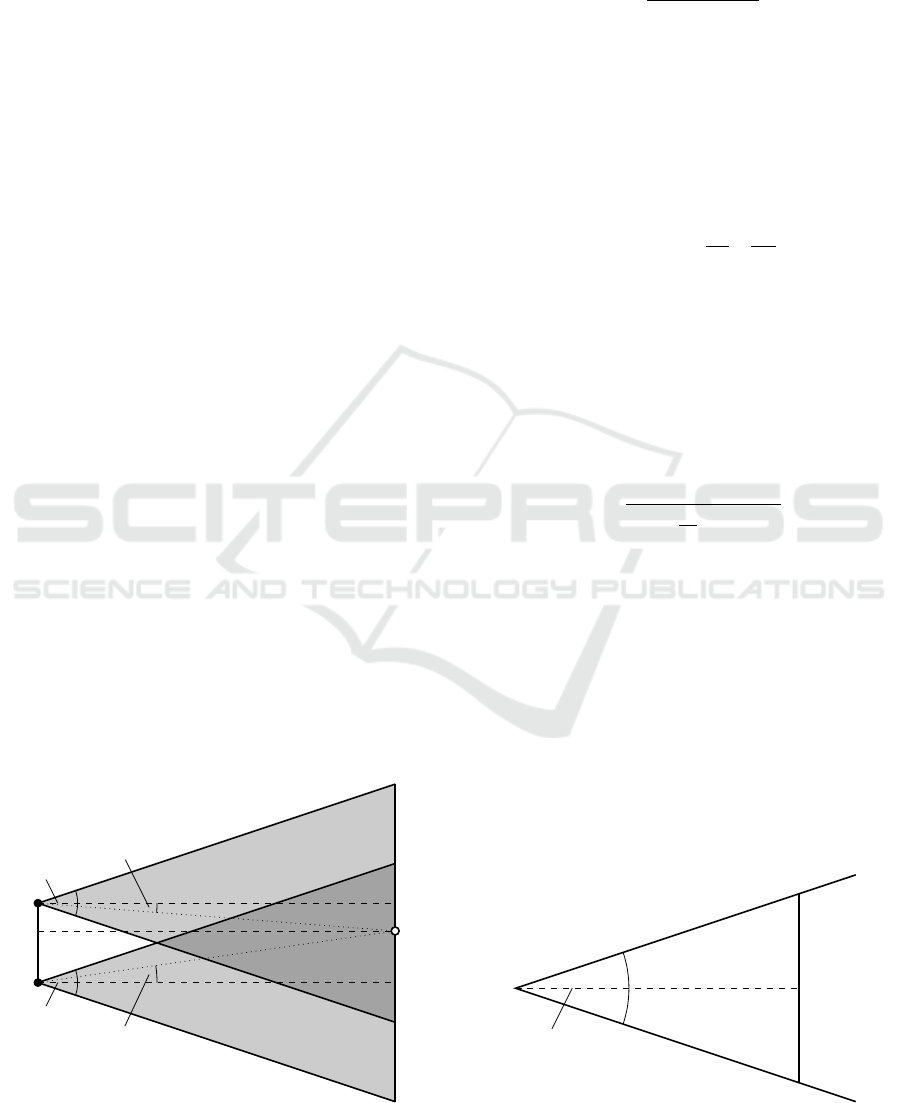
3.2 PIT Approach
In (Cao et al., 2013) the authors present a marker-based
measurement method using a pinhole camera model
and a circular marker. We used the circular marker
and adapted their approach so it could be used with the
built-in camera of a smartphone. Most of the cameras
are monocular and, therefore, have a fixed focal length
f .
f
d
=
R
r
(1)
This enables the relationship established in Equation 1
between
f
, the object distance
d
, the radius of the
marker
r
, and the radius of the projected marker
R
as it
can be seen in Figure 2. Since the area
A
of the circle is
calculated by
A = πr
2
Equation 1 can be transformed
to Equation 2.
f
2
d
2
=
R
2
r
2
=
πR
2
πr
2
=
A
a
(2)
By solving for
d
, the distance of an object can be
determined (see Equation 3).
d = f
r
a
A
(3)
Since this equation is independent of the shape of
the marker other kinds of markers can also be used.
R
f
d
r
Figure 2: Projection of circular markers according to the
pinhole camera model (adapted from (Cao et al., 2013)).
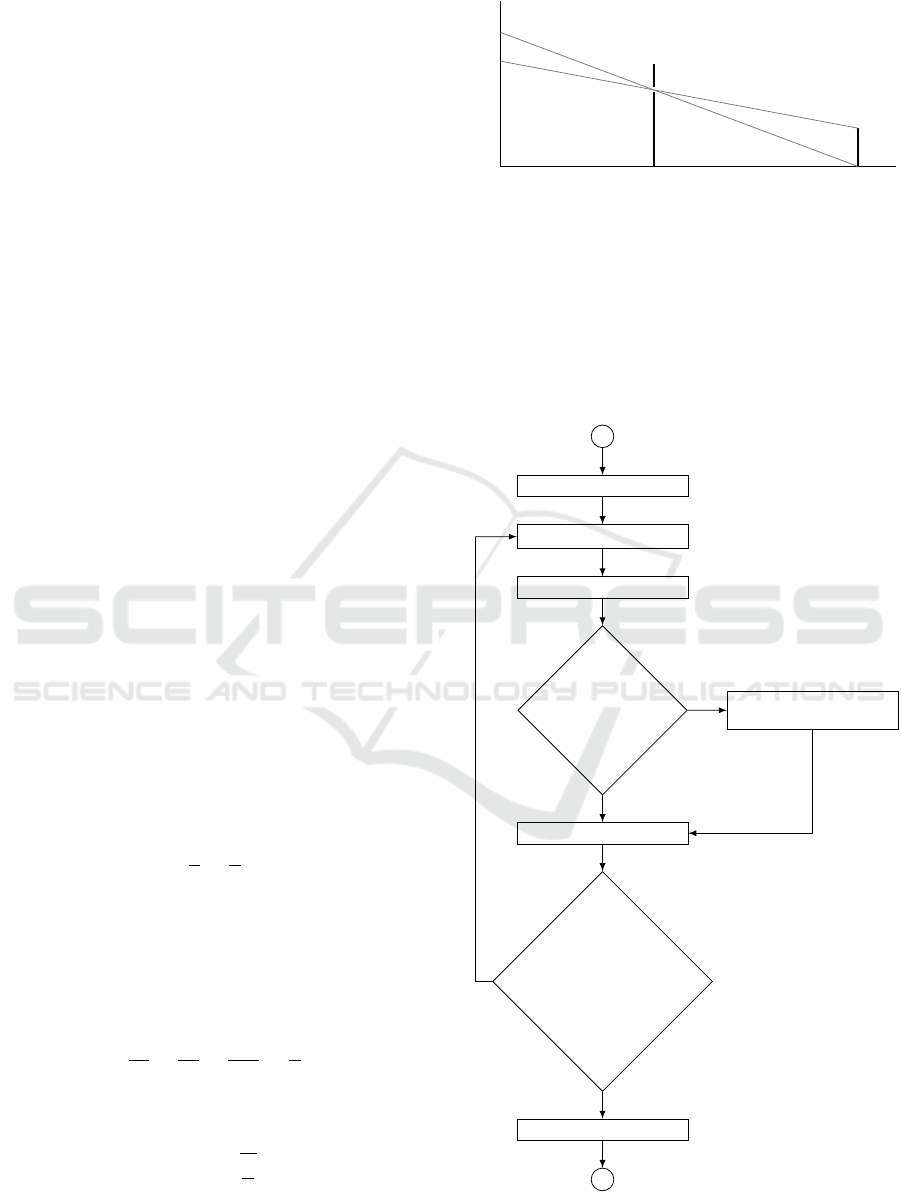
Figure 3 provides an overview of the implemented
approach. For the calibration step, the marker used for
the measurement, which has the radius
r
is positioned
in a distance
d
. The values
r
and
d
are entered to the
application. This allows the size of the projection to
be determined and used as a reference. This reference
Calibration
Get and preprocess Image
Find Contour
Found?
Cancel
measurement
Add size to accumulator
Measurement
canceled
OR
#Samples == 50?
Perform calculation
Yes
Yes
No
No
Figure 3: Activity diagram for the measurement step for the
PIT Approach.
VISAPP 2021 - 16th International Conference on Computer Vision Theory and Applications
648
projection is used during the following measurements
that are repeated until the accumulator is full. The
image is retrieved from the camera and preprocessed.
Subsequently, the app tries to locate the contour in
the image. If it is found, its area is calculated and
added to the accumulator, otherwise, the measurement
is canceled. Finally, when the accumulator is filled,
the measurement is stopped, the distance calculation
is performed and the result is returned to the main
application.
3.3 Stereoscopic Approach
The measurement setup of the stereoscopic measure-
ment according to (Mrovlje and Vran, 2008) calls for
two identical cameras be placed parallel to each other
to calculate the distance to any markers. This set up
formed the basis for the approach presented in this
paper. However, only one camera was used, because,
usually, not two identical cameras are available in case
of an ad-hoc measurement. Since a static object is used
as a marker, a minimal time difference between two
images taken can be tolerated as long as the parallelism
between these two (images) is guaranteed. Figure 4
shows the basic setup for this approach. The upper and
lower cones correspond to the images taken from the
left side (
I
l
) and right side (
I
r
) respectively. Therefore,
the marker to be measured must be in the right half of
I
l
and vice versa. If the object is projected perpendicu-
lar to the distance between the two camera locations
(
I
l
and
I
r
), it divides the distance between them into
the lengths
b
1
and
b
2
. The distance to the object can be
calculated using the horizontal offset of the object be-
tween the two camera images. As can be seen, the two
distances, between the cameras and the object, and
the observation angles
φ
1
and
φ
2
form right-angled
triangles from which trigonometric identities can be
derived. Thus, the distance
d
can be calculated de-
φ
H
φ
2
I
r
φ
H
φ
1
I
l
d
x
l
x
r
b
2
b
1
Figure 4: Distance measurement with stereoscopic images
(adapted from (Mrovlje and Vran, 2008)).
pending on the distance between the camera location
b
(
b = b
1
+ b
2
) and the two observation angles
φ
1
and
φ
2
, as can be seen in Equation 4.
d =
b
tanφ
1
+ tan φ
2
(4)
Since the images have a fixed resolution the width in
pixels is defined as
x
0
. The distance
d
to the object
and the horizontal offsets of the object from the center
of the image,
x
r
and
x
l
, form right-angled triangles in
the image halves. These can be set in relation to half
of the width
x
0
and half of the viewing angle
φ
H
, since
they share the right angle as well as the opposite sides.
tanφ
1
= tan
φ
H
2
2x
r
x
0
(5)
Thus, the observation angles can be used as a function
of the angle of view of the camera, the image width,
and the respective horizontal offset, as can be seen
in Equation 5 for the left camera. By setting the ob-
servation angles in Equation 4 the calculation of the
distance now depends on the horizontal field of view
of the camera and the distance
d
can be calculated
using Equation 6.
d =
bx
0
2tan
φ
H
2
(x
r
− x
l
)
(6)
The overall workflow for the stereoscopic approach
is similar to the workflow for the PIT approach (see
Figure 3), with the difference that the steps after the
calibration step are carried out for both image loca-
tions.
3.3.1 Calibration
As mentioned above, stereoscopy requires knowledge
of the camera’s field of view. This field of view con-
sists of the horizontal and vertical viewing angles (
φ
H
and
φ
V
) of the camera. Using Equation 7, these val-
ues are determined in the calibration step by placing
l
d
φ
H
Figure 5: Calculation of the horizontal viewing angle of a
camera.
NAND-measure: An Android App for Marker-based Spatial Measurement
649
an object with the length
l
parallel to the camera at a
distance d (see figure 5).
φ
H
= 2 arctan
l
2d
(7)
3.3.2 Guaranteed Parallelism
The parallelism between the two image locations is
guaranteed by using the rotation vector sensor to de-
termine the position of the device based on the roll,
pitch and yaw angles. These angles can also be used
to correct minor deviations in the alignment angles.
The correction is performed after the measurement on
I
r
is performed. The basis for this correction is the
difference in the alignment angles of both image lo-
cations. The sign of this angle difference determines
whether the orientation of the camera has changed in
the mathematically positive or negative direction of ro-
tation. Consequently, the location of the marker in the
left half of the image has to be adjusted accordingly.
Afterwards, both distances (corrected and uncorrected)
are calculated and returned to the main application.
Figure 6 shows the two phases of the measurements -
Figure 6: User interface for the stereoscopic measurement.
top: image location
I
l
, bottom: image location
I
r
. The
upper left edge of
I
r
shows the deviation of the rotation
vector sensor from I
l
.
4 EVALUATION
Using NAND-Measure experiments were carried out
over different distances to evaluate the accuracy of the
two approaches. Finally, we conclude this section by
an evaluation of our application on the requirements
mentioned in section 2.
4.1 Evaluation Experiments
To evaluate the accuracy of the app and their imple-
mented approaches measurements were carried out
over different distances in four measurement series.
Table 1 provides an overview of these measurement
series. In each measurement series, three measure-
Table 1: Measurement Series (Values are given in cm).
measurement series
Attribute A B C D
Marker radius 1.5 5 10 100
Distances
d
1
20 100 600
1000
d
2
35 200 800
2000
d
3
50 300
1000 3000
d
4
65 400
1200 4000
d
5
80 500
1400 5000
Distance of the camera
1
20 80 400 400
Calibration distance
2
50 300
1000 2000
ments were carried out for each of the five distances,
resulting in a total number of 60 measurements for
each approach. Figure 7 shows the deviations for each
of the three measurements from distance
d3
of mea-
surement series A. As can be seen, the deviations vary
over all three measurements. Furthermore, the devi-
ations for the PIT approach are smaller than those
for the stereoscopic method. This is also confirmed
by further evaluations. Figure 8 shows the deviations
and their respective standard deviations for all dis-
-1.0
-0.5
0.0
0.5
pit diff radius [pixel] stereo diff x [pixel] stereo diff yaw [degree]
deviation [pixel — degree]
measurement series A B C
Figure 7: Deviations of the three measurements from the
distance d3 of measurement series A for both methods.
1
Relevant for stereoscopic measurement
2
Relevant for the PIT approach
VISAPP 2021 - 16th International Conference on Computer Vision Theory and Applications
650
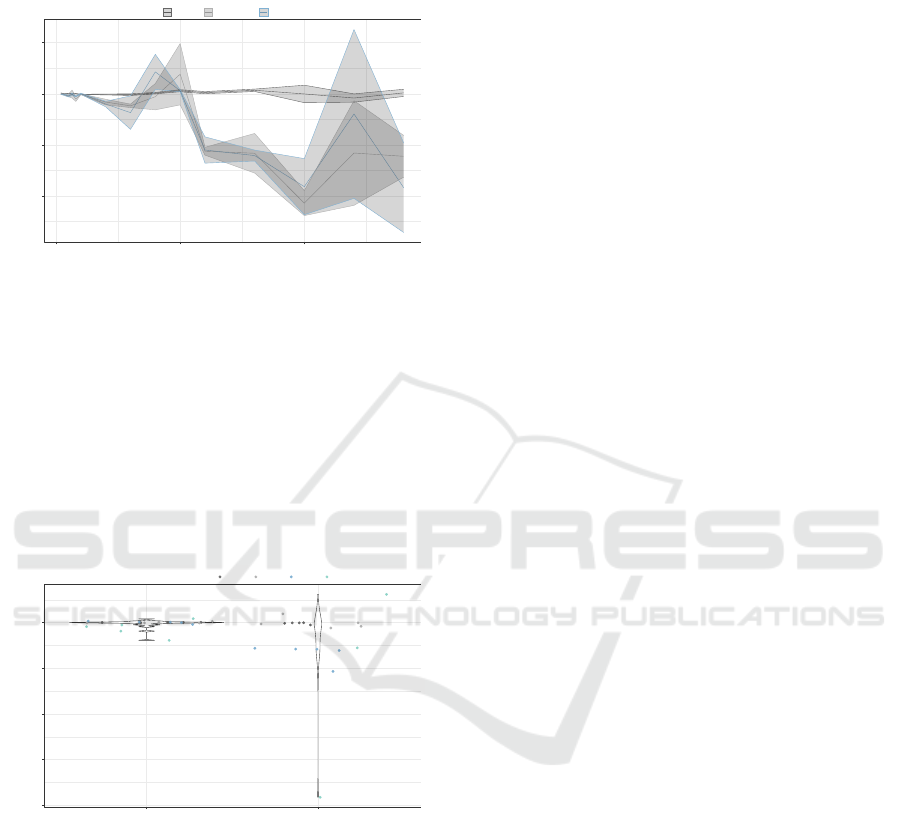
tances of measurement series A, B, and C. Addition-
ally, the corrected values of the stereoscopic approach
are shown in this figure. It is evident that the deviations
-100
-50
0
50
0 500 1000
distance [cm]
deviation [cm]
methode pit stereo stereo corrected
Figure 8: Deviations and their standard deviations for all
distances (d1 − d5) of measurement series A, B, and C.
of the stereoscopic approach even at short distances
are higher compared to the PIT approach and increases
more strongly with a rising distance. One reason for
the higher deviation in the stereoscopic approach are
deviations of the rotation vector sensor. Since this
sensor is a fused sensor, it is subject to gyroscopic
drift and is also influenced by the magnetic field of the
environment. This prevents true parallelism of both
image locations. A final comparison of all distances
-400
-300
-200
-100
0
pit stereo
methode
deviation [cm]
measurement series A B C D
Figure 9: Averaged measured values for all three measure-
ments for each measurement series.
confirms that the PIT approach is more accurate than
the stereoscopic approach (see Figure 9).
4.2 Overall Evaluation
The defined requirements are fulfilled by this applica-
tion and allow an ad hoc measurement, because, on
the one hand, they do not make any requirements on
the software or hardware and the other hand, in the
case of the PIT approach, they only show small tolera-
ble deviations over the whole range of distances. The
stereoscopic approach using only one camera, how-
ever, only works with large tolerances and can at best
be used as a comparative value.
5 CONCLUSION AND OUTLOOK
In this work we presented NAND-Measure - an app for
spatial measurement for the Android operating system.
This app implements two approaches - a stereoscopic
approach with only one camera and an approach based
on the pinhole camera model. These two approaches
were evaluated with a total of 60 measurements. The
results showed that the PIT approach is more accu-
rate for each of the distances than the stereoscopic
approach. One reason for the discrepancies in the
stereoscopic approach is that true parallelism cannot
be guaranteed with the rotation vector sensor. In future
work, we want to work on other sensors to guarantee
the parallelism. In general, we want to replace the
circular marker with a more generic one. In order to
further simplify the application, natural objects such
as buildings or cars should be considered. At the same
time, we want to extend the measurable distances and
minimize the deviations in order to integrate this appli-
cation into the above mentioned scenario and to make
a further step towards the mobile ad-hoc assessment
of bridges.
REFERENCES
Benndorf, M., Garsch, M., Haenselmann, T., Gebbeken,
N., and Videkhina, I. (2016). Mobile bridge integrity
assessment. In 2016 IEEE SENSORS, pages 1–3.
Benndorf, M., Haenselmann, T., Garsch, M., Gebbeken, N.,
Mueller, C. A., Fromm, T., Luczynski, T., and Birk,
A. (2017). Robotic bridge statics assessment within
strategic flood evacuation planning using low-cost sen-
sors. In Proceedings of the International Symposium
on Safety, Security and Rescue Robotics (SSRR), pages
13–18, Shanghai, China. IEEE.
Cao, Y.-T., Wang, J.-M., Sun, Y.-K., and Duan, X.-J. (2013).
Circle Marker Based Distance Measurement Using a
Single Camera. Lecture Notes on Software Engineer-
ing, pages 376–380.
Christensen, M. (2010). AndMeasure (Area & Distance).
Library Catalog: play.google.com.
Esri (n.d.). Distance measurement analysis. Library Catalog:
developers.arcgis.com.
Farmis (2013). GPS Fields Area Measure. Library Catalog:
play.google.com.
Google Developers (n.d.a). Build new augmented reality ex-
periences that seamlessly blend the digital and physical
worlds. Library Catalog: developers.google.com.
NAND-measure: An Android App for Marker-based Spatial Measurement
651

Google Developers (n.d.b). Fundamental concepts
|
ARCore.
Library Catalog: developers.google.com.
Mrovlje, J. and Vran, D. (2008). Distance measuring based
on stereoscopic pictures. . October, page 6.
NixGame (2016). Ruler. Library Catalog: play.google.com.
OpenCV Contributors (2018). OpenCv 3.4.1 for Android:
Bad JavaCamera2View performance.
Saxena, A., Chung, S. H., and Ng, A. Y. (2006). Learning
depth from single monocular images. In Advances in
neural information processing systems, pages 1161–
1168.
Smart Tools co. (2010). Smart Ruler. Library Catalog:
play.google.com.
VISAPP 2021 - 16th International Conference on Computer Vision Theory and Applications
652
