
Predicting Security Program Effectiveness in
Bring-Your-Own-Device Deployment in Organizations
Alexander O. Akande and Vu N. Tran
School of Business and Technology, Capella University, 225 S 6th St., Minneapolis, MN 55402, U.S.A.
Keywords: BYOD, Policy Awareness, Policy Enforcement, Policy Maintenance, Information Security, Information
Security Program Effectiveness.
Abstract: Bring Your Own Device (BYOD) adoption in organizations continues to grow in recent years, with the aim
to improve both organization cost-saving, employee job satisfaction, and employee productivity. An effective
BYOD security program enhances the chance of success of a BYOD deployment. This study evaluates the
applicability of the Knapp and Ferrante’s Information Security Policy and Effectiveness model for explaining
and predicting BYOD security program effectiveness. The relationships between the fundamental causal
factors in the model, namely awareness, enforcement, and maintenance, and program effectiveness, were
evaluated using a sample of 119 BYOD users working in the financial sector in the United States. Our
investigation shows support for utilizing this model to drive improvement in a BYOD deployment.
1 INTRODUCTION
The term Bring Your Own Device (BYOD) refers to
the policy of providing organization employees the
opportunity to use a personal computer and mobile
devices to access the organization’s services and data
through its secured intranet (Magruder, Lewis, Burks,
& Smolinski, 2015). BYOD adoption allows
expansion of the organization’s infrastructure without
a massive increase in investment in its own
equipment. Also, BYOD adoption helps individual
employees minimizing the need to maintain separate
personal and work equipment. The usage of
employee-own devices for work has improved both
the organization’s operating cost control, employee
productivity, employee innovation, and employee
satisfaction (Loucks, Medcalf, Buckalew, & Faria,
2013). Employee satisfaction research shows 71% in
favor of using personal devices for work (Drury &
Absalom, 2013). A study of managers and executives
finds 34% improvement in productivity when using
portable devices at work (Turek, 2016). Another study
finds 61% of Gen Y and 50% of 30+ tech-savvy
workers believe that their productivity significantly
improves when they use technologies in their
personal/social life over those used in their work-life
(Bless, Alanson, & Noble, 2010). A recent study by
(Doargajudhur & Dell, 2019) finds higher employees’
well-being, performance, and commitment among
those that utilize their mobile devices for work-related
tasks. Today’s large organizations implementing a
BYOD program include Google, Amazon, and
Facebook (Dolata, 2017).
Employees are beneficiaries of the organization’s
benefits in the BYOD environment. Enforcing BYOD
policy in an organization brings multiple
technological benefits that are valuable in a
competitive environment (Varbanov, 2014; Magruder
et al., 2015; Zahadat et al., 2015 Dietz, 2017). Users
have the flexibility to determine the type of device to
access a corporate infrastructure and can update the
software with the latest technologies and features.
When users can use personal devices, there can be an
increase in after-work collaboration (Dietz, 2017).
There is a significant increase in employees’
productivity with access to a more comfortable device
(Dietz, 2017; Varbanov, 2014). Executing a BYOD
policy can save businesses the money required to
purchase hardware for the employees, thereby
focusing and investing in an organization's human
resources development removes the burden of
managing hardware breaks and fixes from operational
processes (Dietz, 2017). Implementing an effective
BYOD policy allows the management of portable
devices to focus on the policy management level
instead of the device procurement level.
Akande, A. and Tran, V.
Predicting Security Program Effectiveness in Bring-Your-Own-Device Deployment in Organizations.
DOI: 10.5220/0010195800550065
In Proceedings of the 7th International Conference on Information Systems Security and Privacy (ICISSP 2021), pages 55-65
ISBN: 978-989-758-491-6
Copyright
c
2021 by SCITEPRESS – Science and Technology Publications, Lda. All rights reserved
55

On the contrary, BYOD has its constraints in the
business environment. According to Security (2019),
the policy lacks device uniformity arising from the
various operating systems within the environment.
There is employee privacy issue that need to be
addressed to have a seamless implementation. In
addition, legal issues may arise from the use of
proprietary application in a business environment.
Therefore, legal stipulations on the application and
data is a key portion of BYOD deployment often
overlooked.
Companies that have not adopted BYOD cite
security concerns as the main reason for their
hesitation (Tech Pro Research, 2014). These concerns
include security infrastructure deployment, policy
establishment, implementation, and cost control
(Disterer & Kleiner, 2013; Knapp & Ferrante, 2012;
Waterfill & Dilworth, 2014; and Zahadat, 2016).
Adopting BYOD requires a greater investment in the
organization’s infrastructure security to authorize,
track, and control employees’ access to their
resources via their personal devices. Adopting BYOD
then requires a careful balance of capability and
security, technology and policy, and security risks
versus cost savings (Zahadat, Blessner, Blackburn, &
Olson, 2015). An effective BYOD security program
is needed to ensure a successful BYOD deployment
(Doargajudhur & Dell, 2019). Little scientific
research was to develop a theoretical foundation for
this wide-spread phenomenon (Doargajudhur & Dell,
2019).
This quantitative study attempts to develop a
theoretical foundation for the adoption of BYOD in
organizations. Specifically, this study investigates the
applicability of the ISPPE model introduced by
Knapp and Ferrante (2012) in explaining BYOD
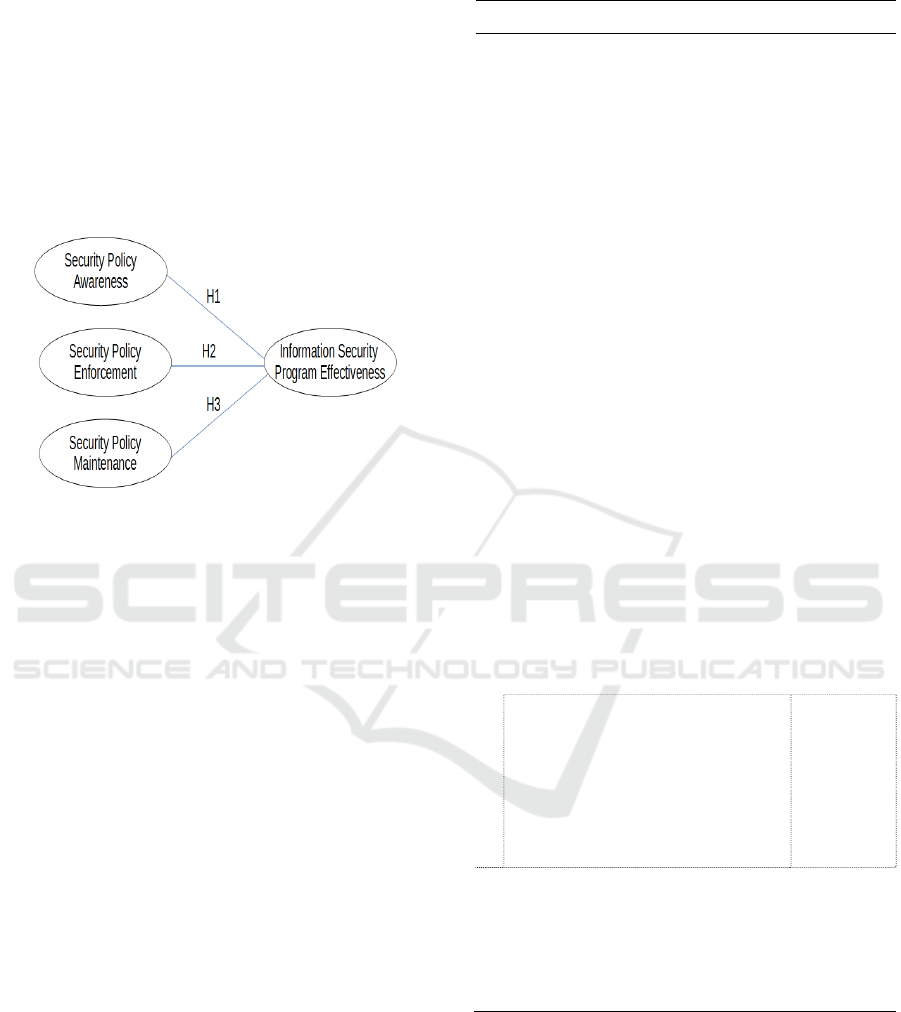
security program effectiveness. The ISPPE model
identifies three fundamental causal factors of an
effective security program are: security policy
awareness, security policy enforcement, and security
policy maintenance. Understanding the relationships
between these factors and program effectiveness in a
BYOD deployment allows the development of a
model for predicting BYOD security program
effectiveness.
2 BACKGROUND
Research on how to improve information security
program effectiveness continues to report significant
findings. Studies on the relationship between security
awareness and security compliance, for instance,
confirm a positive correlational relation between
awareness and compliance, resulting in increased
support for the implementation of security awareness
training as a means to enhance security compliance in
organizations (Bulgurcu, Cavusoglu, & Benbasat,
2010; Chatterjee, Sarker, & Valacich, 2015; Chu &
Chau, 2014; D’Arcy, Hovav, & Galletta, 2009; Dinev
& Hu, 2007; Siponen, Adam Mahmood, & Pahnila,
2014). Studies of the relationship between
personality and intention to violate security policy, in
another instance, find certain personality traits help
moderate such intentions in some situations
(Johnston, Warkentin, McBride, & Carter, 2016).
These studies identify that certain personality traits
are more susceptible to policy violations in
organizations.
Studies of the relationship between personal
ethics and security, like (Dinev & Hu, 2007; Xu & Hu,
2018), find a positive correlation between these
constructs, leading to the recommendation that
screening employees with a high level of self-control
and strong moral beliefs for positions requiring handle
of sensitive materials. Studies based on general
deterrence theory like (Schuessler, 2009;
Theoharidou, Kokolakis, Karyda, & Kiountouzis,
2005) support strong disincentives and sanctions,
including punishments, as a means to dissuade
security policy violation. Studies based on situational
crime prevention theory like (Padayachee, 2016; Safa,
Maple, Watson, & Von Solms, 2018) find that
lowering the perceived benefits of security policy
violation helps decrease employees' chance of
committing the actual violation.
Studies on positive reinforcement such as (Chen,
Ramamurthy, & Wen, 2015) find that focusing on
rewards for security compliance could be a more
effective solution than focusing on punishments in
enhancing security compliance. Studies investigating
the relationship between organizational leadership
and information security program effectiveness, such
as Grant (2017), find that strong security culture is
critical to a successful security program
implementation. Studies on the integrative approach
to security management like (Zahadat et al., 2015)
recommends the combination of people, policy, and
technology to ensure security management
implementation effectiveness.
Most interesting to this study is the work of Knapp
and Ferrante (2012). Using the insight from
workplace deviance and organizational learning
literature, the authors proposed a model for
understanding information security program
effectiveness. Their Information Security Policy and
Effectiveness model describe three causal factors:
security policy awareness, security policy
ICISSP 2021 - 7th International Conference on Information Systems Security and Privacy
56

enforcement, and security policy maintenance, which
the authors argued are fundamental factors for
measuring security program effectiveness. Security
policy awareness reflects the general awareness of the
security policies within the organization. Security
enforcement reflects how policy violation
punishments are enforced. Policy maintenance
reflects how well the organization maintains its
security policies. Together, these three fundamental
factors explain the effectiveness of a security
program. Utilized a sample of 297 certified
information security experts in the United States, the
authors developed an information security policy
management model for explaining security program
effectiveness in organizations. Their study confirmed
the proposed model. Knapp and Ferrante (2012)
recommended additional studies investigating the
model using non-security professionals to evaluate
their model further.
The purpose of this quantitative study is to
evaluate the viability of applying Knapp and
Ferrante’s ISPPE model in evaluating and predicting
the effectiveness of the security program in a BYOD
deployment. Specifically, our study evaluates how
well the model’s fundamental causal factors can
explain the effectiveness of the security program
supporting a BYOD deployment. We also seek to
develop a specific model for predicting the program’s
effectiveness. Follow a recommendation of the
model’s authors (2012), and we utilize non-security
professionals in our study.
3 RESEARCH DESIGN
3.1 Research Method
Our quantitative study investigated how the ISPPE
causal factors, i.e., awareness, enforcement, and
maintenance, impact security program effectiveness
in a BYOD deployment. Our study's four main
constructs were Policy Awareness, Policy
Enforcement, Policy Maintenance, and Program
Effectiveness. We adopted the definitions of these
constructs from (Knapp & Ferrante, 2012). These
four constructs were operationalized by the variables
in the survey instrument developed in the same study
to support the testing of the model (2012). A copy of
the instrument is available in Appendix A. Our main
research question was: how does the information
security policy awareness, enforcement, and
maintenance influence the effectiveness of the
security program in a BYOD deployment? This
study's specific sub-questions are listed below,
supported by the three pairs of hypotheses
documented in Table 1. These hypotheses are similar
to those introduced in the Knapp and Ferrante study
(2012).
Sub-question 1: Does information security policy
awareness influence information security program
effectiveness in a BYOD environment?
Sub-question 2: Does information security policy
enforcement influence information security
program effectiveness in a BYOD environment?
Sub-question 3: Does information security policy
maintenance influence information security
program effectiveness in a BYOD environment?
Table 1: Hypotheses.
Sub-
questi
on
Hypothesis
1 H1
0
: Information security awareness is not
positively associated with information security
program effectiveness
H1
a
: Information security awareness is
positively correlated with information security
p
rogram effectiveness
2 H2
0
: Information security enforcement is not
positively associated with information security
program effectiveness
H2
a
: Information security enforcement is
positively correlated with information security
p
ro
g
ram effectiveness
3 H3
0
: Information security maintenance is not
positively associated with information security
program effectiveness
H3
a
: Information security maintenance is
positively correlated with information security
p
rogram effectiveness
We adopted the position taken by Knapp and
Ferrante (2012) that these relationships are causal
relationships. Security policy awareness,
enforcement, and maintenance as causal factors of
program effectiveness were also suggested in many
of the studies mentioned in the Background section of
this study. We expected to find these relationships to
be positively correlated, as were found in the original
study. Knapp and Ferrante’s ISPPE model (2012) is
shown in Figure 1.
3.2 Survey Design
Our study uses the 20-item Likert scale (1-5), a
survey questionnaire introduced in (Knapp &
Ferrante, 2012). The twenty survey questions are
equally divided among the three independent
Predicting Security Program Effectiveness in Bring-Your-Own-Device Deployment in Organizations
57
variables, Policy Awareness (PA), Policy
Enforcement (PE), and Policy Maintenance (PM),
and one dependent variable, Information Security
Program Effectiveness (IE). The five questions for
measuring Policy Awareness are labeled as PA1-PA5.
The four questions used for measuring Policy
Enforcement are labeled as PE1-PE4. The four
questions used for measuring Policy Maintenance are
PM1-PM4. The ones used for Information Security
Program Effectiveness, IE1-IE5. No modification to
this instrument was required for our study.
Figure 1: Information Security Management Model.
Knapp and Ferrante’s study (2012) evaluated the
instrument's validity for convergent validity,
discriminant validity, intrusiveness, and construct
validity. All the correlations between the construct
and the composite construct values were significant
at the p < 0.01 level. All the loadings were considered
more significant than the 0.707 threshold value,
indicating that the latent construct captured more than
half of the variance. Cronbach alpha (α) of each
variable supported by the instrument showed α > 0.70
demonstrating acceptable reliability. Detailed
information on the instrument and its validity can be
found in Knapp and Ferrante (2012).
3.3 Population and Sampling
Our study's target population was adults of at least 18-
years old working in the financial sector in the United
States. The reason for our focus on the US financial
sector was that this sector has continually been one of
the most prominent adopters of BYOD (Albinus,
2013). A report from the Department of Labor’s
Bureau of Labor Statistics (May 2017 National
Occupational Employment and Wage Estimates,
2018) estimates that there are over 2.5 million
financial specialists in the US.
Table 2: Participants Demographic Characteristics.
Categories n (%)
Age
<18
18-29
30-44
45-60
>60
0 (0.00)
37 (31.09)
54 (45.38)
24 (20.17)
4 (3.36)
Sex
Female
Male
67 (56.30)
52
(
43.70
Education Level
Primary School
High School but no Diploma
High School Diploma
College but no Degree
2-year college degree
4-year college
Graduate-level degree
Others
1 (0.84)
2 (1.68)
16 (13.43)
22 (18.49)
10 (8.40)
43 (36.13)
24 (20.17)
1 (0.84)
Average Household Income
<$25,000
$25,000 – $49,999
$50,000 – $74,999
$75,000 - $99,999
$100,000 - $124,999
$125,000 - $149,999
$150,000 - $174,999
$175,000 - $199,999
>$200,000
3 (3)
17 (14.3)
23 (19.3)
34 (28.6)
11 (9.2)
11 (9.2)
10 (8.4)
2 (1.7)
8
(
6.7
)
Mobile Phone Usage
Much more often for work
Somewhat more often for work
Slightly more often for work
Equal for work and personal use
Slightly more often for personal use
Somewhat more often for personal
use
Much more often for personal use
16 (13.4)
17 (14.3)
7 (5.9)
20 (16.8)
13 (10.9)
11 (9.2)
35 (29.4)
Device Type
IOS Phone
Android Phones
Other Phones
Windows Desktop/Laptop
Mac OS Desktop
46 (38.66)
37 (31.09)
0 (0.00)
29 (24.37)
6 (5.04)
Note. n = number of participants; % = percentage of
participants.
Table 2 shows the demographic characteristics
considered in the research. Sample data was collected
through an online survey company SurveyMonkey
(SurveyMonkey, 2019). Per our contract, the
SurveyMonkey service implemented the random
sampling strategy, ensuring access to our survey will
ICISSP 2021 - 7th International Conference on Information Systems Security and Privacy
58

be based on a first-come-first-serve basis and is
available to its 15 million active survey participating
members. Qualified SurveyMonkey service’s
registered participants were invited to participate in
our survey. The SurveyMonkey service ensured that
only those who fit our selection criteria would be
qualified to participate in our study. The selection
criteria we provided to this service were: 1) a person
who currently works in the financial sector in the
United States, 2) a person who is at least 18 years old,
and 3) a person who is using a personal
desktop/laptop and/or mobile devices to access his or
her organization network.
We utilized G*Power 3.1 (Faul, Erdfelder, Lang,
& Buchner, 2007) to determine our study's sample
size. This tool required three inputs to estimate a
sample size: the required power level (1-β), the
significance level α, and the estimated population
effect size (Faul et al., 2007). Power analysis showed
that a sample size of 119 was sufficient to estimate a
model with an estimated effect size of 0.15, power
level 0.95, α < 0.05, and 3 predictors. We then asked
the SurveyMonkey service to provide us with at least
119 usable survey responses. Usable survey
responses are those that were filled out completely by
each participant, contained no apparent suspected
data, and were not outliers in this sample.
3.4 Data Collection and Analysis
The SurveyMonkey service randomly selected
individuals within their database of available
participants who met the criteria we provided and sent
them an email invitation with a link to participate in
our survey. Qualified participants took the survey
anonymously on a first-come-first-serve basis until a
target number of responses, i.e., 230, were received.
The raw data was made available to download and
evaluate daily to determine how many good responses
were received. If we could not reach our goal of
getting 119 good survey responses out of the batch of
230 responses that SurveyMonkey collected, the
service will initiate a new round of survey invitations
to collect additional responses for us. Microsoft
Excel 2010 and IBM Statistical Package for the
Social Sciences (SPSS©) Statistics Grad Pack
version 25.0 was used for the data analysis (SPSS,
2020).
4 RESULTS
4.1 Data Descriptions and Analysis
As the survey responses are pulled down from the
SurveyMonkey service, we reviewed each response
and rejected incomplete responses and bad responses.
Incomplete responses were rejected. Bad responses,
those with answers not randomized, e.g., all 1s, were
also rejected. Once the number of usable responses
reached beyond 119 cases, we started evaluating for
outliers. We utilized the SPSS’s Mahalanobis
Distance calculation to identify and remove outliers
based on their relative distance from the mean value
derived from all three independent variables (SPSS,
2020). The collection of survey responses stopped
once 119 usable responses were received.
Table 3 describes the responses received from
individual participants according to the categories of
the questions. We observed the following patterns in
these 119 responses:
IE1 – IE5. A high proportion of the
participants either agreed or strongly agree
with the entire questions in this category.
Only a few participants disagree or strongly
disagree with all the questions in this
category. For instance, 88.3% of the
participants agreed (A) or strongly agreed
(SA) with statement E1; 84.9% of the
participants agreed (A) or strongly agreed
(SA) with statement E2; 84.0% agreed with
statement E3; and 81.6% for E4; and so
forth.
PA1 – PA5. A high proportion of the
participants either agreed or strongly agree
with the entire questions in this category.
Only a few participants disagree or strongly
disagree with all the questions in this
category.
PE1 – PE4. A high proportion of the
participants either agreed or strongly agree
with the entire questions in this category.
Only a few participants disagree or strongly
disagree with all the questions in this
category.
PM1 – PM4. A high proportion of the
participants either agreed or strongly agree
with the entire questions in this category.
Only a few participants disagree or strongly
disagree with all the questions in this
category.
Predicting Security Program Effectiveness in Bring-Your-Own-Device Deployment in Organizations
59
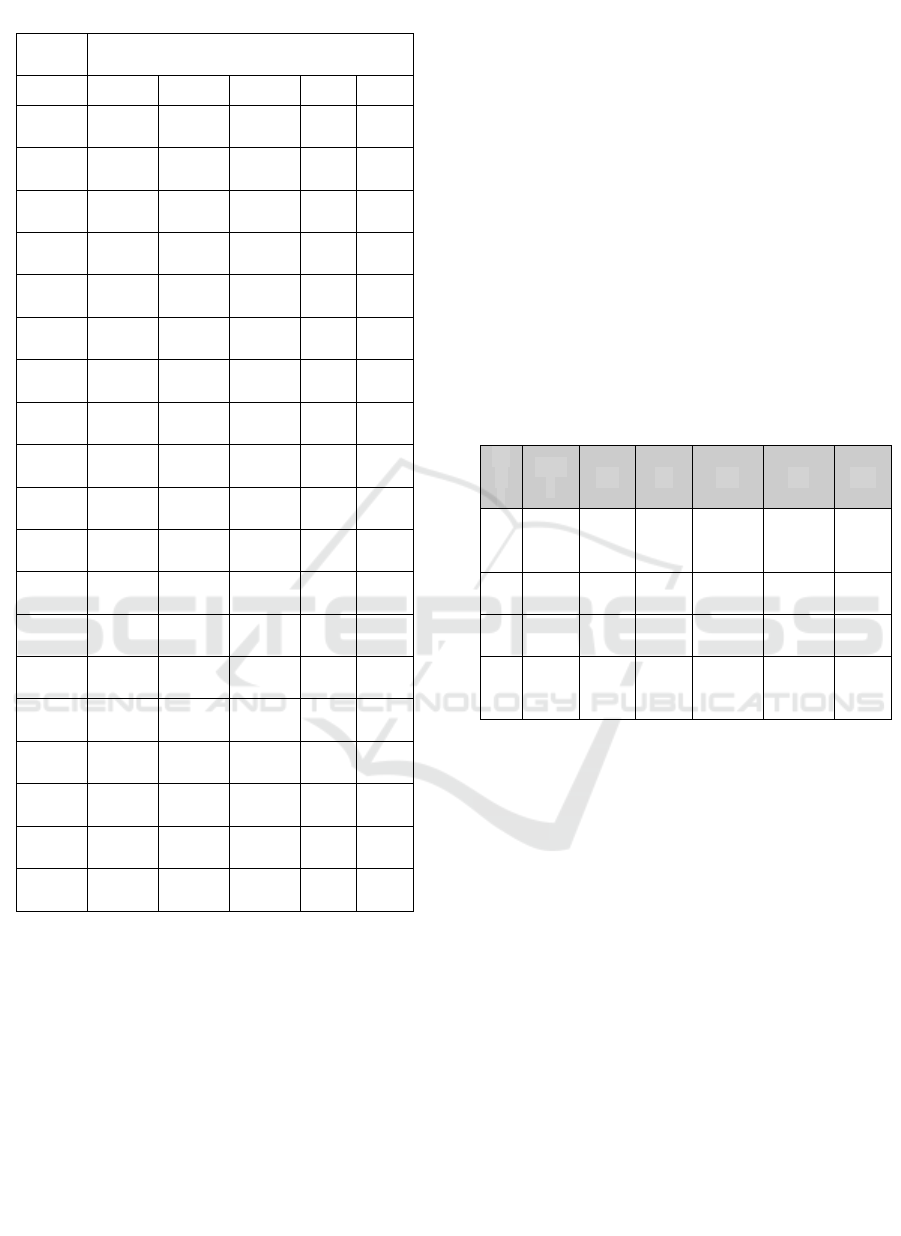
Table 3: Frequency Distribution of Likert Scale Responses.
State
ment Likert Scale
SA A N D SD
n
(
%
)
n
(
%
)
n
(
%
)
n
(
%
)
n
(
%
)
IE1
54
(45.4)
51
(42.9)
12
(10.1)
1
(0.8)
1
(0.8)
IE2
46
(
38.7
)
55
(
46.2
)
11
(
9.2
)
5
(
4.2
)
2
(
1.7
)
IE3
58
(
48.7
)
42
(
35.3
)
15
(
12.6
)
3
(
2.5
)
1
(
0.8
)
IE4
53
(44.5)
48
(40.3)
12
(10.1)
2
(1.7)
4
(3.4)
IE5
51
(42.9)
46
(38.7)
16
(13.4)
5
(4.2)
1
(0.8)
PA1
59
(
49.6
)
41
(
34.5
)
13
(
10.9
)
4
(
3.4
)
2
(
1.7
)
PA2
59
(49.6)
40
(33.6)
15
(12.6)
3
(2.5)
2
(1.7)
PA3
60
(50.4)
39
(32.8)
13
(10.9)
6
(5.0)
1
(0.8)
PA4
54
(
45.4
)
47
(
39.5
)
15
(
12.6
)
2
(
1.7
)
1
(
0.8
)
PA5
53
(
44.5
)
44
(
37.0
)
14
(
11.8
)
5
(
4.2
)
3
(
2.5
)
PE1
54
(45.4)
42
(35.3)
18
(15.1)
3
(2.5)
2
(1.7)
PE2
48
(
40.3
)
44
(
37.0
)
23
(
19.3
)
2
(
1.7
)
2
(
1.7
)
PE3
61
(
51.3
)
35
(
29.4
)
19
(
16.0
)
2
(
1.7
)
2
(
1.7
)
PE4
64
(53.8)
35
(29.4)
13
(10.9)
3
(2.5)
4
(3.4)
PM1
54
(
45.4
)
40
(
33.6
)
17
(
14.3
)
7
(
5.9
)
1
(
0.8
)
PM2
50
(
42.0
)
49
(
41.2
)
14
(
18.8
)
3
(
2.5
)
3
(
2.5
)
PM3
52
(43.7)
42
(35.3)
18
(15.1)
4
(3.4)
3
(2.5)
PM4
52
(43.7)
41
(34.5)
18
(15.1)
7
(5.9)
1
(0.8)
Note: SA = Strong Agree; A = Agree; N = Neither agree
nor disagree; D= Disagree; SD=Strongly Disagree; n =
number of participant responses. IE1-IE5 = Information
Security Program Effectiveness; PA1-PA5 = Policy
Awareness; PE1-PE4 = Policy Enforcement; PM1-PM4 =
Policy Maintenance
The sample descriptive statistics were computed
and are summarized in Table 4. The Mean represents
the center of the data distribution. The average
variability of the data set is the standard deviation
(SD). The Pearson product-moment correlation
measures the monotonic association between two
variables (Schober, Boer, & Schwarte, 2018). PA, PE,
and PM exhibited a relatively high correlation with
IE, as well as among themselves. The p-value
evaluates the statistical significance of the
correlational relation between individual independent
and dependent variables confirmed the positive
correlations between PA, PE and PM, and IE. All
three correlations are statistically significant (i.e., p-
value <.01).
The Reliability test was used to compute the
Cronbach alpha values of 0.891, 0.887, 0.867, and
0.865 for IE, PA, PE, and PM, respectively.
Constructs with Cronbach alpha value that is greater
than 0.4 have excellent reliability (Tavakol, &
Dennick, 2011). All the constructs used in our study
had a relatively high Cronbach alpha value, i.e.,
greater than 0.4, confirming that valid constructs
characterized the study items were used in the study.
Table 4: Correlation, Descriptive Statistics, and Cronbach
Alpha.
Sc
al
e
Mea
n
SD IE PA PE PM
IE
1.76
9
0.72
-
0.89
1
0.816 0.77
0.80
5
P
A
1.75
1
0.74
7
0.81
6**
-0.887 0.807
0.86
7
P
E
1.78
2
0.78
3
0.77
0**
0.807
**
-0.867
0.77
9
P
M
1.84
2
0.79
5
0.80
5**
0.867
**
0.779
**
-
0.86
5
Note: n = 119. Items in parentheses are Cronbach alpha
reliabilities. ** p < .01. IE= Information Security Program
Effectiveness; PA = Policy Awareness; PE = Policy
Enforcement; PM = Policy Maintenance. SD = Standard
Deviation.
4.2 Analysis of Hypotheses
Based on the study results described in Table 5, the
null hypotheses H1
0
,
H2
0
,
and H3
0
were rejected due
to p < 0.01, and the alternative hypotheses H1
a
, H2
a
,
and H3
a
, were accepted. Our results support Knapp
and Ferrante’s theory that effective information
security policy awareness, enforcement, and
maintenance have a positive effect on information
security program effectiveness in a BYOD
deployment.
To develop a model for predicting BYOD security
program effectiveness, we employed multiple linear
regression analysis. Stepwise regression forward
selection procedure was used to build the model and
examine the importance and criteria of variables
ICISSP 2021 - 7th International Conference on Information Systems Security and Privacy
60
entered into the model for testing the research
hypotheses (Field, 2018). Table 5 showed the data for
constructing a model for predicting the effectiveness
of a BYOD security program.
Table 5: Multiple Regression Analysis.
IE β S.E
t-
value
P VIF
PA 0.33 0.105 3.153 0.002 4.901
PM 0.285 0.093 3.079 0.003 4.36
PE 0.228 0.079 2.882 0.005 3.086
Note. N=119. The test of hypotheses of β =0 are based on t-
values, df = 117. R
2
= 0.724, Adj. R
2
=.0.717; *p< 0.05. IE=
Information Security Program Effectiveness; PA = Policy
Awareness; PE = Policy Enforcement; PM = Policy
Maintenance. β = Beta; S.E = Standard Error; P =
Significance; VIF = Variance Inflation Factor; p =
probability of rejecting the null hypothesis.
The predictive model derived from the multiple
regression analysis is:
IE = 0.33PA + 0.23PE + 0.28PM
This predictive model indicates that a unit increase
in information security policy awareness resulted in a
0.330 unit increase in the information security
program effectiveness in a BYOD deployment. A unit
increase in policy maintenance resulted in a 0.285
increase in the information security program
effectiveness in a BYOD deployment. Finally, a unit
increase in policy enforcement resulted in a 0.228
increase in the information security program
effectiveness in a BYOD deployment.
Our predictive model was statistically significant
at F (3,115) = 100.42, p < 0.001, with an overall R
2
=0.724, i.e., 72.4% of the information security
program effectiveness in a BYOD environment can
be explained by the three fundamental information
security policy management (awareness,
enforcement, and policy maintenance) causal factors.
Cohen statistic was computed from the squared
multiple correlation coefficient to measure the
model's overall effect size (Cohen, 1992). According
to Cohen (1992), an F
2
of 0.5 to be a small effect, F
2
of 1.5 a medium effect, and F
2
of 3.5 a significant
effect. With the computed effect size of 2.6, the study
found that information security policy awareness,
policy maintenance, and policy enforcement have a
considerably practical effect on a BYOD
environment's information security program
effectiveness.
The results of the analysis were further verified by
testing the assumptions identified in the regression
model. The diagnostics measures included the
variance inflation factor (VIF), heteroscedasticity,
and normality tests. Table 5 shows the calculated VIF
values using the variables to test for multicollinearity.
Multicollinearity occurs when two or more variables
relate very closely in a linear fashion (Field, 2018).
These values show that the degree of multicollinearity
is low across the model; none of the variables has a
VIF value greater than 10. It means that the regression
model is free of multicollinearity.
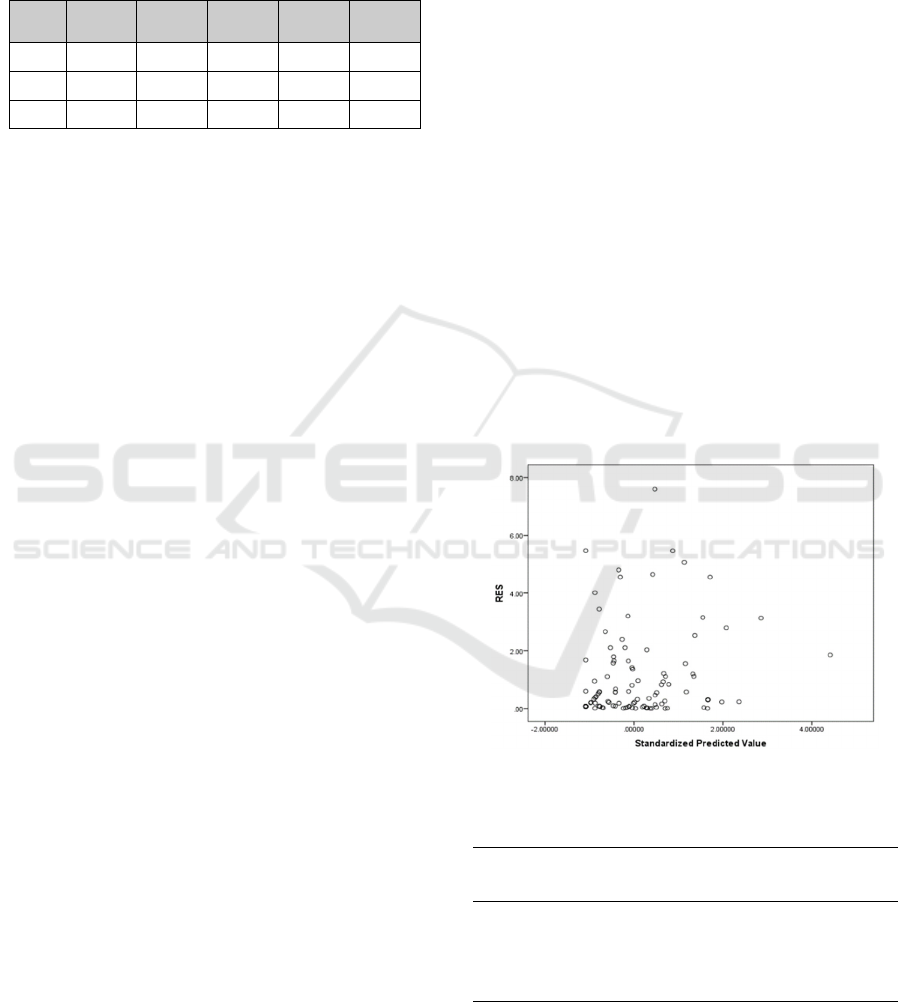
Figure 2 shows a visual test of heteroscedasticity
conducted by plotting a scattered diagram of the
residual value against the predicted value. The
scattered diagram revealed that the spread of the
residuals plotted against the predicted value was
scattered (i.e., the residuals were getting more
significant as the predicted value increased), which is
a visual indication of the violation of the equal
variance assumption. The test was further verified
with the Breusch-Pagan test using Table 6.
The
Breusch-Pagan test examined the null hypothesis of
equal variance (Klein, Gerhard, Büchner, Diestel, &
Schermelleh-Engel, 2016). As observed from Table 5,
the test computed a p value, which is lower than 0.05,
p < 0.022. The null hypothesis was rejected and
concluded that the model faces heteroscedasticity
problems.
Figure 2: The plot of residuals against predicted value.
Table 6: Breusch-Pagan Test.
Source Sum of
Squares
Df Mean
Square
F Sig.
Regression 5.181 1 5.181 5.373 .022
Residuals 112.819 117 .964
Total 118.000 118
Note. df = degree of freedom; F = F Statistic; Sig. =
Significance.
A histogram is used for the normality test to show
the frequency distribution (Field, 2018). The
Predicting Security Program Effectiveness in Bring-Your-Own-Device Deployment in Organizations
61
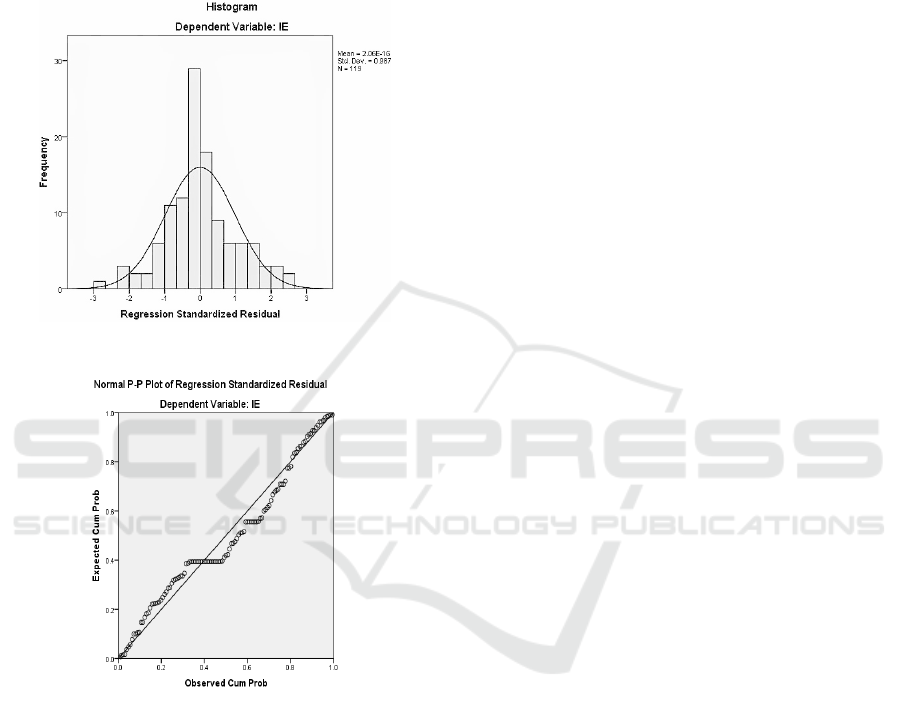
histogram shown in Figure 3 indicates that the
residual of the fitted model was approximately
normal and did not violate the normality assumption.
A Normal P-P plot, as shown in Figure 4 was tested
to determine further if the data set is approximately
normally distributed. Since the points formed an
approximately straight line, the distribution is normal.
Figure 3: Normality plot.
Figure 4: Normal P-P plot of regression standardized
residual.
4.3 Interpretations of Findings
The results indicate that information security policy
awareness has a more significant effect on the
information security program effectiveness than
information security policy enforcement and
maintenance. This finding matches what was
reported from Knapp and Ferrante’s study (2012). In
addition to confirming the results of the Knapp and
Ferrante (2012) previous study, this finding also
supports the position that organizations can maximize
the return on investment in security policy
management by putting more resources into
improving security awareness among their
employees. Knapp and Ferrante suggest that greater
investment in awareness training can help lower the
need to invest in enforcement (2012). Organizations
adopting BYOD should emphasize implementing
security policy awareness and training as a priority.
Information security policy enforcement has the
smallest effect on information security program
effectiveness. This finding does not match what was
reported from Knapp and Ferrante’s study (2012).
The Knapp and Ferrante (2012) study found
information security policy maintenance having the
smallest effect. This difference could be due to
domain-specific factors associated with the
deployment of BYOD within the financial sector.
Further testing of the model with BYOD deployments
in non-financial sectors can confirm if this finding is
related to BYOD deployment in the financial sector.
This study further validates the model originally
developed by Knapp and Ferrante (2012). One
extension to the original study is using BYOD users
who are not security experts to evaluate the proposed
model. The second is the focus on a specific
application domain, BYOD, in the financial sector.
The results show that the three relationships are
positively correlated, statistically significant, and
practically significant, similar to the findings reported
in Knapp and Ferrante’s (2012) study. This finding
confirms that the ISPPE model’s fundamental
security policy management factors can explain 72%
of the effectiveness of the BYOD security program.
The model IE = 0.33PA + 0.23PE + 0.28PM
derived from this study can predict the effectiveness
of the information security program associating with
a BYOD deployment based on measuring BYOD
users’ perceptions of the strength of the information
security awareness, enforcement, and maintenance
within their organizations.
Our findings show a recognition among BYOD
users within the financial sector that security policy
awareness, enforcement, and maintenance are
essential factors for an effective BYOD security
program. This acceptance suggests that financial
organizations rolling out security policy management
measures to bolster BYOD security will not likely
receive significant employee resistance.
Finally, our study contributes to the call for more
scientific research studies in support of the BYOD
phenomenon (Doargajudhur & Dell, 2019). Our
results demonstrate the applicability of the ISPPE
model (2012) to explaining and predicting the
effectiveness of the security policy program of a
BYOD deployment. Security policy awareness,
enforcement, and maintenance are fundamental
ICISSP 2021 - 7th International Conference on Information Systems Security and Privacy
62

causal factors in implementing an effective BYOD
security program.
5 CONCLUSION, LIMITATIONS,
AND RECOMMENDATIONS
BYOD deployment poses security challenges to
organizations that want to broaden their infrastructure
to include employee-own networked devices. Failure
to implement an effective information security
program can expose the organization to significant
security breaches and data loss (Magruder et al.,
2015). An effective information security program is
needed to ensure the success of a BYOD deployment.
This study investigates the use of the Information
Security Policy and Effectiveness model to explain
the performance of a BYOD deployment's
information security program. The results of our
study confirm the theory behind the model that
focusing on enhancing security policy awareness,
enforcement, and maintenance can improve the
effectiveness of an information security program in a
BYOD deployment in organizations.
Although there is sufficient evidence supporting
the theory investigated, there are several limitations
worth mentioned. First, our study contributes only
one data point to confirm the theory being evaluated.
More studies are necessary to confirm the
applicability of the model in a BYOD deployment.
Second, our findings came from a survey of non-
security participants; we could share them with
security experts for their perspectives. Third, we
utilized only BYOD users’ perception of the
effectiveness of the BYOD program implementation
instead of more objective approaches, such as
evaluating hard evidence collected by the
organizations. Analysis of organization data helps
confirm the usefulness of our model. Fourth, this
study relies only on participants from within the
financial industry in the United States. New studies
using participants from other industries will help test
the generality of the model.
Finally, the scope of this study was limited to only
three possible contributing factors of an information
security policy program effectiveness. There are
many other possible contributing factors to uncover
and evaluate. These possible factors include security
risk assessment, employee monitoring, managerial
approval, organizational culture, and policy
development. Researchers are encouraged to expand
on this study to include these potential contributing
factors.
REFERENCES
Albinus, P. (2013). Industry continues support of BYOD
initiatives. Fierce Finance IT. Retrieved from ProQuest
Database. (Order NO. 1466199562).
Bless, E., Alanson, M., & Noble, C. (2010).
Consumerization: What is in store for IT?
http://i.dell.com/sites/content/business/solutions/white
papers/it/Documents/intel-imr-consumerization-
wp_it.pdf
Bulgurcu, B., Cavusoglu, H., & Benbasat, I. (2010).
Information security policy compliance: an empirical
study of rationality-based beliefs and information
security awareness. MIS Quarterly, 34(3), 523-548.
Chatterjee, S., Sarker, S., & Valacich, J. S. (2015). The
behavioral roots of information systems security:
Exploring key factors related to unethical IT use.
Journal of Management Information Systems, 31(4),
49–87. doi:10.1080/07421222.2014.1001257.
Chen, Y., Ramamurthy, K., & Wen, K. (2015). Impacts of
comprehensive information security programs on
information security culture. Journal of Computer
Information Systems, 55(3), 11–19.
doi:10.1080/08874417.2015.11645767.
Chu, A. M. Y., & Chau, P. Y. K. (2014). Development and
validation of instruments of information security
deviant behavior. Decision Support Systems, 66, 93–
101. doi:10.1016/j.dss.2014.06.008.
Cohen, J. (1992). A power primer. Psychological Bulletin,
112(1), 155. doi:10.1037/0033-2909.112.1.155.
D’Arcy, J., Hovav, A., & Galletta, D. F. (2009). User
awareness of security countermeasures and its impact
on information systems misuse: a deterrence approach.
Information Systems Research, 20(1), 79-98.
Dietz, L. (2017). Avoiding BYO policy and security pitfalls.
Five practical case studies to help you recognize and
address potential threats from using personal devices at
work. Citrix. Retrieved from
https://www.citrix.com/content/dam/citrix/en_us/docu
ments/products-solutions/avoiding-byo-policy-and-
security-pitfalls.pdf
Dinev, T., & Hu, Q. (2007). The centrality of awareness in
the formulation of user behavioral intention toward
protective information technologies. Journal of the
Association for Information Systems, 8(7), 386-408.
Disterer, G., & Kleiner, C. (2013). “BYOD bring your own
device”, Procedia Technology, 9, 43-53, doi:
10.1.1016/j.protcy.2013.12.005.
Doargajudhur, M. S., & Dell, P. (2019). Impact of BYOD
on organizational commitment: an empirical
investigation. Information Technology & People, 32(2),
246-268. doi: 10.1108/ITP-11-2017-0378.
Dolata, U. (2017). Apple, Amazon, Google, Facebook,
Microsoft: Market concentration-competition-
innovation strategies (Report No. 2017-01). Retrieved
from Stuttgarter Beiträge zur Organisations-und
Innovationsforschung, SOI website:
http://hdl.handle.net/10419/152249.
Drury, A., & Absalom, R. (2013). BYOD: An emerging
market trend in more ways than one. Retrieved from
Predicting Security Program Effectiveness in Bring-Your-Own-Device Deployment in Organizations
63

https://www.logicalis.com/globalassets/group/pdf-
files/logicalisbyodwhitepaperovum.pdf.
Faul, F., Erdfelder, E., Lang, A. G., & Buchner, A. (2007).
G*Power 3: A flexible statistical power analysis
program for the social, behavioral, and biomedical
sciences. Behavior Research Methods, 39, 175–191.
Field, A. (2018). Discovering statistics using SPSS
statistics (5th ed.), (pp. 334–368). Thousand Oaks, CA:
Sage.
G*Power (2020). G*Power: Statistical power analyses for
Windows and Mac. Retrieved from
https://www.psychologie.hhu.de/arbeitsgruppen/allge
meine-psychologie-und-
arbeitspsychologie/gpower.html.
Grant, R. L. (2017). Exploring effects of organizational
culture upon implementation of information security
awareness and training programs within the defense
industry located in the Tennessee valley region
(Doctoral dissertation). Retrieved from ProQuest
Dissertations and Theses database. (Order No.
10646759).
Johnston, A. C., Warkentin, M., McBride, M., & Carter, L.
(2016). Dispositional and situational factors: Influences
on information security policy violations. European
Journal of Information Systems, 25(3), 231–251.
doi:10.1057/ejis.2015.15.
Klein, A. G., Gerhard, C., Büchner, R. D., Diestel, S., &
Schermelleh-Engel, K. (2016). The detection of
heteroscedasticity in regression models for
psychological data. Psychological Test and Assessment
Modeling, 58(4), 567–592.
Knapp, K. J., & Ferrante, C. J. (2012). Policy awareness,
enforcement, and maintenance: Critical to information
security effectiveness in organizations. Journal of
Management Policy and Practice, 13(5), 66–80.
Retrieved from
http://www.nabusinesspress.com/JMPP/KnappKJ_We
b13_5_.pdf.
Loucks, J., Medcalf, R., Buckalew, L., & Faria, F. (2013).
The financial impact of BYOD: A model of BYOD’s
benefits to global companies. Retrieved from
https://www.cisco.com/c/dam/global/ru_ua/assets/pdf/
byod-economics_econ_analysis.pdf.
Magruder, J. S., Lewis, S. X., Burks, E. J., & Smolinski, C.
(2015). Bring your own device (BYOD): Who is
running organizations? Journal of Accounting and
Finance, 15(1), 55–61. Retrieved from http://www.na-
businesspress.com/JAF/BurksEJ_Web15_1_.pdf
May 2017 National Occupational Employment and Wage
Estimates. (2018, March 30). Retrieved from
https://www.bls.gov/oes/current/oes_nat.htm#15-0000.
Padayachee, K. (2016). An assessment of opportunity-
reducing techniques in information security: An insider
threat perspective. Journal of Decision Support
Systems, 92, 47-56. doi: 10.1016/j.dss.2016.09.012.
Safa, N. S., Maple, C., Watson, T., & Von Solms, R.
(2018). Motivation and opportunity-based model to
reduce information security insider threats in
organisations. Journal of Information Security and
Applications, 40, 247-
257. doi:10.1016/j.jisa.2017.11.001.
Schober, P., Boer, C., & Schwarte, L. A. (2018). Correlation
coefficients: Appropriate use and interpretation.
Anesthesia & Analgesia, 126(5), 1763–1768.
doi:10.1213/ANE.0000000000002864.
Schuessler, J. (2009). General deterrence theory: Assessing
information systems security effectiveness in large
versus small businesses. Ph.D. dissertation, University
of North Texas, United States. (Publication No. AAT
3377466).
Security, R. (2019, November 01). Pros & Cons of Bring
Your Own Device (BYOD). Retrieved from
https://blog.rsisecurity.com/pros-cons-of-bring-your-
own-device-byod/
Siponen, M., Mahmood, M. A., & Pahnila, S. (2014).
Employees’ adherence to information security policies:
An exploratory field study. Information &
Management, 51(2), 217–224.
doi:10.1016/j.im.2013.08.006.
SPSS (2020), IBM SPSS Statistics. Retrieved from
https://www.ibm.com/products/spss-statistics.
SurveyMonkey, (2019). SurveyMonkey Inc., Retrieved
from www.surveymonkey.com, San Mateo, CA:
SurveyMonkey Inc.
Tavakol, M., & Dennick, R. (2011). Making sense of
Cronbach’s alpha. International Journal of Medical
Education, 2, 53-55. doi:10.5116/ijme.4dfb.8dfd
Tech Pro Research (2014). BYOD booming with 74% using
or planning to use. Retrieved from
https://www.techrepublic.com/article/research-byod-
booming-with-74-using-or-planning-to-
use/#:~:text=Tech%20Pro%20Research%20conducted
%20a,what%20part%20they%20are%20playing.
Theoharidou, M., Kokolakis, S., Karyda, M., &
Kiountouzis, E. (2005). The insider threat to
information systems and the effectiveness of
ISO17799. Journal of Computer & Security, 24(6),
472-484. doi: 10.1016/j.cose.2005.05.002.
Turek, M. (2016). Employees say smartphones boost
productivity by 34 percent: Frost & Sullivan research.
Retrieved from
https://insights.samsung.com/2016/08/03/employees-
say-smartphones-boost-productivity-by-34-percent-
frost-sullivan-research/
Varbanov, R. (2014). Applications of the BYOD
conception: Benefits, risks, and approaches. Business
Management / Biznes Upravlenie, 24(2), 80–99.
Retrieved from http://hdl.handle.net/10610/1498
Waterfill, M. R., & Dilworth, C. A. (2014). BYOD: Where
the employee and the enterprise intersect. Employee
Relations Law Journal, 40(2), 26–36. Retrieved from
https://www.jdsupra.com/legalnews/expanded-byod-
where-the-employee-and-34259/
Xu, Z., & Hu, Q. (2018). The role of rational calculus in
controlling individual propensity toward information
security policy non-compliance behavior. Proceedings
of the 51st Hawaii International Conference on System
Sciences. Retrieved from
ICISSP 2021 - 7th International Conference on Information Systems Security and Privacy
64

https://aisel.aisnet.org/cgi/viewcontent.cgi?article=148
2&context=hicss-51
Zahadat, N. (2016). Mobile security: A systems engineering
framework for implementing bring your own device
(BYOD) security through the combination of policy
management and technology. (Doctoral dissertation).
Retrieved from ProQuest Dissertations and Theses
database. (Order No. 10024089)
Zahadat, N., Blessner, P., Blackburn, T., & Olson, B. A.
(2015). BYOD security engineering: A framework and
its analysis. Journal of Computer & Security. 55, 81–
99. doi:10.1016/j.cose.2015.06.011.
APPENDIX A
Survey Instrument
Items used a 5-point Likert scale: 1=strongly
disagree, 5=strongly agree (Knapp, Marshall, Rainer,
& Ford, 2005). Each item begins with the phrase, “In
the organization”.
Information Security Program Effectiveness
E1 The information security program achieves
most of its goals.
E2 The information security program
accomplishes its most important objectives.
E3 Generally speaking, information is sufficiently
protected.
E4 Overall, the information security program is
effective.
E5 The information security program has kept
risks to a minimum.
Policy Awareness
PA1 Employees clearly understand the
ramifications of violating security policies.
PA2 Necessary efforts are made to educate
employees about new security policies.
PA3 Information security awareness is
communicated well.
PA4 An effective security awareness program
exists.
PA5 A continuous, ongoing security awareness
program exists.
Policy Enforcement
PE1 Employees caught violating important security
policies are appropriately corrected.
PE2 Information security rules are enforced by
sanctioning the employees who break them.
PE3 Repeat security offenders are appropriately
disciplined.
PE4 Termination is a consideration for employees
who repeatedly break security rules.
Policy Maintenance
PM1 Information security policy is consistently
updated on a periodic basis.
PM2 Information security policy is updated when
technology changes require it.
PM3 An established information security policy
review and update process exists.
PM4 Security policy is properly updated on a
regular basis.
Predicting Security Program Effectiveness in Bring-Your-Own-Device Deployment in Organizations
65
