
IDEA: Index of Difficulty for Eye Tracking Applications - An Analysis
Model for Target Selection Tasks
Mohsen Parisay
1
, Charalambos Poullis
1
and Marta Kersten-Oertel
1,2
1
Department of Computer Science, Concordia University, Montreal, Canada
2
PERFORM Center, Montreal, Canada
Keywords:
Fitts’ Law, Eye Tracking, NASA TLX, Midas Touch.
Abstract:
Fitts’ law is a prediction model to measure the difficulty level of target selection for pointing devices. However,
emerging devices and interaction techniques require more flexible parameters to adopt the original Fitts’ law to
new circumstances and case scenarios. We propose Index of Difficulty for Eye tracking Applications (IDEA)
which integrates Fitts’ law with users’ feedback from the NASA TLX to measure the difficulty of target
selection. The COVID-19 pandemic has shown the necessity of contact-free interactions on public and shared
devices, thus in this work, we aim to propose a model for evaluating contact-free interaction techniques, which
can accurately measure the difficulty of eye tracking applications and can be adapted to children, users with
disabilities, and elderly without requiring the acquisition of physiological sensory data. We tested the IDEA
model using data from a three-part user study with 33 participants that compared two eye tracking selection
techniques, dwell-time, and a multi-modal eye tracking technique using voice commands.
1 INTRODUCTION
In this paper we introduce IDEA: Index of Difficulty
for Eye tracking Applications, an integrated predic-
tion model of task workload and performance of tar-
get selection tasks. The IDEA model combines the
effective contact-free target selection of eye tracking
with direct feedback of user’s experience obtained
from the NASA TLX scores. The IDEA model calcu-
lates a prediction index value based on objective tech-
nical specifications such as the target’s size and dis-
tance, and subjective measures from the NASA TLX
questionnaire obtained from user studies. To demon-
strate the efficacy of IDEA, we measured target se-
lection performance with data from three user studies
that compared two eye tracking interaction techniques
(dwell-time, and selection by voice commands) and
showed that our predictions correlate with throughput
and movement time of the Fitts’ prediction model.
1.1 Fitts’ Law
Paul Morris Fitts introduced a mathematical predic-
tion model to measure the difficulty level of target
selection in 1954 (Fitts, 1954). This model, which
has been extensively applied in user study interface
evaluations (Gori et al., 2017), correlates the required
movement time (MT) to activate a target with a spe-
cific size (W), at a certain distance (D). Fitts’ Law is
formulated as: MT = a + b . ID, and ID = log
2
(
2D
W
)
where ID denotes the index of difficulty, and a and b
are empirically defined constant values. In the field
of HCI, the Shannon formulation is most commonly
used to calculate the index of difficulty, ID = log
2
(1+
D
W
) as described in (MacKenzie, 1989). Fitts’ law
has been applied effectively in numerous user stud-
ies to analyse the performance of selecting specific
targets such as buttons (e.g. (Crossman and Goodeve,
1983), (Keele and Posner, 1968)). One of the earli-
est applications of Fitts’ law in HCI was to compare
four devices (mouse, joystick, step keys and text keys)
for text selection on a monitor (Card et al., 1978).
Researchers have also proposed variations to extend
the original Fitts’ law, for example MacKenzie et al.
(MacKenzie and Buxton, 1992) extended Fitts’ law
from a one-dimension to a 2D model for target acqui-
sition tasks to improve the accuracy of the index of
difficulty measure for interactive computer systems.
1.2 Cognitive Workload
Cognitive workload refers to the amount of men-
tal effort used to perform a task by a person. The
NASA Task Load Index (TLX) questionnaire is a
Parisay, M., Poullis, C. and Kersten-Oertel, M.
IDEA: Index of Difficulty for Eye Tracking Applications - An Analysis Model for Target Selection Tasks.
DOI: 10.5220/0010195701350144
In Proceedings of the 16th International Joint Conference on Computer Vision, Imaging and Computer Graphics Theory and Applications (VISIGRAPP 2021) - Volume 2: HUCAPP, pages
135-144
ISBN: 978-989-758-488-6
Copyright
c
2021 by SCITEPRESS – Science and Technology Publications, Lda. All rights reserved
135

well-known method to measure subjective workload
in user studies (Hart and Staveland, 1988) and has
been shown to be an effective tool to measure cog-
nitive workload (Ruiz-Rabelo et al., 2015). The ques-
tionnaire includes: physical demand, mental demand,
temporal demand, effort, performance, and frustra-
tion with the maximum range of 100 points (Group,
1986). Although there is physiological data (e.g. elec-
troencephalogram or EEG) which can be used to mea-
sure subjects’ workload, these methods although ac-
curate in detecting brain activity require specialized
and sometimes cumbersome equipment. In addition,
these techniques are intrusive for users and therefore
are restricted to controlled environments such as labo-
ratories (Zagermann et al., 2016). Thus in our model,
we focus on the NASA TLX.
1.3 Midas Touch Problem
Eye tracking, like many emerging technologies, has
its challenges. The Midas touch problem which refers
to unintended activation of functions by eye gaze to
select a target is one of the major challenges to be
considered when dealing with eye tracking applica-
tions. According to Jacob (1990), this problem oc-
curs since the eyes are used to look around an ob-
ject or to scan a scene, often without any intention
to activate a command or function. Thus, numer-
ous research has focused on solving the Midas touch
problem for gaze-based interactions (e.g. (Pi and Shi,
2017), (Velichkovsky et al., 2014), (Velloso et al.,
2016), and (Schenk et al., 2017)).
2 RELATED WORK
Both Fitts’ law and the NASA TLX are popular tools
for user studies. Felton et al. applied these tools
to study mental workload during brain-computer in-
teractions (Felton et al., 2012). Kim et al. applied
Fitts’ law in a driving safety simulation to analyze
the usability of touch-key sizes (Kim et al., 2014).
Hansen et al. made use of Fitts’ law to analyze the
performance of gaze and head tracking for point and
selection tasks when using head-mounted displays
(HMDs) (Hansen et al., 2018). In addition, Fitts’ law
was applied to reduce dwell-time for gaze-based se-
lection techniques by considering the estimated tar-
get acquisition time and the actual eye movement
time (Isomoto et al., 2018). Researchers have in-
vestigated the relation between eye blinks and mental
workload among surgeons (Zheng et al., 2012), find-
ing that shorter blink duration and frequency indicate
an increase of mental workload (Zheng et al., 2012).
Borghini et al. studied brain activity and heart rate of
car drivers and also found shorter blink rates correlate
with mental workload (Borghini et al., 2012). Lan-
thier et al. studied the correlation between fixations
and eye fatigue during visual search tasks and found
that fixation duration increases with fatigue (Lanthier
et al., 2013). Abdulin et al. showed that the distance
drift of fixation points in response to a stimuli can re-
veal physical eye fatigue (Abdulin and Komogortsev,
2015) and calculated this using the fixation qualita-
tive score (FQlS) (Komogortsev et al., 2010). Another
study looked at developing a metric based on fixation
points and the NASA TLX to determine the possibil-
ity of eye fatigue in gaze-based interactions (Parisay
et al., 2020). There are also approaches to measure
eye fatigue based on saccades, however, analysis of
saccades requires expensive eye trackers, and these
approaches are not applicable on budget-friendly de-
vices (Abdulin and Komogortsev, 2015), such as the
one used in our study.
Building on previous work, we propose a non-
invasive approach which can be applied on any remote
eye trackers without the need of raw data analysis of
the specific eye tracking sensors. We apply eye track-
ing for target selection from a safe distance and assess
the difficulty levels including subjects’ ratings inde-
pendent from device abilities or tracking techniques.
The primary purposes of IDEA are (1) to compare
different eye tracking applications, and (2) to enable
adaptation of eye tracking applications on different
user groups such as children, users with disabilities,
and the elderly. Furthermore, IDEA has the potential
to be applied for eye fatigue assessment, and stress
level measures based on target selection tasks. To the
best of our knowledge, there are no models that in-
tegrate the index of difficulty of the Fitts’ law (ID)
and the NASA TLX scores for eye tracking applica-
tions without the need of technical parameters such as
blink rates, fixation duration time, average number of
fixations, and saccade duration.
3 INDEX OF DIFFICULTY (IDEA)
Users’ perceived rating is one of the most valuable
sources of data in any user study and the NASA TLX
questionnaire is a valid tool for this purpose. On the
other hand, Fitts’ law can reflect the difficulty and
performance of target selection tasks based on test
specifications. Therefore, we integrated users’ feed-
back into the Fitts’ law model to result in a combined
value reflecting both technical and experimental as-
pects of target selection tasks for eye tracking appli-
cations. In addition, the entire workload of a task
HUCAPP 2021 - 5th International Conference on Human Computer Interaction Theory and Applications
136

(subjective rating) can be modulated by a selection
ratio parameter (selection distance divided by screen
diameter) which is determined based on test condi-
tions, users’ ability to select targets, and interaction
techniques. The purpose of modulating the techni-
cal factor with the experimental factor is to combine
the importance of both into a single index value. In
other words, the multiplication combines both, tech-
nical aspects which are bound to case scenarios, with
subjective understanding of the actual functions. This
results in a single value for comparison. Thus, the
IDEA analysis model is a novel simple-to-calculate
compound model for eye tracking techniques based
on the Fitts’ law (Fitts, 1954) and the NASA TLX
questionnaire (Group, 1986) to measure the difficulty
of target selection tasks. IDEA is device-independent
and can be applied on any eye tracker, and depends
on the following parameters:
• All scores from the NASA TLX questionnaire:
physical demand (PD), mental demand (MD), tem-
poral demand (TD), effort (E), performance (P),
and frustration (F).
• Diameter of screen (D): represents the longest dis-
tance on screen D =
p
x
2
+ y
2
where x and y repre-
sent screen width and height.
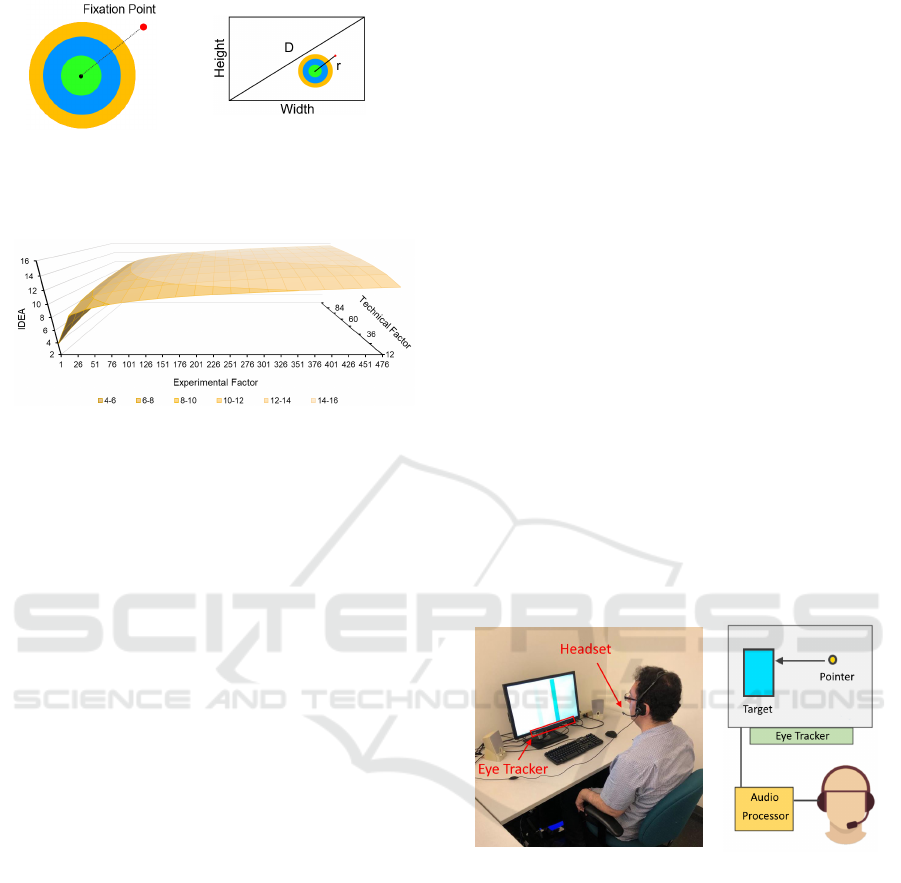
• Selection ratio (S): represents the difficulty of tar-
get selection (distance to target) in regards to the
screen diameter (see Figure 1).
• DISTANCES: the set of target distances from each
other.
• WIDTHS: the set of target sizes (widths).
The conditions and range of each of the parameters
are given by:
1. ∀ a ∈ {PD,MD,TD,E, P,F} : a ∈ Z ∧1 ≤ a ≤ 100
All NASA TLX scores are integers in the range of
1 to 100.
2. D ∈ Z ∧ D > 0
Diameter of screen is an integer value greater than
0 in pixels.
3. r ∈ R ∧ 0 ≤ r ≤ D
The distance to target (r) is a real number between
0 and screen diameter in pixels (see Figure 1a).
4. S =
r+1
D
∧ S ∈ R ∧ S > 0
Selection ratio (S) is the ratio of distance to target
(r) over diameter of the screen (D). The constant
value of 1 added to the equation to avoid the 0 case
for distance to target (see Figure 1b).
5. DISTANCES = {d | d ∈ R ∧ d > 0}
DISTANCES is the set of real numbers containing
distances of targets from each other greater than 0.
6. W IDT HS = {w | w ∈ R ∧ w > 0}
WIDTHS is the set of real numbers containing
widths (sizes) of targets greater than 0.
7. m =
|
W IDT HS
|
∧ m ≥ 1
m is the count of members in the W IDT HS set
greater than or equal to 1.
8. n =
|
DISTANCES
|
∧ n ≥ 1
n is the count of members in the DISTANCES set
greater than or equal to 1.
9. Technical Factor ∈ R ∧ Technical Factor > 0
The technical factor (Equation 1) is the sum of all
distances (d ∈ DISTANCES) doubled and divided
by the width values (w ∈ W IDT HS) derived from
the Fitts’ law (Fitts, 1954). This results in a real
number greater than 0 which resembles the index
of difficulty of the Fitts’ law ID = log
2
2D
W
. The
technical factor represents the precondition of tar-
get properties (distances and widths).
Technical Factor =
n
∑
i=1
m
∑
j=1
2d
i
w
j
(1)
10. R ∈ R ∧ 1 ≤ R ≤ 100
The subjective rating (R) is the mean of all TLX
scores which is a real number between 1 and 100
shown in Equation 2.
R =
PD + MD + T D + E + P + F
6
(2)
11. Experimental Factor ∈ R ∧
Experimental Factor > 1
The experimental factor (Equation 3) is defined
as the product of the calculated selection ratio (S)
depicted in Figure 1, and the subjective rating (R)
which results in a real number greater than 1.
Experimental Factor = S × R (3)
12. IDEA ∈ R ∧ IDEA > 1
The proposed index of difficulty for eye tracking
applications (IDEA) is calculated by multiplying
(a) the technical factor, and (b) the experimental
factor offset by a constant value of 2 which results
in a real number greater than 1 (Equation 4). We
offset both technical and experimental factors by
the constant value of 2 in case these factors are
close to zero, therefore the calculated IDEA value
starts from 1.x. Figure 2 shows the 3D visualiza-
tion of IDEA and its factors.
IDEA = log
2
(
n
∑
i=1
m
∑
j=1
2d
i
w
j
)
| {z }
Tec. Fac.
× S × R
|{z}
Exp. Fac.
+2
(4)
IDEA: Index of Difficulty for Eye Tracking Applications - An Analysis Model for Target Selection Tasks
137
(a)
(b)
Figure 1: (a) overview of the dart-test to measure Euclidean
distance, and (b) the concept of selection ratio regarding
diameter of screen (D) and the selection distance (r).
Figure 2: 3D illustration of the IDEA model.
4 METHODOLOGY
We conducted a three-part repeated measures user
study to evaluate the efficacy of our proposed model
with 33 participants (20 male, from 22 to 35 years
old, mean = 26.06). Subjects were asked to navigate
and select highlighted targets (see Figure 4) under
two gaze-based interaction techniques: (1) dwell-time
with 500 ms threshold, and (2) eye tracking using
voice commands. Prior to running the experiments,
participants were informed about the objectives of the
user study, trained on each of the interaction tech-
niques, and filled out a pre-test questionnaire. Before
running the tests, the built-in eye tracking software
was used to calibrate eye positions for each partic-
ipant. The order of interaction techniques was ran-
domly selected for each participant. Overall, the user
studies took 8 minutes on average for a participant to
finish. At the end of the two experiments measuring
the Fitts’ law parameters (Figure 4) participants were
asked to fill out a post-test questionnaire consisting of
the NASA TLX questionnaire.
4.1 Interaction Techniques
We applied two eye tracking techniques (single and
multi-modal interactions) to evaluate the efficacy of
our proposed model. We ran the mentioned interac-
tion techniques on an Intel i7 PC with the 64-bit Win-
dows operating system. Figure 3 illustrates the test
setting and overview of the interaction techniques.
4.1.1 Dwell-time
The dwell-time method can select a target only by eye
gaze fixations after a predefined threshold is reached.
We defined the target selection threshold to 500 mil-
liseconds which is in the typically accepted range of
300-1100 milliseconds (
ˇ
Spakov and Miniotas, 2004),
and has been shown to be the best-suited threshold for
the dwell-time method (MacKenzie, 2012), (
ˇ
Spakov
and Miniotas, 2004). In other words, when a subject
focuses for 0.5 seconds on a target it gets selected, and
any gaze movement from the target boundaries prior
to that threshold causes the restart of target selection
process.
4.1.2 Eye Tracking with Voice Recognition
The voice recognition method operates in two phases,
(1) pointing phase using the eye tracker, and (2) se-
lection phase using voice commands. Figure 3b il-
lustrates the overview of these phases. The process
of voice recognition was developed using the built-in
Windows 10 speech recognition functionalities pro-
vided in the Microsoft .NET framework. We de-
veloped a C# application to capture user’s activation
command ’select’ to activate a left mouse click.
(a)
(b)
Figure 3: (a) test setting and equipment, and (b) system
overview and workflow of both interaction techniques.
4.2 Interaction Modules
Eye Tracking: We used the Tobii 4C eye tracker to
capture the mouse pointer position to enable users to
interact with the system with their gaze. Moreover,
we employed the Tobii SDK to obtain users’ gaze
locations (2D coordinates) on the screen and syn-
chronize the mouse pointer to these coordinates in
pixel. The eye tracking module for both interaction
techniques was developed in C++ and integrated into
the Tobii SDK as a new plug-in. The samples were
recorded at a distance of 60 cm (24 in) from the eye
tracker with a sampling rate of 90 Hz on a 24 inch
HUCAPP 2021 - 5th International Conference on Human Computer Interaction Theory and Applications
138

screen with the resolution of 1920 × 1080 pixels.
The dwell-time technique relies solely on the eye
tracking module.
Voice Processing: We used a headset microphone
(Logitech H370) to capture the user’s voice com-
mands in the presence of an artificial ambient noise
around 50 dB played by stereo speakers (Figure 3a)
to simulate a typical working office. The voice recog-
nition module received the commands in real-time to
be activated by the keyword ’select’ to trigger a left
mouse click.
4.3 Hypotheses
Based on the previous literature, which has demon-
strated the effectiveness of Fitts’ law (Crossman and
Goodeve, 1983), (Keele and Posner, 1968), (Card
et al., 1978), and (MacKenzie and Buxton, 1992) and
the NASA TLX questionnaire (Hart and Staveland,
1988), (Hart, 2006), and (Ruiz-Rabelo et al., 2015),
we propose a compound simple-to-calculate mathe-
matical model to measure the difficulty level of eye
tracking applications independent from device type
and technical capabilities during user studies. This
model enables analysis of eye tracking applications
based on user groups and their abilities to interact
with an eye tracking device or interaction technique.
Specifically, we hypothesize that:
1. When IDEA is higher on average for an interaction
technique, the calculated throughput based on the
Fitts’ law will be lower, and vice versa.
2. When IDEA is higher on average for an interaction
technique, the calculated movement time based on
the Fitts’ law will be higher as well, and vice versa.
3. When IDEA is higher on average for an interaction
technique, the registered error rates will be higher
as well, and vice versa.
4.4 User Study
The user study described above was used to analyze
the mentioned eye tracking interaction techniques
to evaluate the proposed IDEA model, according to
well-established academic standards. We measured
four parameters in our 3 part study: (1) distance to
target, (2) throughput, (3) movement time, and (4) er-
ror rates. We developed a dart-like application (Figure
1a) to measure distance to target and used the applica-
tion developed by Wobbrock et al. (Wobbrock et al.,
2011) called the FittsStudy version 4.2.7 which in-
cludes two widths (96, 128), and three distances (256,
384, 512) pixels to record the rest of the measures.
4.4.1 Dart Test
The stimulus consisted of three circles, green from 0
to 30 pixels, blue from 30 to 60 pixels, and red from
60 to 90 pixels in radius as illustrated in Figure 1a.
Any selection outside of the dart colored circles is
recorded as the fixed maximum range of 90 pixels for
that selection. The purpose of this experiment was
to measure the Euclidean distance to target to be ap-
plied in Equation 3 by calculating the fraction of dis-
tance (r) over diameter of screen (D) as shown earlier
(S =
r+1
D
). Subjects were asked to select, as accurately
as possible, the center of a dart target using both in-
teraction methods. Since eye tracking has different
accuracy in different regions of a screen (Feit et al.,
2017), we calculated an average of five trials for each
interaction techniques where the stimulus moved to
different areas around the center of screen randomly.
Each random trial started in two second intervals en-
abling subjects to change their gaze before recording
the distance measures. A countdown timer with inter-
vals of 100 ms was displayed from 5 to 0 to show the
remaining time to subjects.
4.4.2 Ribbon-shaped Test
The stimulus contains two vertical bars to be selected
(clicked), each at a time shown in Figure 4a. The vari-
ation of distances and widths are chosen randomly by
the FittsStudy (Wobbrock et al., 2011) application and
the order of each interaction method for each partici-
pant were also chosen randomly.
4.4.3 Circle-shaped Test
This test is the same as the ribbon-shaped test with
circular-shaped targets illustrated in Figure 4b. This
experiment measures two variations for throughput,
(1) uni-variate endpoint deviation (SD
x
) through one
axis, and (2) bi-variate endpoint deviation (SD
x,y
)
through both axes which results in a better Fitts’ law
model (Wobbrock et al., 2011). The stimulus con-
tains equally-sized circles with different distances and
widths to be selected (clicked), each at a time shown
in Figure 4b. The variation of distances and widths
are chosen randomly by the FittsStudy (Wobbrock
et al., 2011) application and the order of each inter-
action method for each participant was also chosen
randomly.
4.4.4 Workflow and Parameters
The user study was conducted on a screen with the
resolution of 1920 × 1080 pixels which results in a
diameter (D) of 2203 pixels (rounded up). Distances
IDEA: Index of Difficulty for Eye Tracking Applications - An Analysis Model for Target Selection Tasks
139

(a)
(b)
Figure 4: The FittsStudy application (Wobbrock et al.,
2011). (a) Ribbon-shaped, and (b) Circle-shaped targets.
of 256, 384, and 512 pixels between targets were used
with a target width of 96 and 128 pixels. The dis-
tance to target (r) for both interaction techniques was
measured by the dart test application (Figure 1) based
on the Euclidean distance in pixels. Lastly, the se-
lection ratio was calculated by measured distance to
target over the screen diameter (S =
r+1
D
). The con-
stant value of 1 is added to the measured distance for
selecting the target exactly in the middle which results
in a distance to target of 0.
5 RESULTS
The results of our experiments were analyzed using
paired-sample t-tests with the JASP
1
software. Figure
5b shows the NASA TLX scores and the calculated
average workload based on Equation 2 for both inter-
action techniques from the post-test questionnaire.
As per Equation 1, the technical factor, which is
42, was the same for both interaction techniques as
it depends on distances and widths which were con-
stant in our user study. This is the case in our ex-
periments as both interaction techniques were evalu-
ated on the same device with the same screen resolu-
tion and the same target distances and widths. How-
ever, the technical factor can be different for varying
case scenarios. A paired-sample t-test was applied
to check the effectiveness of the interaction technique
on the experimental factor based on Equation 3 with
(t(32)=2.86, p < .05). A significant difference was
found between dwell-time (M = 0.48, SE = 0.06) and
voice recognition (M = 0.65,SE = 0.06). Specifi-
cally, dwell-time had a lower experimental factor than
the voice recognition technique. This suggests that
the multiplication of users’ selection ratio on screen
(S) and their rating scores (R) is significantly lower
for the dwell-time method than the voice recognition
technique.
A paired-sample t-test was applied to check the
effectiveness of interaction technique on the index
of difficulty based on the Equation 4 shown in
Figure 5a and Table 1. A significant difference
(t(32)=3.19, p < .05) was found between dwell-time
(M = 4.17,SE = 0.15) and voice recognition (M =
1
https://jasp-stats.org/
4.66,SE = 0.15). This suggests that the dwell-time
method has a significantly lower IDEA value than the
voice recognition technique. Dwell-time can thus be
considered an easier eye tracking technique for our
subjects comparing to the voice recognition.
Table 1: Summary of IDEA calculations.
Dwell-Time Voice Recog.
Distance 35.30 29.27
Selection ratio 0.016 0.014
Tech. factor 42 42
Exp. factor 0.48 0.65
IDEA 4.17 4.66
Dart Test: Paired-sample t-tests were performed to
study the effect of interaction type on (1) distance to
target, and (2) selection ratio. A significant differ-
ence (t(32)=2.88, p < .05) was found between dwell-
time (M = 35.30 pixels,SE = 2.11 pixels) and voice
recognition (M = 29.27 pixels, SE = 2.07 pixels)
on distance to target (r) depicted in Figure 6a. This
shows that the voice recognition technique has a
higher target selection accuracy (lower distance to
target) than the dwell-time method. This is likely
the case because this method splits the pointing (eye
tracking) and selecting (voice command) into differ-
ent modalities.
A paired-sample t-test was also applied to check
the effectiveness of interaction technique on selection
ratio (S) depicted in Figure 6b. A significant differ-
ence (t(32)=2.88, p < .05) was found between dwell-
time (M = 0.016 pixels, SE = 9.620e − 4 pixels) and
voice recognition (M = 0.014 pixels,SE = 9.409e −
4 pixels). This means that users are more accurate
to select targets using the voice recognition technique
than the dwell-time.
Ribbon-shaped Test: Paired-sample t-tests were per-
formed to study the effect of interaction type on
(1) throughput, (2) movement time, and (3) error
rate. There was a significant difference (t(32)=5.96,
p < .001) of throughput for dwell-time (M = 3.30
bits/sec,SE = 0.36 bits/sec) and voice recognition
(M = 1.16 bits/sec, SE = 0.09 bits/sec) as seen in
Figure 6c. This confirms our hypothesis that a lower
IDEA value for an interaction technique reflects a
higher throughput.
A paired-sample t-test was applied to check the
effectiveness of interaction technique on movement
time depicted in Figure 6d. A significant difference
(t(32)=15.13, p < .001) was found between dwell-
time (M = 0.60 sec, SE = 0.01 sec) and voice recog-
nition (M = 2.01 sec, SE = 0.08 sec). This confirms
our hypothesis that a lower IDEA value for an inter-
action technique reflects a lower movement time.
A paired-sample t-test was applied to check the
HUCAPP 2021 - 5th International Conference on Human Computer Interaction Theory and Applications
140

effectiveness of interaction technique on error rate
depicted in Figure 6e. A significant difference
(t(32)=4.84, p < .001) was found between dwell-time
(M = 0.28 errors,SE = 0.03 errors) and voice recog-
nition (M = 0.11 errors,SE = 0.02 errors). This re-
jects our hypothesis that an interaction technique with
a lower IDEA value should cause lower error rate.
The cause of errors in eye tracking applications as ex-
plained above are mostly due to the Midas touch prob-
lem (Jacob, 1990). Thus as the dwell-time method re-
lies on eye tracking solely, and selection is done based
on fixation time there were higher error rates in this
method than in the multi-modal voice method where
selection is done based on a voice command.
Circle-shaped Test: Paired-sample t-tests were per-
formed to study the effect of interaction type on (1)
throughput with two variations, (2) movement time,
and (3) error rate. For univariate throughput (il-
lustrated in Figure 7a) there was a significant dif-
ference (t(32)=7.98, p < .001) between dwell-time
(M = 3.91 bits/sec,SE = 0.31 bits/sec) and voice
recognition (M = 1.48 bits/sec,SE = 0.09 bits/sec).
This confirms our hypothesis that an interaction tech-
nique with a lower IDEA value should reach higher
throughput.
A paired-sample t-test was applied to check the
effectiveness of interaction technique on bivariate
throughput illustrated in Figure 7b. A significant dif-
ference (t(32)=7.19, p < .001) was found between
dwell-time (M = 2.51 bits/sec, SE = 0.22 bits/sec)
and voice recognition (M = 1.01 bits/sec,SE =
0.06 bits/sec). This confirms our hypothesis that an
interaction technique with a lower IDEA value should
reach higher throughput.
A paired-sample t-test was applied to check the
effectiveness of interaction technique on movement
time illustrated in Figure 7c. A significant difference
(t(32)=11.31, p < .001) was found between dwell-
time (M = 0.64 sec, SE = 0.02 sec) and voice recog-
nition (M = 2.12 sec,SE = 0.13 sec). This confirms
our hypothesis that an interaction technique with a
lower IDEA value should reach a lower movement
time.
A paired-sample t-test was applied to check the
effectiveness of interaction technique on error rate
illustrated in Figure 7d. A significant difference
(t(32)=2.26, p < .05) was found between dwell-time
(M = 0.23 errors, SE = 0.03 errors) and voice recog-
nition (M = 0.13 errors, SE = 0.02 errors). This re-
jects our hypothesis that an interaction technique with
a lower IDEA value should have a lower error rate. As
described above, the cause of errors in eye tracking
applications are mostly due to the Midas touch prob-
lem and thus the single mode method which requires
gaze for both pointer movement and selection is more
error prone.
6 DISCUSSION
The results reflect the efficacy of our two-factor
model to measure the performance of eye tracking ap-
plications independently of device type. We showed
that our model can predict the difficulty of eye track-
ing applications solely based on Fitts’ law and the
NASA TLX scores. Further, we showed our model
correlates with the standard measures (throughput and
movement time) described by Fitts’ law. The global
pandemic of COVID-19 showed the importance of
computer interactions from a safe distance without
physical contact. Eye tracking applications, specifi-
cally the dwell-time method, are suitable candidates
to enable safe interactions on shared and public de-
vices for selection tasks. Therefore, our proposed
model can be applied in pilot studies to measure the
usability and performance of selection techniques to
address different user groups such as children, users
with disabilities, or elderly based on the experimen-
tal factor which reflects (a) subjective ratings (NASA
TLX scores), and (b) perceived difficulty levels of
interaction techniques or user groups. Although we
only studied voice recognition as a multi-modal inter-
action technique, the results of the user studies con-
firm our first and second hypotheses regarding the
correlation between throughput and movement time
calculated by the Fitts’ law and the predictions by our
proposed model. However, eye tracking applications
suffer from the Midas touch problem, and since the
dwell-time method relies on eye gaze only, it reached
higher error rates than the multi-modal selection tech-
nique using voice recognition with separate modali-
ties for point and selection. The analysis of our re-
sults emphasizes the potential of our two-factor pre-
diction model on two similar eye tracking interaction
techniques. We hope, this experiment leads to more
innovations of multi-dimensional compound models
for gaze-based interactions.
7 CONCLUSION AND FUTURE
WORK
In this paper we proposed the Index of Difficulty for
Eye tracking Applications (IDEA) a compound two-
factor model to measure the performance and usabil-
ity of selection techniques based on calculations of
Fitts’ law and the results of a NASA TLX question-
IDEA: Index of Difficulty for Eye Tracking Applications - An Analysis Model for Target Selection Tasks
141
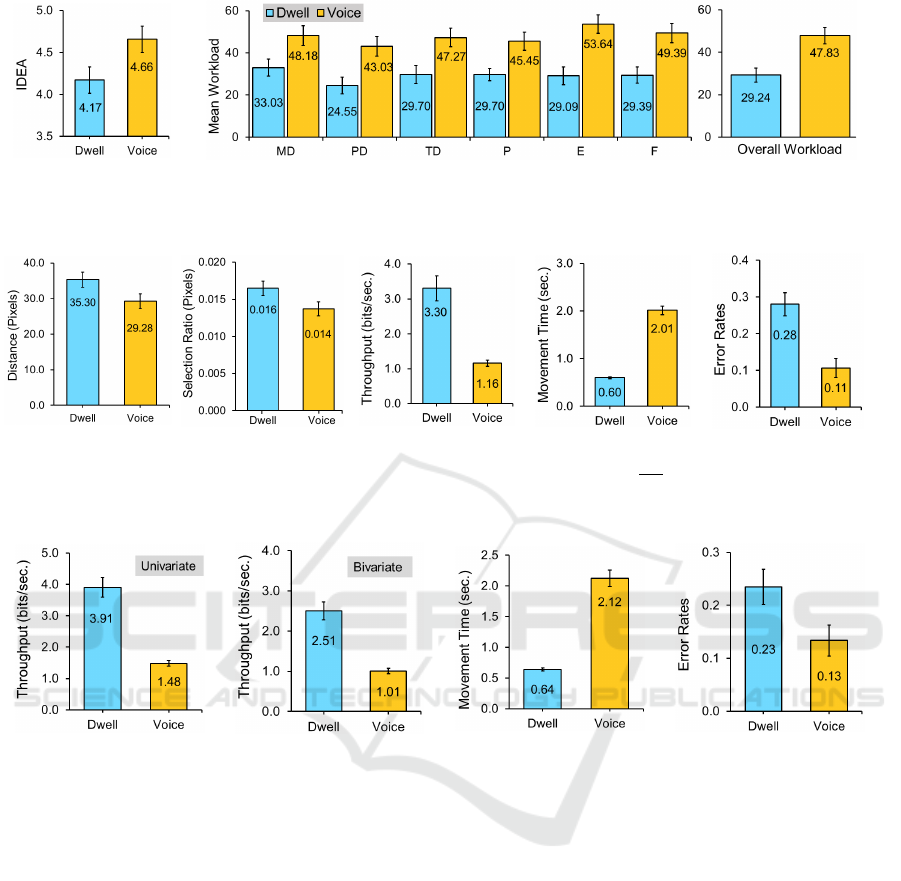
(a)
(b)
Figure 5: (a) shows index of difficulty for eye tracking applications (IDEA) based on Equation 4 for both interaction techniques
(p < .05), and (b) illustrates the results of the NASA TLX scores. Error bars represent SE.
(a)
(b)
(c)
(d)
(e)
Figure 6: (a) Euclidean distance to target measure (r). (b) Calculated selection ratio (S =
r+1
D
) for both interaction techniques.
(c) Throughput (TP), (d) Movement time (MT), and (e) Error rates (ER) for both interaction techniques of the ribbon-shaped
test. Error bars represent SE. (p < .05 on (a) and (b) measures, p < .001 on (c), (d), and (e) measures).
(a)
(b)
(c)
(d)
Figure 7: Calculated measures of the circle-shaped test. (a) Univariate throughput (TP) (p < .001), (b) Bivariate TP (p < .001),
(c) Movement time (MT) (p < .001), and (d) Error rates for both interaction techniques (p < .05). Error bars represent SE.
naire. As emerging interaction techniques are re-
quired to cope with emerging users’ demands, the
need for more complex models to compare different
techniques requires more attention. We present our
model to asses the efficacy of eye tracking applica-
tions for pilot studies with different user groups such
as children, users with disabilities, or elderly. Our
configurable model can be applied for case scenar-
ios as well as to discriminate specific interaction tech-
niques. In addition, we presented an in-depth analysis
of the dwell-time method based on the Fitts’ law mea-
sures. Although our model was developed to address
eye tracking interactions, it can be applied on any se-
lection technique to measure difficulty levels based on
test specifications (target size and distance) and users’
subjective ratings. Further, we showed eye tracking
techniques can be compared without analysis of tech-
nical raw data such as fixation duration time and blink
rates. These enable researchers to run pilot studies in-
dependently from device type. We predict the transi-
tion from conventional interaction techniques, such as
keyboard and mouse, to contact-free techniques from
a safe distance caused by the latest global outbreak of
viral infections, especially for equipment in health-
care sectors, and shared public devices. IDEA en-
ables researchers to run user studies based on video
eye tracking techniques via remote webcams to com-
ply with restrictions caused by viral diseases which
limit the physical presence of participants in labora-
tories or attaching sensory equipment to record users’
feedback. We plan on applying our proposed model
on AR and VR headsets with internal eye trackers to
study usability of target selection in our future work.
HUCAPP 2021 - 5th International Conference on Human Computer Interaction Theory and Applications
142

ACKNOWLEDGEMENT
This work was supported by the Natural Sciences and
Engineering Research Council of Canada Grants DG-
N01670 and DG-N06722.
REFERENCES
Abdulin, E. and Komogortsev, O. (2015). User eye fatigue
detection via eye movement behavior. In Proceed-
ings of the 33rd annual ACM conference extended ab-
stracts on human factors in computing systems, pages
1265–1270. ACM.
Borghini, G., Vecchiato, G., Toppi, J., Astolfi, L., Maglione,
A., Isabella, R., Caltagirone, C., Kong, W., Wei, D.,
Zhou, Z., et al. (2012). Assessment of mental fa-
tigue during car driving by using high resolution eeg
activity and neurophysiologic indices. In 2012 An-
nual International Conference of the IEEE Engineer-
ing in Medicine and Biology Society, pages 6442–
6445. IEEE.
Card, S. K., English, W. K., and Burr, B. J. (1978). Evalua-
tion of mouse, rate-controlled isometric joystick, step
keys, and text keys for text selection on a crt. Er-
gonomics, 21(8):601–613.
Crossman, E. and Goodeve, P. (1983). Feedback control
of hand-movement and fitts’ law. The Quarterly Jour-
nal of Experimental Psychology Section A, 35(2):251–
278.
Feit, A. M., Williams, S., Toledo, A., Paradiso, A., Kulka-
rni, H., Kane, S., and Morris, M. R. (2017). Toward
everyday gaze input: Accuracy and precision of eye
tracking and implications for design. In Proceedings
of the 2017 Chi conference on human factors in com-
puting systems, pages 1118–1130. ACM.
Felton, E. A., Williams, J. C., Vanderheiden, G. C., and
Radwin, R. G. (2012). Mental workload during brain–
computer interface training. Ergonomics, 55(5):526–
537.
Fitts, P. M. (1954). The information capacity of the human
motor system in controlling the amplitude of move-
ment. Journal of experimental psychology, 47(6):381.
Gori, J., Rioul, O., Guiard, Y., and Beaudouin-Lafon, M.
(2017). One fitts’ law, two metrics. In IFIP Con-
ference on Human-Computer Interaction, pages 525–
533. Springer.
Group, N. H. P. R. (1986). Nasa task load index (tlx) paper
and pencil package.
Hansen, J. P., Rajanna, V., MacKenzie, I. S., and Bækgaard,
P. (2018). A fitts’ law study of click and dwell inter-
action by gaze, head and mouse with a head-mounted
display. In Proceedings of the Workshop on Commu-
nication by Gaze Interaction, pages 1–5.
Hart, S. G. (2006). Nasa-task load index (nasa-tlx); 20 years
later. In Proceedings of the human factors and er-
gonomics society annual meeting, volume 50, pages
904–908. Sage publications Sage CA: Los Angeles,
CA.
Hart, S. G. and Staveland, L. E. (1988). Development of
nasa-tlx (task load index): Results of empirical and
theoretical research. In Advances in psychology, vol-
ume 52, pages 139–183. Elsevier.
Isomoto, T., Ando, T., Shizuki, B., and Takahashi, S.
(2018). Dwell time reduction technique using fitts’
law for gaze-based target acquisition. In Proceed-
ings of the 2018 ACM Symposium on Eye Tracking
Research & Applications, pages 1–7.
Jacob, R. J. K. (1990). What you look at is what you get:
Eye movement-based interaction techniques. In Pro-
ceedings of the SIGCHI Conference on Human Fac-
tors in Computing Systems, CHI ’90, pages 11–18,
New York, NY, USA. ACM.
Keele, S. W. and Posner, M. I. (1968). Processing of visual
feedback in rapid movements. Journal of experimen-
tal psychology, 77(1):155.
Kim, H., Kwon, S., Heo, J., Lee, H., and Chung, M. K.
(2014). The effect of touch-key size on the us-
ability of in-vehicle information systems and driving
safety during simulated driving. Applied ergonomics,
45(3):379–388.
Komogortsev, O. V., Gobert, D. V., Jayarathna, S., Koh,
D. H., and Gowda, S. M. (2010). Standardization of
automated analyses of oculomotor fixation and sac-
cadic behaviors. IEEE Transactions on Biomedical
Engineering, 57(11):2635–2645.
Lanthier, S., Risko, E., Smilek, D., and Kingstone, A.
(2013). Measuring the separate effects of practice and
fatigue on eye movements during visual search. In
Proceedings of the Annual Meeting of the Cognitive
Science Society, volume 35.
MacKenzie, I. S. (1989). A note on the information-
theoretic basis for fitts’ law. Journal of motor behav-
ior, 21(3):323–330.
MacKenzie, I. S. (2012). Evaluating eye tracking systems
for computer input. In Gaze interaction and applica-
tions of eye tracking: Advances in assistive technolo-
gies, pages 205–225. IGI Global.
MacKenzie, I. S. and Buxton, W. (1992). Extending fitts’
law to two-dimensional tasks. In Proceedings of the
SIGCHI conference on Human factors in computing
systems, pages 219–226.
Parisay, M., Poullis, C., and Kersten-Oertel, M. (2020). Fe-
lix: Fixation-based eye fatigue load index a multi-
factor measure for gaze-based interactions. In 2020
13th International Conference on Human System In-
teraction (HSI), pages 74–81.
Pi, J. and Shi, B. E. (2017). Probabilistic adjustment
of dwell time for eye typing. In 2017 10th Inter-
national Conference on Human System Interactions
(HSI), pages 251–257. IEEE.
Ruiz-Rabelo, J. F., Navarro-Rodriguez, E., Di-Stasi, L. L.,
Diaz-Jimenez, N., Cabrera-Bermon, J., Diaz-Iglesias,
C., Gomez-Alvarez, M., and Brice
˜
no-Delgado, J.
(2015). Validation of the nasa-tlx score in ongoing
assessment of mental workload during a laparoscopic
learning curve in bariatric surgery. Obesity surgery,
25(12):2451–2456.
IDEA: Index of Difficulty for Eye Tracking Applications - An Analysis Model for Target Selection Tasks
143

Schenk, S., Dreiser, M., Rigoll, G., and Dorr, M. (2017).
Gazeeverywhere: enabling gaze-only user interaction
on an unmodified desktop pc in everyday scenarios. In
Proceedings of the 2017 CHI Conference on Human
Factors in Computing Systems, pages 3034–3044.
ˇ
Spakov, O. and Miniotas, D. (2004). On-line adjustment of
dwell time for target selection by gaze. In Proceedings
of the third Nordic conference on Human-computer
interaction, pages 203–206. ACM.
Velichkovsky, B. B., Rumyantsev, M. A., and Morozov,
M. A. (2014). New solution to the midas touch prob-
lem: Identification of visual commands via extraction
of focal fixations. Procedia Computer Science, 39:75–
82.
Velloso, E., Wirth, M., Weichel, C., Esteves, A., and
Gellersen, H. (2016). Ambigaze: Direct control of
ambient devices by gaze. In Proceedings of the 2016
ACM Conference on Designing Interactive Systems,
DIS ’16, pages 812–817, New York, NY, USA. ACM.
Wobbrock, J. O., Shinohara, K., and Jansen, A. (2011).
The effects of task dimensionality, endpoint devia-
tion, throughput calculation, and experiment design
on pointing measures and models. In Proceedings of
the SIGCHI Conference on Human Factors in Com-
puting Systems, pages 1639–1648. ACM.
Zagermann, J., Pfeil, U., and Reiterer, H. (2016). Measur-
ing cognitive load using eye tracking technology in
visual computing. In Proceedings of the Sixth Work-
shop on Beyond Time and Errors on Novel Evaluation
Methods for Visualization, BELIV ’16, pages 78–85,
New York, NY, USA. ACM.
Zheng, B., Jiang, X., Tien, G., Meneghetti, A., Panton, O.
N. M., and Atkins, M. S. (2012). Workload assess-
ment of surgeons: correlation between nasa tlx and
blinks. Surgical endoscopy, 26(10):2746–2750.
HUCAPP 2021 - 5th International Conference on Human Computer Interaction Theory and Applications
144
