
SIMDGiraffe: Visualizing SIMD Functions
P. M. Ntang
a
and D. Lemire
b
Universit
´
e du Qu
´
ebec (T
´
ELUQ), Montreal, Qu
´
ebec, Canada
Keywords:
Software Visualization, SIMD Instructions, Vectorization.
Abstract:
Many common processors offer advanced parallel-processing features to accelerate computations. In particular,
most commodity processors support Single Instruction on Multiple Data (SIMD) instructions. Algorithms
designed to benefit from these instructions can be several times faster than conventional algorithms. However,
they can be difficult to understand, and therefore to review. We build SIMDGiraffe, a tool that can help visualize
SIMD code written using the popular Intel intrinsics in C.
1 INTRODUCTION
The physical architectures available on the current
commodity processors offer a lot of performance pos-
sibilities, including parallelism. In particular, these
processors support vectorization via Single Instruction
on Multiple Data (SIMD) instructions. These instruc-
tions can perform the same operation on several values
at once, within the same instruction: e.g., a single
SIMD instruction compute
(a
0
,...,a
15
) + (b
0
,...,b
15
) = (a
0
+ b
0
,...,a
15
+ b
15
)
(1)
C and C++ programmers can use the popular Intel
intrinsics to benefit from the SIMD instruction sets
available on x64 processors (e.g., AVX-512) (Intel,
2018). To fully leverage these SIMD instructions, the
code must be designed and written in a vectorial man-
ner (Pohl et al., 2016; Kretz and Lindenstruth, 2012;
Maleki et al., 2011). However for many programmers,
it is difficult to read and understand even short samples
written using SIMD intrinsics. These difficulties may
intimidate and discourage programmers from using
these functions, despite their performance. Code vi-
sualization may help to better understand programs
and algorithmsn (Myers, 1990). But while the tools
for visualizing parallel codes have been widely dis-
cussed (Stringhini and Fazenda, 2015; Papenhausen
et al., 2016; Li et al., 2017), the visualization of vec-
torial codes has not been the subject of much of in-
terest. To our knowledge, no work has focused on
the visualization of vectorial codes specifically even
though vectorization has been the subject of attention
a
https://orcid.org/0000-0002-4400-6469
b
https://orcid.org/0000-0003-3306-6922
on many other aspects (Muła and Lemire, 2018; Tri-
funovic et al., 2009; Nuzman et al., 2011; Lemire
et al., 2018). Thus some authors confronted with this
problem produce manually figures to explain the code
execution (Muła and Lemire, 2018). Such a particular
manual representation can be helpful in understand-
ing a particular code. But it obviously allows only
visualizing this particular code.
To address these issues we built a tool—
SIMDGiraffe—that generates automatically figures
from machine code to help understand the underlying
algorithms. SIMDGiraffe is an open source tool to
analyze and visualize SIMD code written using the
popular SIMD instructions sets onx64 processors. Our
main contributions are:
•
A description of the behavior of a vector code that
runs on a target vector architecture by a model that
can be generalized to any function running on any
architecture;
•
A visual encoding model based on a data type
representing the domain of the vector code thus
described;
•
and finally, SIMDGiraffe, a freely available proto-
type to test the whole.
In
§
2, we present the related work and background
of our work. In
§
3, we present the problems facing
actors in the domain of vector programming and char-
acterize the input data of the domain problem. In
§
4,
we explain how we deduce from these data the behav-
ior of a vector function on a given vector architecture
during runtime. We also present the data structure to
store these data and the operations carried out on it,
all of which make it possible to describe this behavior
Ntang, P. and Lemire, D.
SIMDGiraffe: Visualizing SIMD Functions.
DOI: 10.5220/0010195201470154
In Proceedings of the 16th International Joint Conference on Computer Vision, Imaging and Computer Graphics Theory and Applications (VISIGRAPP 2021) - Volume 3: IVAPP, pages
147-154
ISBN: 978-989-758-488-6
Copyright
c
2021 by SCITEPRESS – Science and Technology Publications, Lda. All rights reserved
147

and to translate it in the form of visual representation.
In
§
5, we present the chosen visual encoding and
the interactions developed. We present in
§
6 exam-
ples of execution of SIMDGiraffe that we review. We
conclude in § 7.
2 RELATED WORK
Many hardware manufacturers provide programmers
with vector functions: the intrinsics. In the following,
speaking of these functions, we will use the two terms
vector and intrinsic as synonyms. These functions
are vector in the sense that their operands are vectors.
For example the operation 1 where
(a
0
,...,a
15
)
and
(b
0
,...,b
15
)
are operands, for i ranging from
0
to
15 a
i
and
b
i
being 32-bit signed integers (
int32
), can be com-
puted by the instruction
mm512 add epi32
available
on the AVX-512 instruction set (Intel, 2018).
2.1 Works on Intrinsic Functions
Vector operands give intrinsic instructions their power
and performance. A vectorized code can thus be supe-
rior to its scalar equivalent in terms of execution time
with a factor ranging from one to eight on the latest
generation of CPUs (AVX-512) (Bramas, 2017). More
generally, this performance is proportional to a factor
that depends on the size of the registers(Cebrian et al.,
2020), and therefore on the architecture on which the
code is executed. The vector instructions and archi-
tecture, or SIMD, is also efficient in terms of energy
consumption (Steigerwald and Agrawal, 2011). We
use the terms vector code, vector program or vector
function to denote codes, programs and functions that
are written using vector instructions i.e., intrinsics, un-
less otherwise specified. Vector programs can seem
difficult to design, understand, and maintain. Also,
some projects have tried to get around these difficul-
ties.
These projects consist essentially in the develop-
ment of libraries to encapsulate intrinsic functions and
hide their difficulties from programmers. Although
there are projects aimed at exploiting the performance
of intrinsics in other programming languages (Mc-
Cutchan et al., 2014) and even in databases (Fang
et al., 2019), most projects target C/C++. These
projects include Sierra (Leissa et al., 2014), ISPC,
CUBA, OpenMP (Lee et al., 2017), OpenCL, Ope-
nACC, Generic SIMD Library (Wang et al., 2014),
Array Notation (Krzikalla and Zitzlsberger, 2016), Vc
(Kretz and Lindenstruth, 2012), Boost.SIMD (Est
´
erie
et al., 2014), Neat SIMD (Gross, 2016), etc. The
goal of most of these projects is to allow C/C++ pro-
grammers to write code without worrying about intrin-
sic functions, either by overloading the operators, or
by letting the compiler carry out vectorization (auto-
vectorization). But most of the tools developed offer
simplicity to the detriment of performance and gen-
erally only deal with specific aspects (Est
´
erie et al.,
2014). They must also be maintained and updated.
Even if the performance of these tools were to be
optimized, vector programming will probably remain
the choice of certain types of programmers such as
library developers (Wang et al., 2014). Therefore, we
have to face the difficulties inherent in vector program-
ming if we really want to benefit from the advantages
it offers. Precisely, to face these difficulties, the ac-
tors of vector programming have developed several
strategies including communication through images.
These visual representations are used as well to ex-
plain an isolated vector instruction (InstLatX64, 2018;
Stupachenko, 2015) as to explain a vector code (Dirty
hands coding, 2019; Muła and Lemire, 2018). The
common weakness of all these uses of images is that
they only target those particular cases for which these
images are produced, but also, they can be biased
as they can be subject to the expert blind spot effect
(Nathan et al., 2001). These uses of visual representa-
tions are software visualization albeit at a rudimentary
level.
2.2 Software Visualization
Software visualization is part of information visual-
ization which is an active area of research with a
well-established foundation. Thus, there are model-
ing and step-by-step validation tools for the imple-
mentation of visualization solutions (Munzner, 2009),
well-developed methodological tools for design study
research (Sedlmair et al., 2012), and even a guide for
writing articles in the field (Munzner, 2008). These
achievements can easily be transposed to software vi-
sualization concerning the structure and evolution of
code. This transposition becomes much more com-
plicated when it comes to code behavior. It is, there-
fore, necessary to reconcile the more global approach
of information visualization (Munzner, 2014) with
the more specific approach of software visualization
(Diehl, 2007). Although this reconciliation is not the
subject of this paper, it is important to have these ad-
justments in mind to progress in a software visualiza-
tion process, more particularly when it comes to code
behavior. Some of the terminology used previously
is already specific to software visualization which is
the visualization of artifacts related to software and its
development process; and is concerned by its structure,
its behavior and its evolution (Diehl, 2007).
IVAPP 2021 - 12th International Conference on Information Visualization Theory and Applications
148

A concrete example of the difficulty in transposing
the achievements of information visualization to the
specific field of software visualization concerns the
data used to visualize the behavior of code. In general,
data and its manipulation by actors in the field are
key and critical moments for the information visual-
ization researcher. The latter should passively observe,
or actively by asking questions, these actors at work
(Sedlmair et al., 2012). While this may be true in
software visualization in terms of code structure and
evolution, it is less true when it comes to code behavior.
Not that the data are no longer key or critical, on the
contrary, but simply they are no longer given. The in-
formation visualization researcher may work on other
phases pending the acquisition of the data, although
there are risks involved (Sedlmair et al., 2012). This
approach is also quite possible for software visualiza-
tion in terms of the structure and evolution of code, but
would be difficult, if at all possible, for code behav-
ior. Indeed, there is for software visualization, with
regard to code behavior, an additional phase that could
be called specification of the data acquisition mode.
Code instrumentation for example corresponds to this
phase. This specification, of which the raw data to be
visualized is the ultimate result, determines what can
be done with this data. It is only after this stage that
the data can be characterized. The characterization
determines, of course, which aspects of code behav-
ior can be observed. This characterization naturally
involves, as in any information visualization process,
the description of the problem to be solved.
3 DOMAIN PROBLEM AND DATA
CHARACTERIZATION
The relevance of the problem we want to solve, and
the visualization approach adopted, stems essentially
from the literature review presented in
§
2. Indeed, the
use of images by the actors of vector programming
is the expression of a persistent need and justifies the
relevance of visualization as a solution to overcome the
difficulties associated with understanding, explaining,
and maintaining vector codes.
3.1 Domain Problem
More specifically, we want to help those involved in
the field to understand the behavior of vector code
when executed on a given vector architecture. We in-
sist on this architectural aspect, because after all it is
the first condition of vectorization. Indeed, without
the appropriate hardware architecture, in particular the
presence of vector registers, vectorization is not pos-
sible. For the behavior of a code at runtime, one can
use instrumentation. But instrumentation is generally
a source of bias since it can modify the behavior of
code at runtime (Diehl, 2007). In addition, the in-
strumentation makes the separation between referrers
and attributes unclear. However, this is the standard
for other areas of information visualization (Purchase
et al., 2008). Visualization then consists in looking
for metaphors making it possible to describe the rela-
tionships between these two characteristics of the data
or even simply to represent one of the characteristics.
The modeling of code behavior has been the subject
of several works (Kwon and Su, 2011; Dupont et al.,
2008). These works, whether they are based on con-
straints on data approach (Ernst et al., 2001; Cicchello
and Kremer, 2004), the finite state machines approach
(Biermann and Feldman, 1972), or on a synthetic ap-
proach (Lorenzoli et al., 2008), are mainly interested
in the generation of code behavior models. Tools such
as LLVM Machine Code Analyzer can be considered
as instantiations of these models. We need an opera-
tional model to generate the attributes describing the
behavior of code running on a given target architec-
ture. This will bring us closer to the standard of the
other areas of information visualization. This model is
based on the assumption and the observation that any
program is determined, from the point of view of its
behavior, by an instance of that program on a physical
architecture and only. We use the term architecture to
denote the physical machine and its basic primitives
which allow the manipulation of the hardware.
In functional form, we can write that the behavior
of a program at runtime (PE) is
PE = F(S,H) (2)
where S is the source code or the software, and H is
the architecture or the hardware on which this source
code runs. This function can be broken down into
elementary functions, each corresponding to an oc-
currence of an instruction in a register used by the
program during its execution. All the rest of the mem-
ory that is not part of the registers is seen as a single
particular register. This formalism allows, at least at
the machine language level, to describe the semantics
of a code in a consistent way (Dasgupta et al., 2019).
Equation 2 is then an aggregation of these elementary
functions. With the assumption that the aggregation
of elementary functions restores the overall behavior
of the code, the output of this equation corresponds
to the attributes used to characterize the behavior of
the code
S
on the architecture
H
. Here, as with any
software visualization problem, especially with code
behavior, one of the main problems is determining and
obtaining data to express code behavior at runtime.
SIMDGiraffe: Visualizing SIMD Functions
149

3.2 Data Characterization
Unlike other fields of information visualization and
even software visualization in terms of the structure
and evolution of code, The raw data that are the source
codes are not sufficient to understand the behavior of
this code at runtime, so they cannot be taken as the
raw material of the process. One of the first and main
problems to be solved here is not to obtain the data, but
to specify how to get to this data; only then does the
question of its acquisition and characterization arise.
For other areas of information visualization, and even
for the evolution and structure of a code, only the
problems of data acquisition and characterization arise.
One cannot, by looking at the code of a function, or
even by analyzing it, obtain information about its be-
havior at runtime. At a minimum, and this is especially
practical for an algorithm, an abstract execution must
be carried out. But in real world, the behavior of code
depends on the architecture on which it is executed.
So the PE function depends on two variables which
are the source code S and the architecture H. Tools
like the LLVM Machine Code Analyzer embedded
in Godbolt allow us to calculate the output of such a
function. Indeed, this tool makes it possible to gen-
erate, according to the target architecture passed as a
parameter, data describing the behavior of a code that
is executed on this architecture. This behavior is de-
scribed in terms of memory occupation, input/output
operations performed by the code, sequences of modi-
fications performed by the code on the registers, i.e.,
the calculation and control sequences, and even the per-
formance of code executions in terms of duration, etc.
SIMDGiraffe therefore relies on Godbolt for the gen-
eration of this data, which it retrieves and processes.
4 OPERATION AND DATA TYPE
ABSTRACTION
Before getting to the computer processing of data in
SIMDGiraffe, the code behavior must be abstracted
from the data. This abstraction is then concretized
through an abstract data type, which structures the pos-
sibilities in terms of visual encoding and interactions.
The retrieved data, which feeds the abstract data type,
then undergoes a logical and formal transformation
to fit it. To achieve this transformation, we take ad-
vantage of equation 2. In this equation,
F
is defined
on
S × H
where
S
is the vector source code and
H
is the vector architecture. We can take advantage of
the fact that the instances of the instructions of S are
finite in number, as are the registers. For example, they
are sixteen 512-bit SIMD registers in 64-bit mode on
the AVX-512 generation (Intel, 2011) and even bet-
ter, not all registers are used during the execution of
a given program. We then decompose
S
into a series
of instances of each of its instructions. We exploit the
fact that the intrinsic functions have an equivalent in
assembler, and therefore it is these equivalents that
appear in this decomposition of
S
. In this way, we
assimilate
S
to these instances. The architecture is also
assimilated to the registers used by the code
S
during
its execution. We define the relation
R
from
S
to
H
by
sRh
if only if
s
use
h
. The graph of
R
is a subset of
the matrix table
S × H
. The restriction of
F
to
R
then
breaks down into
f
i
r
, the output of which describes the
behavior of instance
i
of a vector instruction on a regis-
ter
r
. The matrix array is enriched by describing each
element
(i,r)
of
R
with its output
f
i
r
. In the cell corre-
sponding to this element, we place the description of
the behavior of the instruction on the register. Finally,
we get a double-entry array whose rows are instances,
columns are registers, and the cell
(i,r)
is occupied by
the output of
f
i
r
corresponding to the instance
i
and
the register
r
if they are in the graph of
R
(
(i,r) ∈ R
)
or nothing if they are not in this graph. Each column
is ordered since the instances appear in the order in
which they use the corresponding register. This is a
total order because two instances cannot use the same
register at the same time. This order is obtained from
the description at the output of the function
F
. The
data structure which is suitable for this representation
is naturally a matrix. The main justification for this
choice is that the data itself is in matrix form. The ele-
ment
(i,r)
of this matrix is an object which describes
the interaction of the instance
i
on the register
r
if this
pair is in the graph of
R
and 0 or null if it is not in the
graph of
R
. The visual encoding and the interactions
are obtained from this matrix.
5 VISUAL ENCODING AND
INTERACTION DESIGN
In the way the matrix is obtained, this encoding, and
the interactions that follow translate the behavior of the
code when it is executed on the target architecture. To
find the visual encoding that translates the description
carried by the matrix in a cognitively efficient way, we
follow the principles for graphic encoding (Engelhardt
and Richards, 2020) and the rules of color scheme
(MacDonald, 1999). The color scheme is done during
the implementation because the display medium must
be considered. It is done by applying the rules, but
also by adjustments according to the visual rendering
obtained. In the description carried by the matrix, we
only consider input/output and operations on registers,
IVAPP 2021 - 12th International Conference on Information Visualization Theory and Applications
150
since they reflect the code behavior. For machine code,
we equate this behavior to its semantics.
5.1 Visual Encoding
In terms of semantics, a machine instruction can be
modeled in three simple steps: reading the source
operands, performing an operation, writing to the des-
tination operands (Dasgupta et al., 2019). Thus, we
can completely describe a program by a sequence of
triples read, operation, write. Each element of such a
triple corresponds to the modification of the state of
one or more registers. We can translate this triple by
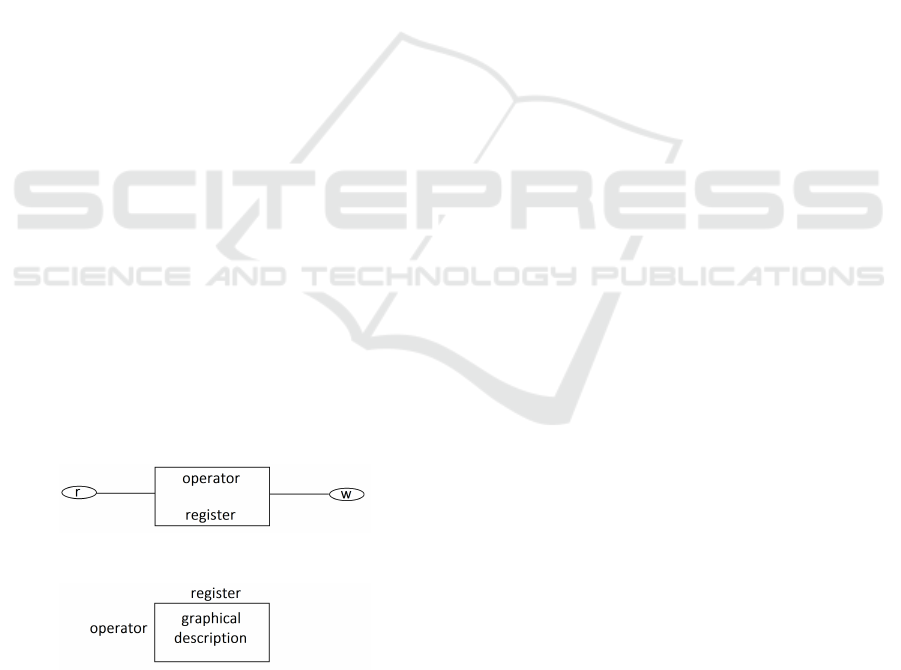
the graphic sequence of Figure 1. In this representa-
tion, r stands for read, and w stands for write. It is
assumed that if there is no reading or writing during
a register operation, the corresponding ellipse is left
empty. We modify this figure slightly in the visual
representation to obtain Figure 2. Although for most
software visualization taxonomies (Diehl, 2007; My-
ers, 1990; Blaine Price and Small, 1998) visualization
of code behavior at runtime involves dynamic visual-
ization, we opt for static visualization. Indeed, it is
established that a static visualization, if it can provide
the same information as a dynamic visualization, is
better in terms of cognitive efficiency and effectiveness
in comprehension (Robertson et al., 2008). To fully
describe the action of an operation on a register, we do
not need any additional information from the user or
any other entity; we only need the source code and the
target architecture. This action is also not time depen-
dent. With the assumption that all the information to
be visualized can be displayed in a rectangle similar
to that of Figure 2, the choice of a static visualization
is therefore appropriate. The matrix is thus translated
into a series of images describing the behavior of the
code in a plane and the names of rows and columns
are added.
Figure 1: Triple as graphic sequence.
Figure 2: Sequence transformed into a geometric cell.
5.2 Interaction Design
The interactivity of the system is designed with spe-
cific objectives and scenarios. The objectives of the
interactivity of the system are to allow the user to slice
the vector source code into logical blocks according
to the behavior of this code during its execution, to
localize in the source code the instances of a vector
instruction appearing on the visual representation, to
have explanations on each of the vector instructions
appearing in the decomposition of the vector source
code. This interactivity relies for a large part on formal
relations that link elements together.
Thus, let the relation
G
defined on
R
by
(i
n
,r
m
) G (i
k
,r
l
)
if and only if the entry of the register
r
l
for the instruction
i
k
is read on the register
r
m
for the
instruction
i
n
or
(n,m) = (k, l)
. If we set
P
x
0
= {x ∈
R and ∃y ∈ R /(y G x
0
or x
0
G y) and (y G x or x S y)}
,
we define from a given point
x
0
of
R
a path starting
from the entry point of the function
S
to an exit point
of this function. An exit point is defined here as a point
where the function accesses memory for writing with-
out the value thus written being no longer accessed
during its execution. Such a path makes it possible
to isolate logical blocks of independent or weakly de-
pendent code. A block is independent if it can run
independently from the rest of the function up to its
exit point. A block is weakly dependent if it can exe-
cute independently from the rest of the function, but
its return value is read internally into the function. In
SIMDGiraffe, the user just needs to set
x
0
and see
P
x
0
.
Up to two points can be set, and their path visualized
at the same time. A point is set either by pointing it
with the mouse and in this case, it ceases to be a set
point when it is no longer pointed or either by clicking
on it and in this case, it is set until you click on it
again. When a point is set, the corresponding vector
instruction instance is selected. An instance of a vector
instruction can be selected by pointing directly to the
name of the instance in question. When an instance
of a vector instruction in the visual representation is
selected, the corresponding block in the source code
is highlighted. There is thus an interactive visual cor-
respondence between the source code and the visual
representation of its behavior when executed on the
target architecture. An explanation of the vector in-
struction of which an instance is selected is also given
in the graphical representation space. Although there
are some code samples preloaded in SIMDGiraffe, the
users can type their own vector source code and in-
teractively visualize its behavior when it is run on the
target architecture.
6 EXAMPLE AND REVIEW
In this example, the target vector architecture, which
is parameterized in the source code of SIMDGi-
SIMDGiraffe: Visualizing SIMD Functions
151
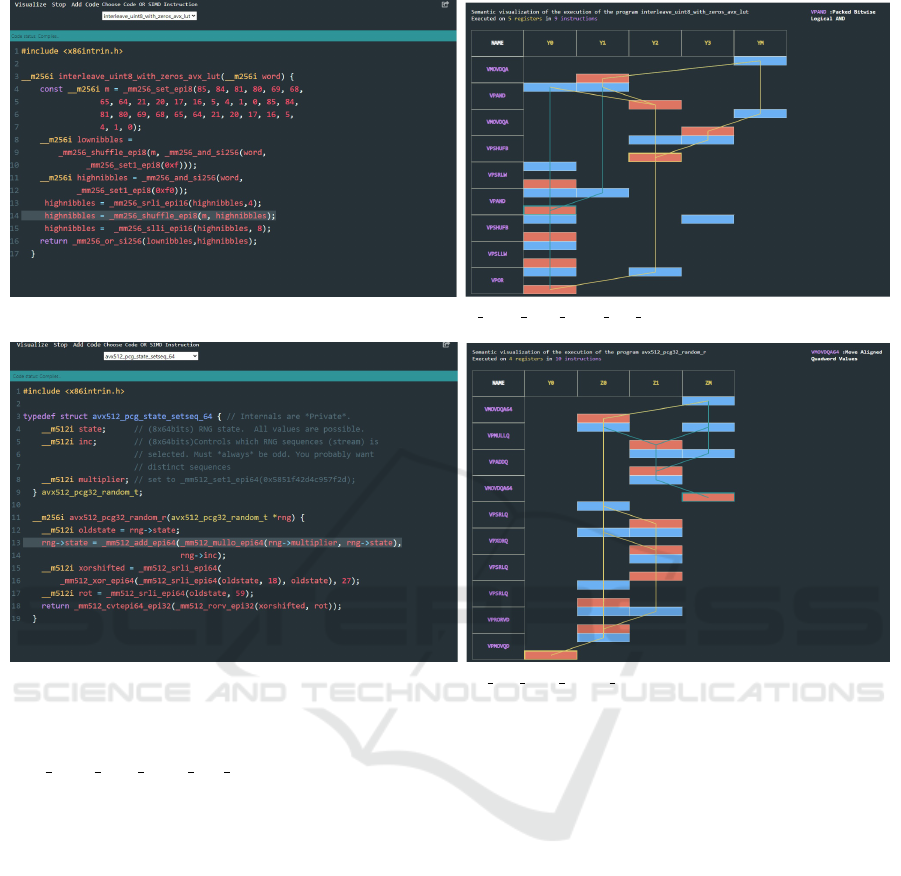
Figure 3: Spatial view of program interleave uint8 with zeros avx lut at runtime.
Figure 4: Spatial view of program avx512 pcg state setseq 64 at runtime.
raffe, is the AVX-512 of Intel. The example in Fig-
ure 3 shows the visualization of the function inter-
leave uint8 with zeros avx lut. In the right window,
there is a summary of the execution of the function on
the target architecture above the visualization plane.
Thus, on the AVX-512, this function is executed with
5 registers in 9 instances of vector instructions. On
the right, at the top of this window, we have the ex-
planation of the VPAND vector instruction, of which
one of the instances is the last selected. The points
are represented by rectangles. The first set point has
a yellow rectangle edge, and the second set point has
a green rectangle edge. In the left window, the high-
lighted instruction, i.e. line 14, corresponds to the
last instance selected, i.e. the second instance of the
VPAND instruction; the sixth line in the case. The
path in yellow materializes a code block that is weakly
dependent on the rest of the code.
In the second example in Figure 4, we also have
two instances selected. What can be noticed is that the
two set points delimit through their respective paths
two independent blocks of codes. This function at
the level of the first block of code accesses and writes
on the memory during its execution, as can be seen.
Viewing the behavior of this function shows us that
we can split the source code into two large blocks
that share a single declaration and variable assignment
at the input of each of the two blocks. This is the
instruction:
__m512i oldstate = rng->state;
The first block of runtime behavior, whose path in
the visual representation is in blue, corresponds to the
first block of the source code:
rng->state=_mm512_add_epi64(_mm512_mullo_epi64
(rng->multiplier, rng->state), rng->inc);
The second block of runtime behavior corresponds
to the second block of the source code:
__m512i xorshifted = _mm512_srli_epi64(
_mm512_xor_epi64(_mm512_srli_epi64
(oldstate, 18), oldstate), 27);
__m512i rot = _mm512_srli_epi64(oldstate, 59);
return _mm512_cvtepi64_epi32(_mm512_rorv_epi32
(xorshifted, rot));
Determining the start and end of each block in the
source code is done by setting the entry and exit point
respectively in the visual representation. The start and
IVAPP 2021 - 12th International Conference on Information Visualization Theory and Applications
152

end of the block are then respectively highlighted each
time. These two blocks run independently. Thanks
to the visual representation, a person with little expe-
rience in vector programming was able to make this
slicing, just as he was able to notice the writing access
in memory by the function.
7 CONCLUSION
SIMDGiraffe
1
is a prototype designed to help vector
programming actors in explaining and understanding
the behavior of vector code, more precisely vector
functions, on a given target architecture. Consequently,
it can help in the maintenance of vector functions.
SIMDGiraffe is the result of an overall approach fo-
cusing on a model for describing the domain of the
behavior of vector source code when running on a tar-
get architecture; a visual encoding model; and choices
on the type of data representations to allow passing
from data describing this behavior to images. The cur-
rent prototype has been tested on examples of vector
functions with positive feedback.
Encouraged by these results, we intend in our fu-
ture work to deepen our domain description model by,
for example, integrating performance-related elements
and thus making it possible to predict this performance
according to a given target architecture; deepen the
visual encoding model by unfolding in this model the
description of the calculation and control operations
since for the moment only the inputs/outputs opera-
tions, reading and writing, are presented graphically;
translate these insights into the prototype; carry out
a more formalized evaluation of this prototype, for
example through a case study.
ACKNOWLEDGEMENTS
This work was supported by NSERC, Grant/Award
Number: 1255914. We thank J. Piotte, for his contri-
bution to the foundations of this project during the ex-
ploration of the experimented trail in SIMD-Visualiser.
REFERENCES
Biermann, A. W. and Feldman, J. A. (1972). On the
Synthesis of Finite-State Machines from Samples of
Their Behavior. IEEE Transactions on Computers,
C-21(June):592–597.
1
Online at https://pmntang.github.io/SIMDGiraffe/#/.
Blaine Price, R. B. and Small, I. (1998). A Principled Tax-
onomy of Software Visualization. In Stasko, John;
Domingue, John; Brown, Marc H; Price, B., editor,
Software Visualization: Programming as a Multimedia
Experience, chapter 3, pages 57–81. MIT press.
Bramas, B. (2017). Inastemp: A Novel Intrinsics-as-
Template Library for Portable SIMD-Vectorization.
Scientific Programming, 2017.
Cebrian, J. M., Natvig, L., and Jahre, M. (2020). Scalability
analysis of AVX-512 extensions. Journal of Supercom-
puting, 76(3):2082–2097.
Cicchello, O. and Kremer, S. C. (2004). Inducing gram-
mars from sparse data sets: A survey of algorithms
and results. Journal of Machine Learning Research,
4(4):603–632.
Dasgupta, S., Park, D., Kasampalis, T., Adve, V. S., and
Ro
s¸
u, G. (2019). A complete formal semantics of
x86-64 user-level instruction set architecture. In Pro-
ceedings of the 40th ACM SIGPLAN Conference on
Programming Language Design and Implementation,
pages 1133–1148. ACM.
Diehl, S. (2007). Software visualization: visualizing
the structure, behaviour, and evolution of software.
Springer Science & Business Media.
Dirty hands coding (2019). utf8lut: Vector-
ized UTF-8 converter. Decoding UTF-
8. https://dirtyhandscoding.github.io/posts/
utf8lut-vectorized-utf-8-converter-introduction.html.
Dupont, P., Lambeau, B., Damas, C., and Van Lamsweerde,
A. (2008). The QSM algorithm and its application to
software behavior model induction. Applied Artificial
Intelligence, 22(1-2):77–115.
Engelhardt, Y. and Richards, C. (2020). The DNA Frame-
work of Visualization, volume 12169 LNAI. Springer
International Publishing.
Ernst, M. D., Cockrell, J., Griswold, W. G., and Notkin, D.
(2001). Dynamically discovering likely program invari-
ants to support program evolution. IEEE Transactions
on Software Engineering, 27(2):99–123.
Est
´
erie, P., Falcou, J., Gaunard, M., and Laprest
´
e, J.-
T. (2014). Boost.SIMD: Generic Programming for
Portable SIMDization. In Proceedings of the 2014
Workshop on Programming Models for SIMD/Vector
Processing, WPMVP ’14, pages 1–8, New York, NY,
USA. ACM.
Fang, Z., He, Z., Chu, J., and Weng, C. (2019). Simd accel-
erates the probe phase of star joins in main memory
databases. In International Conference on Database
Systems for Advanced Applications, pages 476–480.
Springer.
Gross, M. (2016). Neat SIMD: Elegant vectorization in C++
by using specialized templates. In High Performance
Computing & Simulation (HPCS), 2016 International
Conference on, pages 848–857. IEEE.
InstLatX64 (2018). VPMADDUBSW//VPMADDWD.
https://twitter.com/InstLatX64/status/
976059767176204288.
Intel (2011). Intel 64 and IA-32 Architectures Software
Developer’s Manual Combined Volumes. System,
3(253665).
SIMDGiraffe: Visualizing SIMD Functions
153

Intel (2018). Intel intrinsics guide. https://software.intel.
com/sites/landingpage/IntrinsicsGuide/.
Kretz, M. and Lindenstruth, V. (2012). Vc: A C++ library
for explicit vectorization. Software: Practice and Ex-
perience, 42(11):1409–1430.
Krzikalla, O. and Zitzlsberger, G. (2016). Code Vectorization
Using Intel Array Notation. In Proceedings of the 3rd
Workshop on Programming Models for SIMD/Vector
Processing, WPMVP ’16, pages 6:1–6:8, New York,
NY, USA. ACM.
Kwon, T. and Su, Z. (2011). Modeling high-level behav-
ior patterns for precise similarity analysis of software.
Proceedings - IEEE International Conference on Data
Mining, ICDM, pages 1134–1139.
Lee, J., Petrogalli, F., Hunter, G., and Sato, M. (2017). Ex-
tending OpenMP SIMD Support for Target Specific
Code and Application to ARM SVE. In International
Workshop on OpenMP, pages 62–74. Springer.
Leissa, R., Haffner, I., and Hack, S. (2014). Sierra: A
SIMD Extension for C++. In Proceedings of the 2014
Workshop on Programming Models for SIMD/Vector
Processing, WPMVP ’14, pages 17–24, New York, NY,
USA. ACM.
Lemire, D., Kurz, N., and Rupp, C. (2018). Stream VByte:
Faster byte-oriented integer compression. Information
Processing Letters, 130:1–6.
Li, B., Mooring, J., Blanchard, S., Johri, A., Leko, M., and
Cameron, K. W. (2017). Seemore. J. Parallel Distrib.
Comput., 105(C):183–199.
Lorenzoli, D., Mariani, L., and Pezz
`
e, M. (2008). Automatic
generation of software behavioral models. Proceedings
- International Conference on Software Engineering,
pages 501–510.
MacDonald, L. W. (1999). Using color effectively in com-
puter graphics. IEEE Computer Graphics and Applica-
tions, 19(4):20–35.
Maleki, S., Gao, Y., Garzar
´
an, M. J., Wong, T., and Padua,
D. A. (2011). An evaluation of vectorizing compilers.
In Proceedings of the 2011 International Conference
on Parallel Architectures and Compilation Techniques,
PACT ’11, pages 372–382, Washington, DC, USA.
IEEE Computer Society.
McCutchan, J., Feng, H., Matsakis, N., Anderson, Z., and
Jensen, P. (2014). A SIMD Programming Model for
Dart, Javascript,and Other Dynamically Typed Script-
ing Languages. In Proceedings of the 2014 Workshop
on Programming Models for SIMD/Vector Process-
ing, WPMVP ’14, pages 71–78, New York, NY, USA.
ACM.
Muła, W. and Lemire, D. (2018). Faster base64 encoding
and decoding using AVX2 instructions. ACM Trans.
Web, 12(3).
Munzner, T. (2008). Process and pitfalls in writing infor-
mation visualization research papers. Lecture Notes in
Computer Science, 4950 LNCS:134–153.
Munzner, T. (2009). A nested model for visualization design
and validation. IEEE Transactions on Visualization
and Computer Graphics, 15(6):921–928.
Munzner, T. (2014). Visualization Analysis and Design. A
K Peters/CRC Press.
Myers, B. A. (1990). Taxonomies of visual programming and
program visualization. Journal of Visual Languages
and Computing, 1(1):97–123.
Nathan, M. J., Koedinger, K. R., and Alibali, M. W. (2001).
Expert blind spot: When content knowledge eclipses
pedagogical content knowledge. In Proceedings of
the third international conference on cognitive science,
pages 644–648. Beijing: University of Science and
Technology of China Press.
Nuzman, D., Dyshel, S., Rohou, E., Rosen, I., Williams,
K., Yuste, D., Cohen, A., and Zaks, A. (2011). Va-
por simd: Auto-vectorize once, run everywhere. In
International Symposium on Code Generation and Op-
timization, CGO 2011, pages 151–160.
Papenhausen, E., Mueller, K., Langston, M. H., Meister,
B., and Lethin, R. (2016). An interactive visual tool
for code optimization and parallelization based on
the polyhedral model. In Parallel Processing Work-
shops (ICPPW), 2016 45th International Conference
on, pages 309–318. IEEE.
Pohl, A., Cosenza, B., Mesa, M. A., Chi, C. C., and Juurlink,
B. (2016). An evaluation of current simd programming
models for c++. In Proceedings of the 3rd Workshop
on Programming Models for SIMD/Vector Processing,
WPMVP ’16, pages 3:1–3:8, New York, NY, USA.
ACM.
Purchase, H. C., Andrienko, N., Jankun-Kelly, T. J., and
Ward, M. (2008). Theoretical foundations of informa-
tion visualization. Lecture Notes in Computer Science,
4950 LNCS:46–64.
Robertson, G., Fernandez, R., Fisher, D., Lee, B., and Stasko,
J. (2008). Effectiveness of animation in trend visual-
ization. IEEE Transactions on Visualization and Com-
puter Graphics, 14(6):1325–1332.
Sedlmair, M., Meyer, M., and Munzner, T. (2012). Design
study methodology: Reflections from the trenches and
the stacks. IEEE Transactions on Visualization and
Computer Graphics, 18(12):2431–2440.
Steigerwald, B. and Agrawal, A. (2011). Developing Green
Software. Intel White Paper, pages 1–11.
Stringhini, D. and Fazenda, A. (2015). Characterizing com-
munication patterns of parallel programs through graph
visualization and analysis. In European Conference on
Parallel Processing, pages 565–576. Springer.
Stupachenko, E. V. (2015). Programming us-
ing AVX2. Permutations. https://software.
intel.com/content/www/us/en/develop/blogs/
programming-using-avx2-permutations.html?
wapkw=vpunpckl.
Trifunovic, K., Nuzman, D., Cohen, A., Zaks, A., and Rosen,
I. (2009). Polyhedral-model guided loop-nest auto-
vectorization. In 18th International Conference on
Parallel Architectures and Compilation Techniques -
Conference Proceedings, PACT, pages 327–337.
Wang, H., Wu, P., Tanase, I. G., Serrano, M. J., and Moreira,
J. E. (2014). Simple, portable and fast SIMD intrinsic
programming: Generic SIMD library. In Proceedings
of the 2014 Workshop on Programming Models for
SIMD/Vector Processing, WPMVP ’14, pages 9–16.
IVAPP 2021 - 12th International Conference on Information Visualization Theory and Applications
154
