
Effect of the Materials’ Properties in the Design of High
Transmittance and Low FWHM SiO
2
/TiO
2
Thin Film Optical Filters
for Integration in a Malaria Diagnostics Device
Mariana S. Costa
1a
, Vitória Baptista
1,2,3 b
, Graça Minas
1c
, Maria I. Veiga
2,3 d
and Susana O. Catarino
1e
1
Microelectromechanical Systems Research Unit (CMEMS-UMinho), School of Engineering, University of Minho,
Campus de Azurém, Guimarães, Portugal
2
Life and Health Sciences Research Institute (ICVS), School of Medicine, University of Minho,
Campus de Gualtar, Braga, Portugal
3
ICVS/3B’s – PT Government Associate Laboratory, Braga/ Guimarães, Portugal
Keywords: Malaria Diagnostics Device, Optical Filters, Optical Reflectance, Refractive Index, TFCalc.
Abstract: Malaria is an infectious disease, highly prevalent in world regions with lacking healthcare conditions.
Nowadays, malaria diagnostic methods in these endemic regions are mainly based on microscopy and rapid
diagnostic tests by immunochromatographic assays. Here, it is presented an optical diagnostic method, based
on reflectance spectrophotometry, through hemozoin (Hz) quantification, towards an innovative non-invasive
malaria diagnostic device. Therefore, a set of optical filters, with high transmittance and low full width at half
maximum (FWHM) at specific wavelengths, is designed for being integrated in the device. These allow the
full reconstruction of the optical reflectance spectrum, able to distinguish between healthy and infected
samples, with a detection limit up to 12.5 parasites/μl of red blood cells. This work presents the design,
performance simulation, and optimization of 16 highly selective narrow band-pass optical filters, based on
multilayer stacks of SiO
2
/TiO
2
thin films. The optical properties of the thin films layer materials, in particular
the refractive indexes, are the main focus in this study. Three different reflective indexes were evaluated and
the results showed that, for all the simulated conditions, each filter is sensitive to a single wavelength with a
FWHM < 25 nm and peak transmittance intensity > 90%, but slight variations were observed for the different
refractive indexes. The simulation results proved that these 16 optical filters designs are extremely sensitive
to the material properties, although they are the best option regarding the required optical response, assuring
feasibility and being adequate for the fabrication process.
1 INTRODUCTION
Malaria is a life-threatening and parasitic infectious
disease, with a worldwide impact. This disease is a
leading cause of death in many malaria-endemic
regions such as Western Pacific, South, and Central
America, sub-Saharan Africa, South East Asia, and
the Eastern Mediterranean. Simultaneously, malaria
imported infections, in non-endemic areas amongst
returning travellers from endemic regions, are
a
https://orcid.org/0000-0001-8519-0525
b
https://orcid.org/0000-0002-4895-8053
c
https://orcid.org/0000-0003-2460-0556
d
https://orcid.org/0000-0002-2205-8102
e
https://orcid.org/0000-0002-8962-0710
significantly increasing. In 2018, there were still 87
countries and regions with ongoing malaria
transmission, and malaria resulted in an estimated
228 million cases and 405 000 deaths (Mer et al.,
2020).
Nowadays, there are available many methods for
malaria diagnosis, which are based on the detection
of the parasites in the blood. Examples of these
methods are clinical diagnosis, optical microscopy,
molecular diagnosis by polymerase chain reaction
Costa, M., Baptista, V., Minas, G., Veiga, M. and Catarino, S.
Effect of the Materials’ Properties in the Design of High Transmittance and Low FWHM SiO2/TiO2 Thin Film Optical Filters for Integration in a Malaria Diagnostics Device.
DOI: 10.5220/0010193900210031
In Proceedings of the 14th International Joint Conference on Biomedical Engineering Systems and Technologies (BIOSTEC 2021) - Volume 1: BIODEVICES, pages 21-31
ISBN: 978-989-758-490-9
Copyright
c
2021 by SCITEPRESS – Science and Technology Publications, Lda. All rights reserved
21

(PCR) or loop-mediated isothermal amplification
(LAMP) and, more recently, several commercially
available rapid diagnostic tests (RDT). Clinical
diagnosis is the traditional method, based on the
analysis of the patients’ symptoms, which is
performed by a medical specialist. Therefore, the risk
associated with the subjectivity of this method may
lead to misdiagnosis and wrong treatment (Orish et
al., 2016). Optical microscopy allows the
quantification and distinction of species but requires
laboratorial equipment and qualified technicians,
which can lead to a subjective interpretation of the
results. This method is inexpensive yet difficult to
implement in remote endemic regions, allowing for a
detection limit between 50 to 100 parasites/µl of red
blood cells (Kasetsirikul et al., 2016). RDT have
comparable sensitivity and can be used in remote
locations. However, RDT are expensive and do not
allow the quantification of parasites, only allowing
their identification. The detection limit of this method
is 100 parasites/µl of red blood cells (Varo et al.,
2020). In terms of sensitivity and specificity, the best
method is the molecular diagnosis using PCR or
LAMP, with a detection limits of 1 to 5 parasites/µl
and ≤ 1 parasites/µl of red blood cells, respectively.
Nevertheless, these techniques need to be performed
in equipped laboratories. Thus, they are not used as
routine diagnosis on the field, being applied only for
research purposes (Gitta et al., 2020). Since all these
methods require the collection of blood samples and
disposable reagents and/or consumables (Silva et al.,
2017), new portable and low-cost diagnosis methods
and devices have been developed, aiming for
innovative solutions with no need for blood samples
and, therefore, non-invasive.
The malaria disease is caused by Plasmodium
parasites that are transmitted to humans via the bite of
infected female Anopheles mosquito vectors. If the
disease is not treated timely, progression to severe
disease with organ dysfunction and death may occur
(Krampa et al., 2020). The presence of malaria
parasites on human blood leads to a set of
morphological and biochemical alterations on the red
blood cells (RBCs). One of the main phenomena is
the degradation of haemoglobin (Hb), which is an
essential nutrient for Plasmodium metabolism during
its intracellular development. Hb degradation leads to
the release of the toxic heme group. Then, the parasite
detoxicates and produces crystal particles of heme,
called hemozoin (Hz). Hz, being the final product of
the Hb catabolism, accumulates in the RBCs as the
infection proliferates, while the Hb concentration
decreases. Additionally, human healthy blood does
not have any Hz and its concentration increases as the
disease advances.
Since Hz and Hb have different characteristic
optical spectra, mainly in the visible range, with
different absorbance and reflectance peaks, and those
spectra are modified according to the Hb and Hz
concentrations in blood (related to the presence or
absence of malaria infection), it is possible to identify
the presence of malaria parasites through optical
reflectance spectrophotometry as well as predict the
infection stage (Baptista et al., 2020; Catarino et al.,
2020; Silva et al., 2017).
Therefore, optical spectrophotometry, based on
absorbance or reflectance, has been arising as an
alternative solution for the improvement of the
existing malaria diagnostic methods and devices.
(Wong Kee Song, 2005). The research team proposes
the implementation of a non-invasive optical device
based on optical reflectance for the identification and
quantification of malaria parasites, aiming for a
detection limit up to 12.5 parasites/µl of red blood
cells. The device must contain optical band-pass
filters, specific for selected wavelengths, with high
transmittance and low full width at half maximum
(FWHM), to allow the reconstruction of the optical
reflectance spectra of the samples from a set of
discrete reflectance values. The optical device will
include a white light source, that emits light directed
to the sample, since the reflected sample’s spectrum
contains the specificity of the sample composition.
This reflected light reaches an array of photodiodes,
which converts the reflected light into electric
currents. The designed optical filters (16 filters, as
will be following detailed) will be responsible for
selecting and filtering the light at different
wavelengths, helping to reconstruct the spectrum of
each sample. Also, these filters must be multilayer
thin films, able to be deposited, during fabrication, on
top of a 16 silicon photodiodes’ array, included in the
optical device. Since it is well-known that thin-film
optical filters are highly sensitive to the properties of
their materials, as well as their thickness, the main
motivation for this work is to study the spectral
response of different dielectric materials, with
different optical properties, aiming for their full
characterization before fabrication. Therefore, in this
work, the spectral response of 16 thin-film band-pass
optical filters will be simulated, considering different
refractive indexes (from different databases), and
their performance will be assessed and discussed.
BIODEVICES 2021 - 14th International Conference on Biomedical Electronics and Devices
22
2 DESIGN OF THIN-FILM
OPTICAL FILTERS
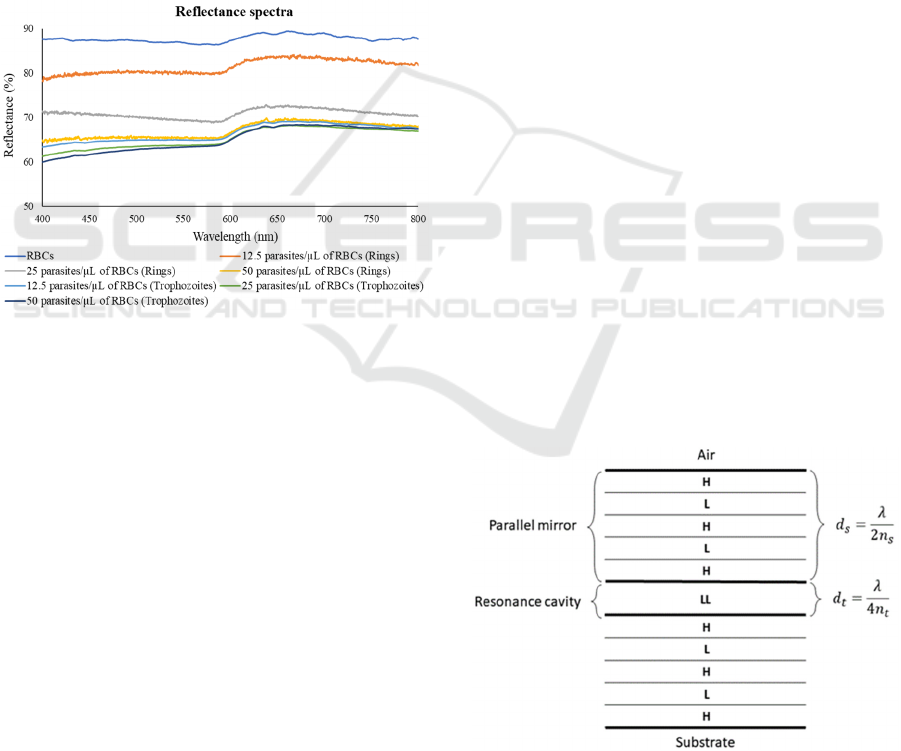
Figure 1 presents the original continuous reflectance
spectra of healthy RBCs and parasite infected RBCs,
at different parasitaemia, measured with a
spectrophotometric top-bench setup, comprised by a
200 W Quartz Tungsten Halogen light source (model
66881, Oriel Newport), optical-fibre probes, a cuvette
sample holder and an AvaSpec-ULS2048XL EVO
spectrometer (Avantes). Data were collected using
the AvaSoft 8.11 software. Barium sulphate was used
as a reference for reflectance measurements. The
plasmodium falciparum samples were cultured at Life
and Health Sciences Research Institute from
University of Minho (ICVS) (Baptista et al., 2020).
Figure 1: Reflectance spectra of healthy RBCs and RBCs
with early (rings) and late (trophozoites) with different
parasitaemia, from 12.5 to 50 parasites/all of the RBCs.
From this previous work of the research group
(Baptista et al., 2020) (represented in Figure 1), it was
selected a group of 16 specific relevant spectral
bands, in the optical spectrum. This set of
wavelengths will allow to reconstruct the continuous
reflectance spectra of the samples, containing healthy
RBCs and RBCs with early (rings) and late
(trophozoites) with parasitaemia ranging from 12.5 to
50 parasites/RBCs (Baptista et al., 2020). These
selected spectral bands are: 400, 435, 520, 590, 610,
620, 630, 640, 650, 660, 670, 680, 700, 720, 740 and
800 nm. In the following section, the methods for the
design of 16 thin-film multilayer optical filters for the
above referred narrow spectral bands will be
described.
2.1 Multilayer Structure Selection
The proposed narrow band-pass optical filters are
based on a multilayer thin-film structure, taking
advantage of the constructive or destructive
combinations that produce, simultaneously, passing
and rejection optical bands. The filters’ structures are
similar to a Fabry-Perot interferometer structure,
which consists of two flat parallel mirrors separated
by a layer with a pre-defined thickness, called
resonance cavity (Minas et al., 2004).
Figure 2 presents the working principle of a
multilayer optical filter, where the multilayer
structure, composed by two parallel mirrors and
visible resonance cavity, is visible. According to the
literature in the optical field, to obtain a good filter
performance using a Fabry-Perot interferometer
structure, the total number of layers must be 9 or 11.
After the simulations, it was chosen the 11 layers per
filter structure (Minas et al., 2006). The mirrors can
be dielectric films, featuring low energy absorption
rates and high transmittance at specific wavelengths,
comprised by five layers each with, alternatively,
high (H) and low (L) refractive index materials. The
resonance cavity of the filter has a multiple-beam
interference that causes a very high optical
transmission at a narrow band of wavelengths around
a wavelength for which the cavity is a multiple of one-
half wavelength thick. Furthermore, considering a
simple approach for the design of the optical filters
(an interference of first order and a light incidence
angle of 0º), Figure 2 presents two expressions for the
calculation of the resonance cavity and mirror
thicknesses, dt and ds, respectively. Finally, λ is the
transmitted wavelength and n is the refractive index
of the resonant cavity material (Pimenta et al., 2015).
Figure 2: Multilayer optical filter structure.
Effect of the Materials’ Properties in the Design of High Transmittance and Low FWHM SiO2/TiO2 Thin Film Optical Filters for
Integration in a Malaria Diagnostics Device
23

Therefore, in this optical filter structure,
considering similar films on both mirrors, the
thickness of the resonance cavity determines the
tuned wavelength. Taking advantage of that, 16 filters
were computationally designed and simulated using
the TFCalc 3.5 software, based on finite elements
methods, and supplied by Software Spectra Inc. As
previously referred, those filters were centred at 16
specific spectral bands in the visible optical spectrum:
400, 435, 520, 590, 610, 620, 630, 640, 650, 660, 670,
680, 700, 720, 740 and 800 nm.
2.2 Materials Selection
The parallel mirrors of the Fabry-Perot optical filters
are composed by multilayer stacks made with
dielectric thin films, which can produce high
transmission and low absorption losses. Since the
multilayer structure should consist in thin films with
low and high refractive indexes, silicon dioxide
(SiO
2
) and titanium dioxide (TiO
2
), with low and high
refractive indexes, respectively, were selected as the
materials to comprise the filters. These dielectrics
materials are rigid, extremely difficult to remove
from the substrate, compatible with CMOS
fabrication and commonly deposited by Ion Beam
Deposition (IBD), which is the process typically used
for fabrication of optical filters. Additionally, SiO
2
was selected because of its almost constant
dependence of the refractive index, within the visible
range in the light spectrum, while TiO
2
was selected
due to fabrication constraints since its deposition
process is well-characterized (Pimenta et al., 2015).
3 SIMULATION OF THIN FILMS
OPTICAL FILTERS
Regarding the simulations, the TFCalc 3.5 software
was used for the computational design and simulation
of the 16 optical filters, characterizing them in terms
of transmittance peak and FWHM. The intensity of
the transmitted peaks should be as high as possible,
with at least twice the intensity of any noise peak that
might appear in the considered spectral range.
Regarding the FWHM, a value around 10 nm is
acceptable for the intended application.
In order to optimize the design and future
fabrication processes, the optical filters were initially
divided into three spectral regions: UV/VIS (400 nm
– 435 nm), VIS (520 nm – 620 nm) and VIS/IR (620
nm – 800 nm). In order to centre the optical filters at
different spectral bands by adjusting only the
thickness of the resonant cavity, made from SiO
2
, the
thicknesses of both mirrors' films were maintained
equally. The reference wavelengths chosen for each
region were 420 nm, 550 nm and 680 nm,
respectively. Besides the properties of the films’
materials, the simulation also considered the
properties of the substrate (glass), exit medium
(glass), reference wavelength, and incident medium
(air), which may influence the filters optical response.
In this way, three different experiments of
numerical simulations were performed, to assess the
best performance of the 16 optical filters, which most
closely resembles the performance of the filters that
will be achieved after fabrication. Between the
different sets of simulations, the values of the
refractive indexes (n) of the multilayer materials
(SiO
2
and TiO
2
) were modified, and different material
databases were evaluated. Table 1 presents the
refractive indexes of SiO
2
and TiO
2
at the 16 expected
spectral bands, according to two databases (Sopra
S.A. and refractiveindex.info (DeVore, 1951;
“https://refractiveindex.info/,” n.d.; Malitson, 1965),
as it will be explained in the following sections.
3.1 Ideal Refractive Indexes
The first design and simulations were performed
using the refractive indexes provided by the SOPRA
database (Table 1), since these values are considered
ideal for both materials, and only depend on the
optical wavelength. The Sopra S.A. company
(France) made its optical database available, as well
as the conversion to TFCalc format (Baptista et al.,
2020).
Table 2 shows the combination of layer thickness
for each optical filter designed in TFCalc, optimized
for the highest transmittance, for each relevant
wavelength. As observed in the table, the narrow
optical filters were divided into four regions: 400 –
435 nm, 520 – 620 nm, 630 – 720 nm and 740 – 800
nm, each group with similar layer thicknesses for the
mirrors, which will facilitate the design of masks and
future fabrication of the thin film optical filters.
In the designed filters, the two mirrors are
symmetrical and consist of five layers of TiO
2
and
SiO
2
, alternately, where layers of the same material
have the same thickness for each wavelength. This
separation of the 16 wavelengths in four sections will
be repeated in the next sets of simulations. Finally, for
each wavelength, the resonance cavity has a different
thickness, which was adjusted to achieve the highest
possible optical transmittance.
BIODEVICES 2021 - 14th International Conference on Biomedical Electronics and Devices
24

Table 1: Refractive indexes of SiO
2
and TiO
2
according to Sopra S.A. and refractiveindex.info databases.
Wavelength
Refractive Index (n)
SiO
2
TiO
2
Sopra S.A. refractiveindex.info Sopra S.A. refractiveindex.info
400 1.4701 1.4841 3.2861 2.3379
435 1.4668 1.4810 3.2192 2.2690
520 1.4613 1.4759 3.0000 2.1824
590 1.4584 1.4733 2.9100 2.1456
610 1.4577 1.4727 2.8894 2.1379
620 1.4574 1.4724 2.8800 2.1344
630 1.4571 1.4722 2.8750 2.1311
640 1.4568 1.4719 2.8700 2.1280
650 1.4565 1.4717 2.8600 2.1251
660 1.4563
1.4715
2.8500 2.1223
670 1.4560 1.4713 2.8444 2.1197
680 1.4558 1.4711 2.8400 2.1172
700 1.4553 1.4707 2.8300 2.1126
720 1.4549 1.4703 2.8200 2.1084
740 1.4544 1.4700 2.8100 2.1046
800 1.4533 1.4692 2.7900 2.0951
Table 2: Optical filters in the UV/Vis, Vis and Vis/IR regions and respective layer thicknesses, with the combinations SiO
2
/TiO
2
using SOPRA refractive index (RC: Resonance Cavity).
Peak of high transmittance per λ (nm)
400 435 520 590 610 620 630 640 650 660 670 680 700 720 740 800
Layer thickness (nm)
TiO
2
33 46 60 70
SiO
2
73 94 117 121
TiO
2
33 46 60 70
SiO
2
73 94 117 121
TiO
2
33 46 60 70
SiO
2
(RC)
127 151 168 219 235 243 196 204 211 219 226 233 247 262 248 291
TiO
2
33 46 60 70
SiO
2
73 94 117 121
TiO
2
33 46 60 70
SiO
2
73 94 117 121
TiO
2
33 46 60 70
3.2 Approximation of the Real
Refractive Indexes
Then, a new group of 16 filters was designed and
simulated, using the refractive indexes of the
materials obtained from the refractiveindex.info
database. This database is considered closer to the
real values of the refractive indexes of the materials,
contrarily to the ideal values from Sopra S.A.
Table 3 shows the combination of the layer
thickness values for each optical filter designed in
TFCalc, optimized for the highest transmittance,
using the refractiveindex.info database.
In comparison with Table 2, it is possible to verify
that these refractive indexes values lead to an increase
on the thickness of almost all filters (selected to
achieve the highest transmittance at the intended
wavelengths). However, in the 400 nm and 435 nm
band-pass filters, the SiO
2
layer is similar to the
Effect of the Materials’ Properties in the Design of High Transmittance and Low FWHM SiO2/TiO2 Thin Film Optical Filters for
Integration in a Malaria Diagnostics Device
25

previous one, while in the 630 nm and 800 nm band-
pass filters, those thicknesses decrease.
3.3 Impact of the Layer Thickness on
the Refractive Indexes of the
Materials
Finally, a group of 16 optical filters was designed
considering the variation of the refractive index of the
materials (TiO
2 and SiO2) with the thickness of each
layer (Table 4). In this set of simulations, the
refractive indexes were gathered from interpolation
of the data obtained from previous studies of the
research group (Pimenta et al., 2015), where the
refractive index of each material was experimentally
measured for a specific layer thickness. In the
reported data, each refractive index slightly decreases
with the increase of wavelength (in the 400 nm – 800
Table 3: Optical filters in the UV/Vis, Vis and Vis/IR regions and respective layer thicknesses, with the combinations SiO
2
/TiO
2
, using the refractive indexes from refractiveindex.info database (RC: Resonance Cavity).
Peak of high transmittance per λ (nm)
400 435 520 590 610 620 630 640 650 660 670 680 700 720 740 800
Layer thickness (nm)
TiO
2
44 64 78 96
SiO
2
73 98 114 120
TiO
2
44 64 78 96
SiO
2
73 98 114 120
TiO
2
44 64 78 96
SiO
2
(
RC
)
125 159 149 218 238 248 192 201 211 218 231 240 260 280 234 293
TiO
2
44 64 78 96
SiO
2
73 98 114 120
TiO
2
44 64 78 96
SiO
2
73 98 114 120
TiO
2
44 64 78 96
Table 4: Optical filters in the UV/Vis, Vis and Vis/IR regions and respective layer thicknesses, with the combinations SiO
2
/TiO
2
, using experimental refractive indexes from Pimenta et al. (2016) (RC: Resonance Cavity).
Peak of high transmittance per λ (nm)
400 435 520 590 610 620 630 640 650 660 670 680 700 720 740 800
Layer thickness (nm)
TiO
2
44 58 70 90
SiO
2
73 94 115 120
TiO
2
44 58 70 90
SiO
2
73 94 115 120
TiO
2
44 58 70 90
SiO
2
(RC)
114 144 151 211 229 238 185 194 203 211 220 228 245 263 210 262
TiO
2
44 58 70 90
SiO
2
73 94 115 120
TiO
2
44 58 70 90
SiO
2
73 94 115 120
TiO
2
44 58 70 90
BIODEVICES 2021 - 14th International Conference on Biomedical Electronics and Devices
26
nm range) and is higher as the thickness of the layer
increases, for both materials. For example, in the SiO
2
layer, the 73 nm thickness film has refractive indexes
around 1.47 (for all wavelengths range, despite their
small variations within the optical spectrum), while
for the 120 nm thickness film, it has refractive
indexes around 1.51. The same happens with the TiO
2
layer, i.e., for a 44 nm thickness, the refractive
indexes are between 2.6 and 2.3, while for the 90 nm
thickness layers, the refractive indexes are between
2.7 and 2.4, depending on the wavelength.
Therefore, Table 4 presents the combination of the
layers' thickness values for each filter, designed in
TFCalc, optimized for the highest transmittance when
the variation of the refractive index with the thickness
is considered.
4 RESULTS AND DISCUSSION
This section presents the main results of the optical
filter simulation for the three groups of refractive
indexes. The results of each set of designed optical
filters simulations are presented through the
transmittance spectra for the 16 optical filters.
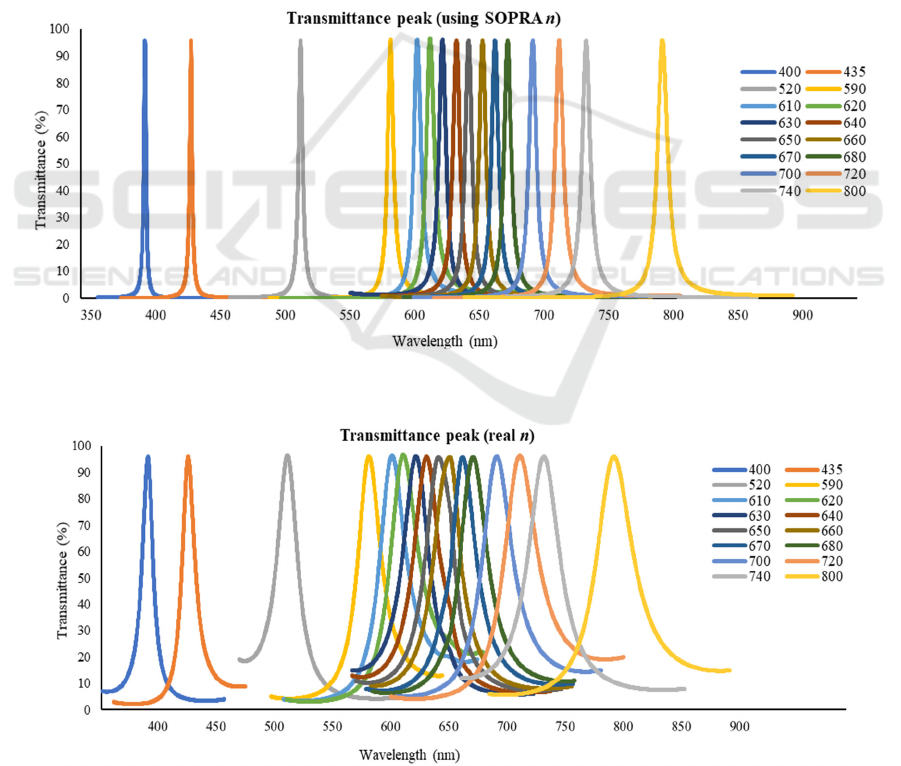
Figure 3 represents the spectra of the 16 narrow-
band optical filters when the SOPRA refractive
indexes are considered in the simulations. As seen in
Figure 3 plot, the percentage of transmittance is very
high (almost 100%) and the FWHM value is lower
than 10 nm for all filters. This simulation represents
the ideal properties of the materials. However, the
resultant spectra will not represent a reliable
approximation of the filters’ performance after
fabrication. Figure 4 presents the simulated spectra of
the
16 narrow-band optical filters when refractive
Figure 3: Transmittance vs wavelength, for the matrix of 16 optical filters, using Sopra S.A. refractive indexes. The structure
of the filters is shown in Table 2.
Figure 4: Transmittance vs wavelength, for the matrix of 16 optical filters, using refractive indexes from refractiveindex.info
database. The structure of the filters is shown in Table 3.
Effect of the Materials’ Properties in the Design of High Transmittance and Low FWHM SiO2/TiO2 Thin Film Optical Filters for
Integration in a Malaria Diagnostics Device
27
indexes from refractiveindex.info database are
considered in the simulations.
These results are closer to reality, and describe
better the materials' behaviour, which will be
essential during fabrication. When compared to the
previous results, while the transmittance is still high
(> 90%), the FWHM is significantly worse since it is
higher than 10 nm for all designed filters.
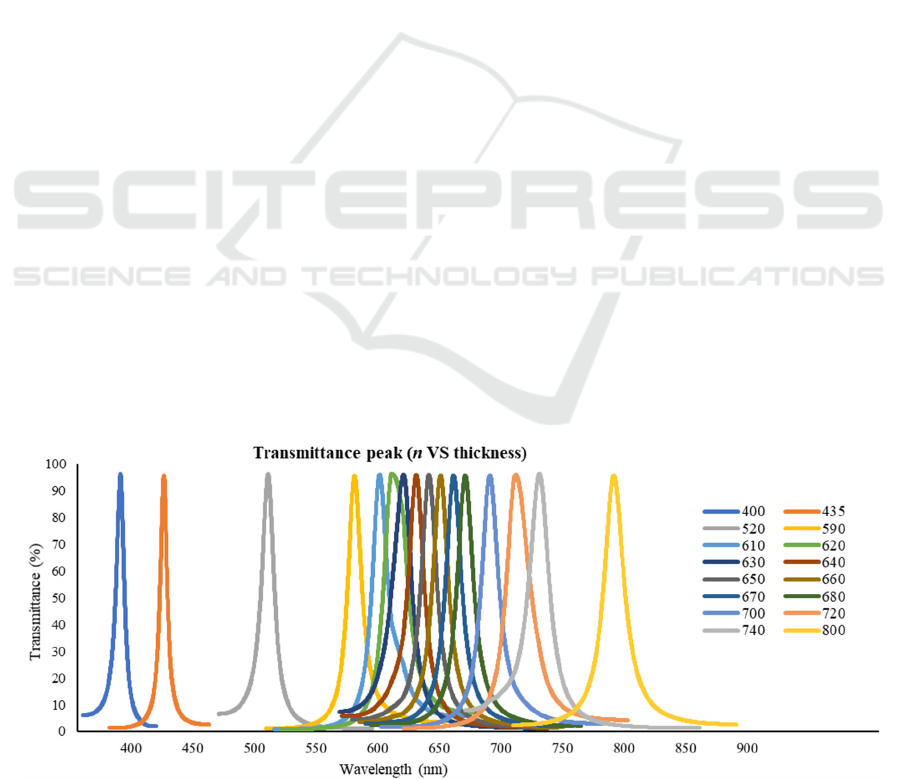
Finally, Figure 5 presents the spectra of the 16
optical filters, when the refractive index of the thin
film materials, used for simulation, is dependent on
the thickness of the layer. This design, when
compared to the previous one (Figure 4), shows better
results regarding the FWHM, since all filters present
a FWHM < 10 nm or around this value. Considering
the transmittance, their values are above 90%,
similarly to the ones from Figure 4.
In all the presented designs, the simulation results
confirm that multilayer stacks of 11 layers comprised
of Si0
2
/Ti0
2
thin films and a SiO
2
layer for the
resonance cavity are a good option for the design of
the thin film and narrow-band optical filters,
regarding their optical characteristics. Furthermore,
these designs are feasible for future fabrication
processes. The performance of the optical filters
could be improved by increasing the number of layers
in the dielectric mirrors, but the complexity of the
fabrication process would also increase (Minas et al.,
2004).
Moreover, those simulations allowed to conclude
that each band-pass filter for a specific spectral band
has a high transmittance, close or exceeding 90%
(which is explained by the theoretical refractive
indexes), and the FWHM average is around 10 nm
when the experimental refractive indexes, dependent
on the thickness of the layers, are considered.
Additionally, these results show that slight variations
in the refractive indexes imply significant
modifications in the thin films filters to achieve high
transmittance at the desired spectral band, and this
must be taken into account during the fabrication
processes.
4.1 Example of Application in the
Malaria Parasites Reflectance
Spectra
In order to assess if the designed and simulated
optical filters would be able to detect differences in
optical reflectance spectra, for the intended malaria
diagnostics applications, the transmittance data of the
designed 16 optical filters (based on the
refractiveindex.info database) were multiplied by a
typical reflectance spectrum of healthy RBCs and by
spectra of malaria infected RBCs, at different
parasitaemia (spectra previously presented in Figure
1). Figures 6 (a) and (b) present two examples of the
spectra obtained from the multiplication between
RBCs reflectance spectrum (Figure 1) and all the
simulated optical filters transmittance data.
Particularly, Figure 6 (a) presents the data for healthy
RBCs and Figure 6 (b) presents the data for RBCs
with late stage trophozoites containing a parasitaemia
of 50 parasites/μl of red blood cells. It is possible to
observe that the optical filters spectra are still visible
and distinguishable, with slight variations in the
peaks’ amplitude, resultant from the effect of the
reflectance spectra. Finally, Figure 6 (c) presents the
spectra resultant from the superposition of the healthy
and infected RBCs reflectance spectra with the area
of transmittance of all optical filters, i.e., at each
wavelength, the plot presents the cumulative effect of
all the filters whose transmittance spectra fall on that
Figure 5: Transmittance vs wavelength, for the matrix of 16 optical filters, using experimental refractive indexes from Pimenta
et al. (2016). The structure of the filters is shown in Table 4.
BIODEVICES 2021 - 14th International Conference on Biomedical Electronics and Devices
28
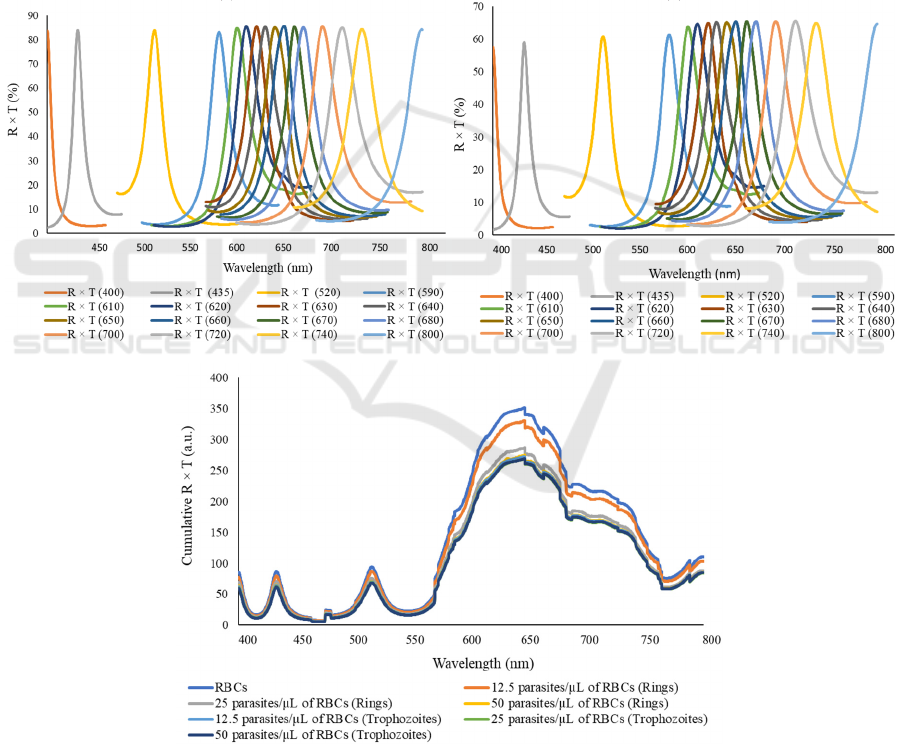
specific wavelength. For instance, while at 435 nm
only one filter allows light to be transmitted (the 435
nm filter), at 620 nm, all filters from 590 nm and 640
nm allow some light to be transmitted, increasing the
total amount of light to be received by the photodiode
array. The high number of optical filters presented in
the 570 nm – 750 nm range leads to an increase in the
total amplitude of the plot in that region, Figure 6 (c).
The results show that, between 400 nm and 550 nm,
there is no notorious difference between healthy and
malaria-infected RBCs. However, in the 600 nm –
650 nm range, there is a significant increase in the
obtained spectra, and the slope between 500 nm and
650 nm is higher as the parasitaemia decreases. From
these results, it is possible to infer that the system may
be able to distinguish between healthy and malaria
infected samples, enhancing its potential as a
diagnostic tool.
5 CONCLUSIONS
The paper describes the design, performance
simulation and optimization of 16 narrow band-pass
optical filters with multilayers based on thin films of
SiO
2
/TiO
2
, aiming an optical reflectance device for
non-invasive
malaria
diagnostics.
These
filters
were
(
a
)
(
b
)
(c)
Figure 6: (a) Optical transmittance spectra (%) obtained from the multiplication between the healthy RCBs reflectance
spectrum and the optical filters transmittance spectra; (b) Optical transmittance spectra (%) obtained from the multiplication
between the RBCs with late stage trophozoites with a parasitaemia of 50 parasites/μl reflectance spectrum and the optical
filters transmittance spectra; (c) Optical transmittance spectra (a.u.) resultant from the superposition of the healthy and
infected RBCs reflectance spectra (Figure 1) with the area of transmittance of all 16 optical filters.
Effect of the Materials’ Properties in the Design of High Transmittance and Low FWHM SiO2/TiO2 Thin Film Optical Filters for
Integration in a Malaria Diagnostics Device
29

characterized taking into account the materials of the
layers, as well as the requirements for high optical
transmittance and low FWHM. The design and
simulation of thin-film optical filters are a
challenging process. Several variables must be
simultaneously controlled to obtain optical filters
centred at the desired wavelengths, such as the thin-
films’ materials, thickness of each layer, refractive
indexes of the materials and multilayer structure.
Additionally, the simulated results showed that slight
variations in the refractive indexes imply significant
modifications in the thin films filters to achieve high
transmittance at the desired spectral band, a feature
that must be taken into account during the fabrication
processes. A compromise between the variation of the
materials' refractive indexes and the filter's
performance was achieved.
Despite some deviations in the simulated results
for the different experiments of the optical filters
(mainly in the FWHM values), their performance was
successfully evaluated, since it is possible to obtain
high transmittance for each of the selected
wavelengths. Also, the simulation results proved that
these 16 optical filters designs are extremely sensitive
to the material properties. However, the simulation
results also show that these filters are a good option
regarding the required optical response, assuring
feasibility and being suitable for the fabrication
process, showing high potential to be integrated into
the intended optical reflectance device for malaria
diagnosis.
Finally, the results from the combination of the
samples’ reflectance and the optical filters’
transmittance spectra, also show the potential of the
presented system to distinguish between samples of
different malaria parasites’ concentration with high
sensitivity, up to a limit of 12.5 parasites per
microliter of RBCs. This value is comparable to
current diagnostic methods and detection devices.
Besides that, the proposed optical diagnosis
methodology device is new, easily implemented, non-
invasive and does not need specialised laboratorial
equipment or facilities. Following the promising
simulation results, future developments will include
the deposition processes to fabricate the 16 optical
filters.
ACKNOWLEDGEMENTS
This work was supported by Project NORTE-01-
0145-FEDER-028178 funded by NORTE 2020
Portugal Regional Operational Program under
PORTUGAL 2020 Partnership Agreement through
the European Regional Development Fund and the
Fundação para a Ciência e Tecnologia (FCT), IP. V.
Baptista thanks FCT for the SFRH/BD/145427/2019
grant. Maria Isabel Veiga thanks FCT for her contract
funding provided through DL 57/2016 (CRP).
REFERENCES
Baptista, V., Calçada, C., Silva, M., Teixeira, M., Ferreira,
P., Minas, G., … Veiga, M. (2020). Hemozoin: the
future in malaria diagnosis. MAM 2020 – Molecular
Approaches to Malaria, Lorne, Australia, 28178.
Catarino, S. O., Felix, P., Sousa, P. J., Pinto, V., Veiga, M.
I., & Minas, G. (2020). Portable Device for Optical
Quantification of Hemozoin in Diluted Blood Samples.
IEEE Transactions on Biomedical Engineering, 67(2),
365–371.
https://doi.org/10.1109/TBME.2019.2913454
DeVore, J. R. (1951). Refractive Indices of Rutile and
Sphalerite. Journal of the Optical Society of America,
41(6), 416. https://doi.org/10.1364/josa.41.000416
Gitta, B., & Kilian, N. (2020). Diagnosis of Malaria
Parasites Plasmodium spp. in Endemic Areas: Current
Strategies for an Ancient Disease. BioEssays, 42(1), 1–
12. https://doi.org/10.1002/bies.201900138
https://refractiveindex.info/. (n.d.). Retrieved September 8,
2020, from https://refractiveindex.info/
Kasetsirikul, S., Buranapong, J., Srituravanich, W.,
Kaewthamasorn, M., & Pimpin, A. (2016). The
development of malaria diagnostic techniques: A
review of the approaches with focus on
dielectrophoretic and magnetophoretic methods.
Malaria Journal, 15(1).
https://doi.org/10.1186/s12936-016-1400-9
Krampa, F. D., Aniweh, Y., Kanyong, P., & Awandare, G.
A. (2020). Recent advances in the development of
biosensors for malaria diagnosis. Sensors
(Switzerland), 20(3).
https://doi.org/10.3390/s20030799
Malitson, I. H. (1965). Interspecimen Comparison of the
Refractive Index of Fused Silica*,†. Journal of the
Optical Society of America, 55(10), 1205.
https://doi.org/10.1364/josa.55.001205
Mer, M., Dünser, M. W., Giera, R., & Dondorp, A. M.
(2020). Severe malaria. Current concepts and practical
overview: What every intensivist should know.
Intensive Care Medicine, 46(5), 907–918.
https://doi.org/10.1007/s00134-020-06019-0
Minas, G., Wolffenbuttel, R. F., & Correia, J. H. (2006). An
array of highly selective Fabry-Perot optical channels
for biological fluid analysis by optical absorption using
a white light source for illumination. Journal of Optics
A: Pure and Applied Optics, 8(3), 272–278.
https://doi.org/10.1088/1464-4258/8/3/008
Minas, Graca, Ribeiro, J. C., Martins, J. S., Wolffenbuttel,
R. F., & Correia, J. H. (2004). An array of Fabry-Perot
optical-channels for biological fluids analysis. Sensors
BIODEVICES 2021 - 14th International Conference on Biomedical Electronics and Devices
30

and Actuators, A: Physical, 115(2-3 SPEC. ISS.), 362–
367. https://doi.org/10.1016/j.sna.2004.03.077
Orish, V. N., Ansong, J. Y., Onyeabor, O. S., Sanyaolu, A.
O., Oyibo, W. A., & Iriemenam, N. C. (2016).
Overdiagnosis and overtreatment of malaria in
children in a secondary healthcare centre in Sekondi-
Takoradi, Ghana.
https://doi.org/10.1177/0049475515622861
Pimenta, S., Cardoso, S., Miranda, A., De Beule, P.,
Castanheira, E. M. S., & Minas, G. (2015). Design and
fabrication of SiO_2/TiO_2 and MgO/TiO_2 based
high selective optical filters for diffuse reflectance and
fluorescence signals extraction. Biomedical Optics
Express, 6(8), 3084.
https://doi.org/10.1364/boe.6.003084
Silva, I., Lima, R., Minas, G., & Catarino, S. O. (2017).
Hemozoin and hemoglobin characterization by optical
absorption towards a miniaturized spectrophotometric
malaria diagnostic system. ENBENG 2017 - 5th
Portuguese Meeting on Bioengineering, Proceedings,
3–6. https://doi.org/10.1109/ENBENG.2017.7889466
Varo, R., Balanza, N., Mayor, A., & Bassat, Q. (2020).
Diagnosis of clinical malaria in endemic settings.
Expert Review of Anti-Infective Therapy, 0(0).
https://doi.org/10.1080/14787210.2020.1807940
Wong Kee Song, L. M. (2005). Optical spectroscopy for the
detection of dysplasia in Barrett’s esophagus. Clinical
Gastroenterology and Hepatology, 3(7 SUPPL.), 2–7.
https://doi.org/10.1016/S1542-3565(05)00250-8
Effect of the Materials’ Properties in the Design of High Transmittance and Low FWHM SiO2/TiO2 Thin Film Optical Filters for
Integration in a Malaria Diagnostics Device
31
