
Automatically Generating Websites from Hand-drawn Mockups
Jo
˜
ao Silva Ferreira
1
, Andr
´
e Restivo
2 a
and Hugo Sereno Ferreira
3 b
1
Faculdade de Engenharia da Universidade do Porto, Portugal
2
Faculdade de Engenharia da Universidade do Porto, LIACC, Portugal
3
Faculdade de Engenharia da Universidade do Porto, INESC TEC, Portugal
Keywords:
Synthetic Datasets, Neural Networks, Computer Vision, Real-time, Website Generation.
Abstract:
Designers often use physical hand-drawn mockups to convey their ideas to stakeholders. Unfortunately, these
sketches do not depict the exact final look and feel of web pages, and communication errors will often occur,
resulting in prototypes that do not reflect the stakeholder’s vision. Multiple suggestions exist to tackle this
problem, mainly in the translation of visual mockups to prototypes. Some authors propose end-to-end solu-
tions by directly generating the final code from a single (black-box) Deep Neural Network. Others propose the
use of object detectors, providing more control over the acquired elements but missing out on the mockup’s
layout. Our approach provides a real-time solution that explores: (1) how to achieve a large variety of sketches
that would look indistinguishable from something a human would draw, (2) a pipeline that clearly separates
the different responsibilities of extracting and constructing the hierarchical structure of a web mockup, (3) a
methodology to segment and extract containers from mockups, (4) the usage of in-sketch annotations to pro-
vide more flexibility and control over the generated artifacts, and (5) an assessment of the synthetic dataset
impact in the ability to recognize diagrams actually drawn by humans. We start by presenting an algorithm that
is capable of generating synthetic mockups. We trained our model (N=8400, Epochs=400) and subsequently
fine-tuned it (N=74, Epochs=100) using real human-made diagrams. We accomplished a mAP of 95.37%,
with 90% of the tests taking less than 430ms on modest commodity hardware (≈ 2.3fps). We further provide
an ablation study with well-known object detectors to evaluate the synthetic dataset in isolation, showing that
the generator achieves a mAP score of 95%, ≈1.5× higher than training using hand-drawn mockups alone.
1 INTRODUCTION
When designing a web page, professionals usually re-
sort to rough sketches to communicate and discuss
their ideas (Weichbroth and Sikorski, 2015). The very
nature of these mockups (i.e. basically lines) trans-
mits the idea of the elements, that will occupy cer-
tain parts of the layout, by the usage of agreed sym-
bols. The particular symbols may vary from culture
to culture and are generally the target study of semi-
otics (Eco et al., 1976). But as long as the collaborat-
ing parties agree to use the same symbols, mockups
become an efficient way to convey the general ideas
behind a work without its (time-consuming) specifici-
ties. A prototype is then subsequently implemented,
and the iteration restarts.
In this proposal, we aim to shorten the feedback
loop cycle to achieve real-time HTML generation
a
https://orcid.org/0000-0002-1328-3391
b
https://orcid.org/0000-0002-4963-3525
from hand-drawn sketches, while ensuring overall ac-
curacy (Aguiar et al., 2019). With the rise and relia-
bility of neural networks, the interpretation of mock-
ups became feasible by resorting to object detec-
tors (Redmon et al., 2017; Ren et al., 2017; Suleri
et al., 2019), or by generating text descriptions from
an image (You et al., 2016; Karpathy and Fei-Fei,
2015).
To train these models, a varied and large number
of examples is necessary. But in many cases, this
data is (a) non-existent, (b) missing required annota-
tions, (c) low-quality, with errors or untrustable, or
(d) not generally appropriate for the specific needs
of a project. This leaves only one straightforward,
though arguably easy, solution: to draw the dataset
by hand (Ellis et al., 2018; Yun et al., 2019a). To cir-
cumvent this problem, we will also present a mecha-
nism that automatically generates a large set of digital
hand-drawn-like mockups.
48
Ferreira, J., Restivo, A. and Ferreira, H.
Automatically Generating Websites from Hand-drawn Mockups.
DOI: 10.5220/0010193600480058
In Proceedings of the 16th International Joint Conference on Computer Vision, Imaging and Computer Graphics Theory and Applications (VISIGRAPP 2021) - Volume 5: VISAPP, pages
48-58
ISBN: 978-989-758-488-6
Copyright
c
2021 by SCITEPRESS – Science and Technology Publications, Lda. All rights reserved

2 RELATED WORK
One of the earliest attempts of interpreting human-
made sketches was proposed by Landay et al. (Lan-
day, 1995), which used a digital input device (such
as a stylus or a mouse) to classify and transform de-
signer drawings into their respective elements. But
complete translations of hand-drawn web pages to an
(almost final) prototype is something that gained in-
creased interest in the last years. We now provide a
summary of current related work and categorize their
strategies.
2.1 Heuristic based Methodologies
These methodologies make usage of “classic” com-
puter vision algorithms, such as thresholding and
morphological operations, where a sequence of pro-
cedures is executed iteratively until the elements
that compose the mockup are extracted. Hassan et
al. (Hassan et al., 2018) explore object hierarchy us-
ing a top-down approach, where the atomic elements
are first gathered and removed from the main im-
age, and then containers are detected. A bottom-
up approach is done by Huang et al. (Huang et al.,
2016), others add the ability to detect and recognize
text (Nguyen and Csallner, 2015)(Kim et al., 2018b).
2.2 End-to-End Methodologies
Recent advances in Deep Neural Networks (DNNs)
made holistic approaches regarding the training
and responsibility of the final network possible.
Pix2code (Beltramelli, 2018) seems to be one of the
earliest works and served as inspiration for other au-
thors (Chen et al., 2018). They divide their approach
into three subproblems: (1) scene understanding, by
inferring the properties of the elements in an image,
(2) language modeling, in order to generate syntacti-
cally and semantically correct code, and (3) final ag-
gregation, relating detected objects with their respec-
tive code. The solution is a model composed of Con-
volutional Neural Networks (CNNs) and Long-Short
Term Memory (LSTMs), which convert images to in-
termediate representations. The work done by Zhi-
hao et al. (Zhu et al., 2018) improves previous works
by removing the need to feed the network with initial
context, thus creating a complete end-to-end model.
2.3 Object Detection Methodologies
Object detectors focus on extracting the bounding
boxes of elements in a given image. Suleri et al. (Su-
leri et al., 2019) describe a sketch-based prototyp-
ing workbench that works in three levels of fidelities:
low, medium, and high. The user can interact with
each particular level by (1) tweaking the mockup or
its interactions, (2) monitoring the conversion process
from drawings to detection, possibly labeling unde-
tected elements, and (3) applying themes and gener-
ating the target code. Yun et al. (Yun et al., 2019b)
make use of the popular YOLO (Redmon et al., 2017)
detection system to recognize the elements presented
in a mockup, by resorting to a custom annotation
language that improves the identification of the el-
ement’s type. Kim et al. (Kim et al., 2018a) use
Faster R-CNN (Redmon et al., 2017) to detect the
elements, and add a step for layout detection by re-
sorting to a slope filtering technique that avoids non-
horizontal/vertical lines.
2.4 Data Driven Methodologies
Moran et al. (Moran et al., 2018) explore the usage
of hierarchy already present in known UIs, based on
the premise that the designer intends to create some-
thing that already exists. Their strategy is divided into
3 phases: detection, classification, and assembly. De-
tection uses traditional computer vision techniques to
extract the location of the elements. Classification re-
lies on elements’ locations to classify them by using
a previously-trained CNN on a real-world examples
dataset. The assembly phase uses a KNN algorithm
to compare the current elements to existing apps to
map the detected elements to real-world examples.
2.5 Synthetic Generators
Previous work in generating synthetic mockups in-
cludes the already mentioned Suleri et al. (Suleri
et al., 2019). To train their model, they crafted a syn-
thetic dataset from real hand-drawings by collecting
hand-drawn sketches of different elements, and sub-
sequently sampling the collected UI elements and ran-
domly positioning them to form the final layout.
Other authors working in different domains are
attempting to solve the same fundamental problems.
Masi et al. (Masi et al., 2016) question the necessity
of acquiring faces for effective face recognition, with
their work modifying an existing dataset to supple-
ment it with facial variations; their results show that
such synthesis leads to an increase in recognition ac-
curacy. Kar et al. (Kar et al., 2019) propose a 3D
engine capable of rendering the scene and additional
masks without the need for extra steps. They de-
veloped a DNN capable of procedural generation of
scenes, by first analyzing real images to learn how to
generate synthetic scenes with similar distributions.
Automatically Generating Websites from Hand-drawn Mockups
49

The presented methodology evidences content gener-
ation improvements when comparing to the respective
baseline. And Bernardino et al. (Bernardino et al.,
2018) show how the generation of a synthetic image
dataset based on a 3D human-body model simulat-
ing knee injury recovering patients can be used to
improve the performance of DNNs designed for go-
niometry. The model’s robustness to noise and varied
backgrounds, typical of mobile-phone pictures taken
in rehabilitation clinics, is of particular interest.
3 FROM MOCKUPS TO CODE
Our approach consists of a four-step pipeline that re-
ceives an image as input and outputs the generated
website in real-time. The four steps are the following:
(1) image acquisition and pre-processing, (2) object
and container detection, (3) building the object hier-
archy, and (4) HTML-code generation, using a CSS-
grid, which better suits our hierarchy approach when
compared to the usual linear layouts. Figure 1 con-
tains a summary of this process.
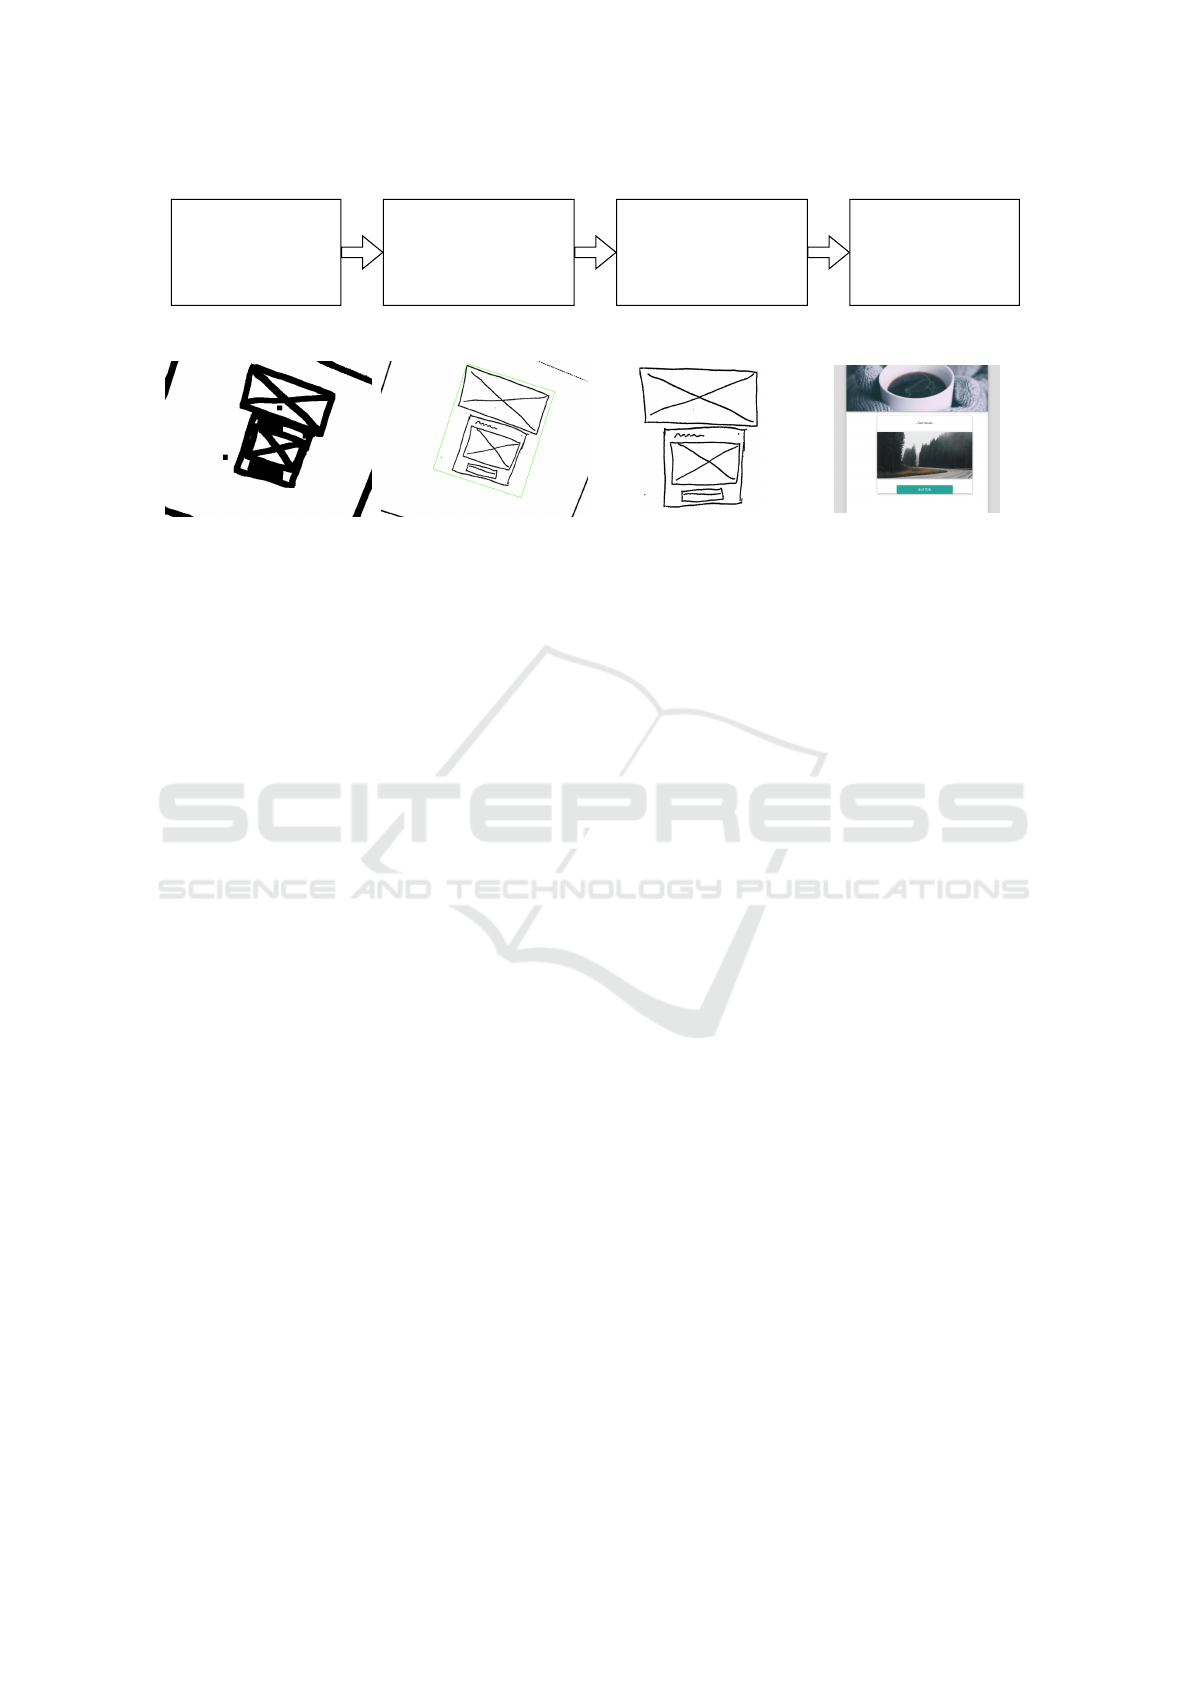
3.1 Image Acquisition
Acquiring real-world images is subject to internal and
external factors. Internal factors include those such as
the quality of the sensor used by the camera and the
lenses used. External factors are the weather, amount,
and quality of light and surface texture and reflection.
The main goal of this step is to filter such anomalies
and convert the original image to a high contrast ver-
sion. The reason behind this approach is directly con-
nected to the detection phase, where DNNs are trained
using high contrast images. A popular alternative is to
resort to data augmentation techniques during learn-
ing that synthetically emulate real-world artifacts.
Here, we first convert the image to black and white
and then apply an adaptive threshold to define the
lines of the mockup where the illumination is irregu-
lar better. This results in a high contrast image, which
can still have some noise. We proceed with two mor-
phological operations using a structuring element in
the shape of an ellipse: closing and erosion. The
adaptive threshold and structuring element parame-
ters are fully configurable in run-time to fine-tune the
final result. Figure 2 illustrates these steps.
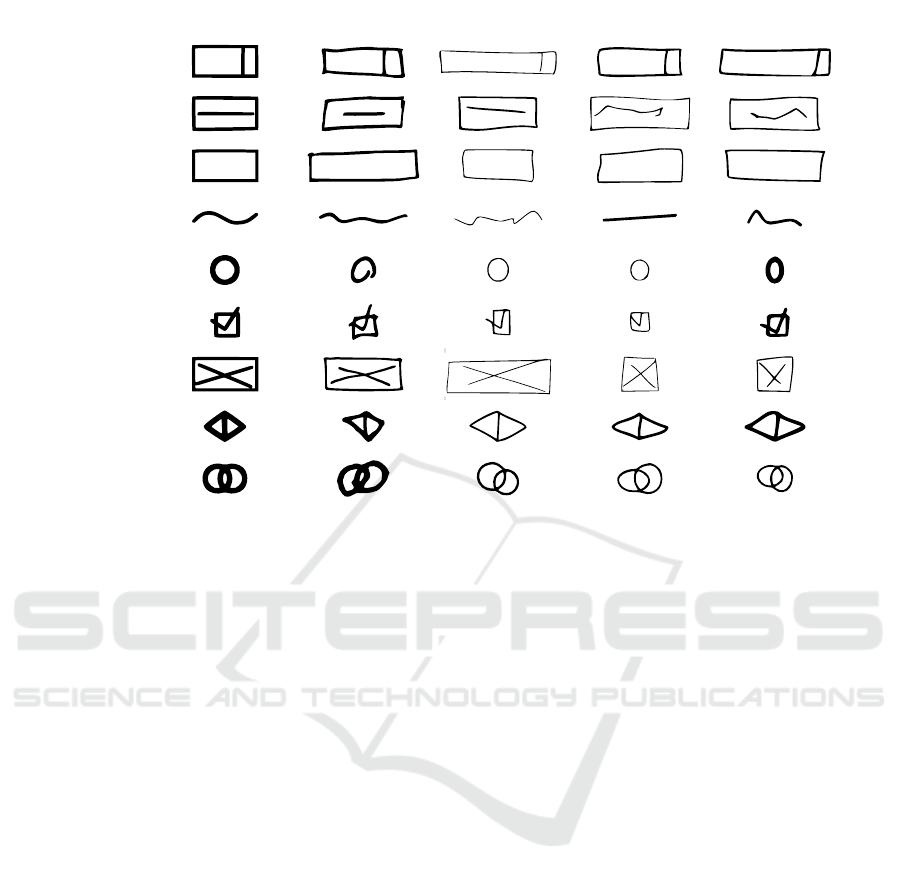
3.2 Element Detection
This two-module phase is responsible for the detec-
tion of the different elements presented on the sketch,
each one expecting to receive an image and return
the detected elements: (a) a module responsible for
the detection of each atomic element, and (b) a mod-
ule responsible for the extraction of containers, where
containers are defined by a box including atomic ele-
ments such as buttons or text elements. Examples of
atomic elements can be found in Figure 3.
For the detection of elements, we used YOLO,
by training it with two different datasets: First, we
used a mockup generator tool which only generates
high contrast mockups with their respective labels
(N=8400, Epochs=400). Then, we fine-tuned it using
real hand-drawn images (N=107, Epochs=100). The
final output of this module is a list of the elements
detected, including their class and bounding boxes.
For the extraction of the containers, Pix2Pix and
YOLO were used together to extract their bounding
box information better. Pix2Pix is based on condi-
tional adversarial networks and provides a general-
purpose solution to output an image when given an
image as input. We used its ability and trained it to
generate figures with just containers. Then, we fed
the resulting image to YOLO so it could extract the
bounding boxes. Both models were trained using the
same amount of data and epochs of the previous mod-
ule, as well as applying the same fine-tuning process.
The training loss values for the element and container
detection models can be consulted as supplementary
material. The output of both modules was concate-
nated, resulting in a container and element list, and
their classes and bounding boxes.
3.3 Element Pre-processing
The previous steps have produced a single flat list
without any hierarchy. We now execute several mod-
ules in sequence to extract hierarchical information,
with the first operation being the merge between el-
ements and containers. This merge is done lin-
early, where the intersection of each element is tested
against containers, and if more than a certain thresh-
old is met, it is considered inside it. We proceed
through each container and assign them with anno-
tation meta-data. These annotations are small sym-
bols that can be used to rapidly modify properties of
the containers, providing richer interactions using the
same drawing as a base.
Checkboxes and radio buttons are also commonly
placed next to lines of text, so we now compare the
horizontal collisions with nearby text-blocks. Each
checkbox uses its bounding box and expands it hor-
izontally. If a textbox is detected, then a small hori-
zontal container is created with the type of the main
element (in this case, checkbox), and both elements
are aggregated. This step continues until all check-
VISAPP 2021 - 16th International Conference on Computer Vision Theory and Applications
50
Adaptive Threshold
Morphologic Close
Morphologic Erode
[Rotation Detection]
YOLO (Elements)
Pix2Pix + YOLO (Containers)
Merge Component Association
Input & Text Merge
Vertical List creation
Horizontal List creation
HTML Code Generation
Image Acquisition Element Detection Element Pre-Processing Code Generation
Figure 1: Pipeline processing steps executed sequentially.
(a) (b)
(c)
(d)
Figure 2: Image Acquisition Process and Final Result executed in sequential order: (a) The resulting image from the adaptive
threshold and morphological operations, (b) Small area rectangle detection, (c) Mockup cropped and rotation corrected, and
after several steps, (d) Generated website.
boxes/radio buttons are processed.
Web pages also tend to organize their contents
in lists, so sequences of elements of the same kind
are list-aggregated. First, all elements are evaluated
against their type by expanding their bounding boxes
vertically. If the box intersects with another object of
the same type, it is selected as a candidate for the list.
We proceed to check if anything is in between the cur-
rent object (used to search for similar objects) and the
newly acquired object. If nothing is, then the element
is stored, and all the collected elements are stored in
a horizontal container with the type of the inserted
elements. The same procedure is then applied hori-
zontally.
The final step is the aggregation of all elements
to generate a more concise hierarchy. We propose
a Hierarchy Reconstruction Algorithm, which main
idea is that, at any point, a container may be subdi-
vided into horizontal or vertical layouts. The algo-
rithm starts with the root container, which has all the
elements and subgroups up until this point. Then, we
attempt to separate the elements in a given orientation
(horizontal or vertical). When testing a given orienta-
tion, the elements are sorted accordingly.
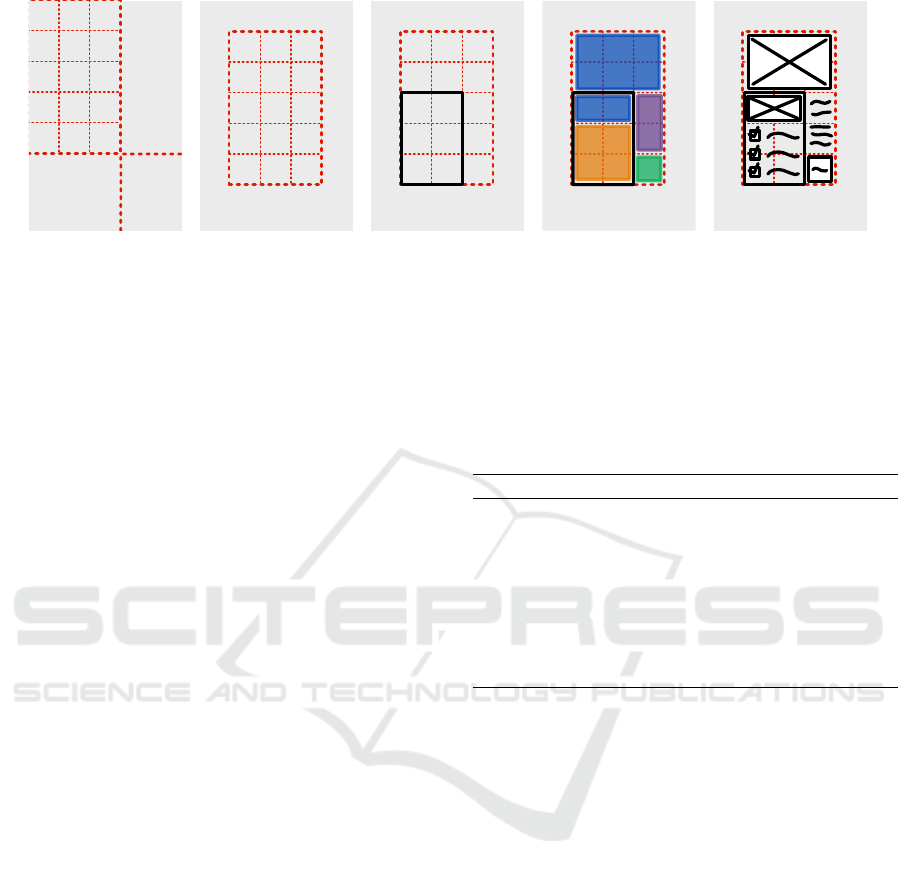
For example, consider the layout depicted in Fig-
ure 5; let’s assume the expanding orientation is verti-
cal. After the elements are sorted vertically, the first
one is selected as a starting point; then, a testing box is
created to identify elements that relate to the starting
object. The testing box has the dimensions of the con-
tainer’s and the object’s bounds (Figure 5b). Since the
expansion is vertical, the box that is created has a hor-
izontal dimension equal to the container’s boundaries,
and a vertical dimension equals to the selected object.
With the testing box in place, the remaining children
of the container are tested; in the case where they fit
this box, it is updated to accommodate the newly in-
serted elements. This behavior repeats until an object
fails to overlap with the box (Figure 5c). Should this
happen, the result is added to a list. In case the num-
ber of elements inside of the box is one, then only the
item is added; otherwise, a new container is created
and all the elements inside the box are added to this
container as children. The algorithm then repeats un-
til all the container’s elements are added to their own
list (Figure 5d). The result of this algorithm is always
a list of elements.
Should the resulting list contain only one object,
it is considered not to be possible to separate the ele-
ments in that given direction, and thus the alternative
is tested. In the case where elements cannot be sepa-
rated in any direction, then this container is marked as
a grid, and the execution continues. This algorithm is
then applied to each container child with the opposite
orientation (Figure 5e).
The result is a hierarchy where the elements are
associated with their respective containers and are or-
ganized as horizontal and vertical lists.
3.4 Code Generation
With the final hierarchy, all is ready to feed into the
HTML/CSS generators. Our generator uses contain-
ers and their previously attached attributes to apply
custom CSS tags, thus changing the style of said el-
ement. To generate the HTML, the hierarchy is iter-
ated in a depth-first fashion, with each element being
translated to a corresponding HTML component. For
containers that are not represented as lists, they are
marked as a CSS-grid. Their children use the rela-
Automatically Generating Websites from Hand-drawn Mockups
51
Text Block
Button
Text Field
Radio Button
Checkbox
Picture
Dropdown
Annotation A
Annotation B
Symbol Hand-Drawn Generated Generated Generated
Figure 3: Left-to-right, examples of (1) atomic elements, (2) hand-drawn elements, and (3) (4) (5) generated specimens used
in our work. The morphological variety of the synthetic elements is produced by us, using an algorithm soon to be published.
tive position and size to define the location inside the
grid. The default value of grid cells in the horizon-
tal space is arbitrarily defined as 8; the vertical space
is calculated by comparing the width of the cell and
using this value for calculating the number of cells in
the vertical axis. Containers that are tagged as hori-
zontal or vertical lists do not need this snapping step
and thus are generated sequentially. The final result is
displayed in real-time in a browser window. Figure 7
provides examples of the result.
3.5 Synthetic Mockups
Most steps in this pipeline are based on machine
learning models, which, to be trained, need a var-
ied and large number of examples. Drawing them by
hand was too time consuming and not a viable option;
so a process to automatically generate an extensive set
of hand-drawn-like mockups was needed. Our solu-
tion is described in the next few sections.
We can think of webpages as being composed of
two kinds of elements: (1) the atomic elements, such
as buttons, text fields, and radio buttons, and (2) con-
tainers, which encapsulate said components into
semantically and structurally meaningful groups. Our
solution takes both concepts into account. Although
we present results for a single layer of containers, this
procedure can be recursively applied to allow contain-
ers inside other containers. Our process for mockup
generation is sequential and organized in the
following steps, depicted in Figure 6.
3.5.1 Boundaries Calculation
Let there be a canvas of width and height. To select
the mockup bounding box, we draw the cell size and
cell gap values from a random bounds distribution.
The canvas is subsequently divided, horizontally and
vertically, by the grid size and gap. The remaining
space is regarded as margins, used for placement off-
set equally chosen at random (Figure 6b). This step
enables the division of the mockup into several cells
where we can later place components.
3.5.2 Container Placement
As containers are used to semantically and struc-
turally group different elements together, their area is
assumed to be higher than a single cell. Previously
calculated cells are used to displace the containers
over the grid, incidentally simplifying the later place-
ment of atomic elements. We then go through it from
top-left to bottom-right. For each unoccupied cell,
random values are drawn for the horizontal and ver-
tical expansion values of the element (i.e., number of
cells), taking into account the remaining space avail-
able to preserve established boundaries. The next step
checks the neighboring areas for overlapping contain-
ers (cells already in use). For each cell visited, the
VISAPP 2021 - 16th International Conference on Computer Vision Theory and Applications
52
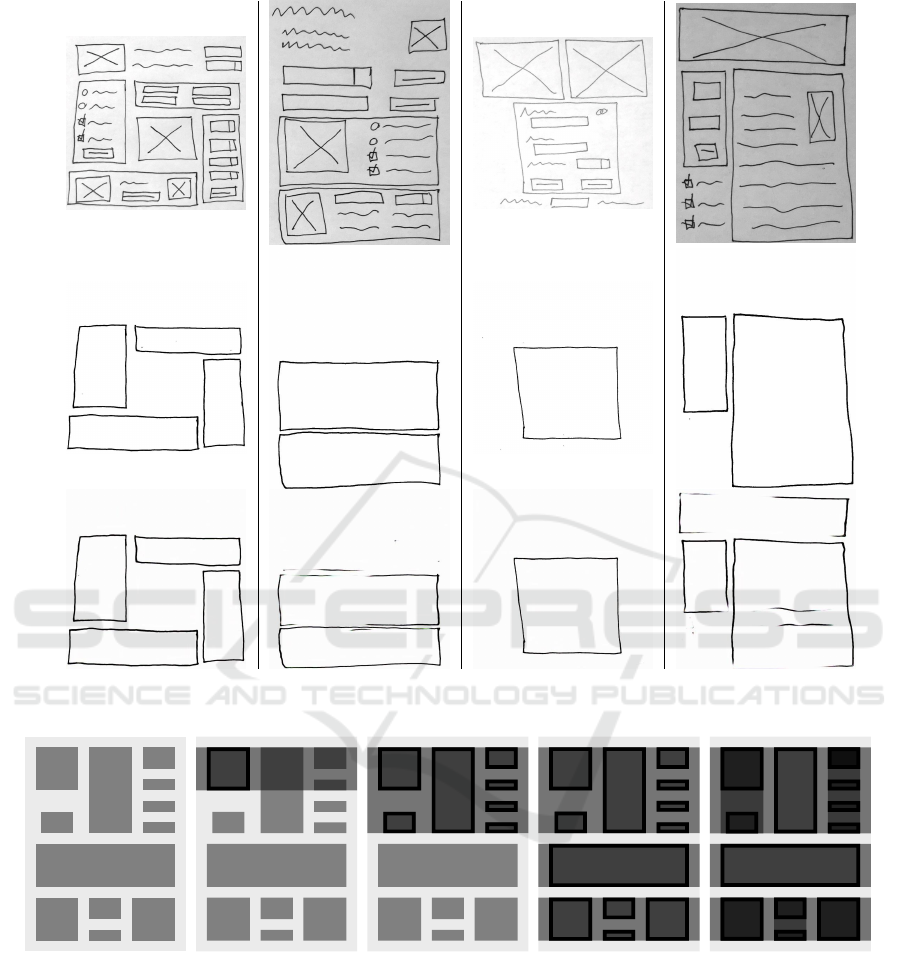
a)
b)
c)
Figure 4: Four examples of container segmentation/extraction produced by Pix2pix: (a) the input image, (b) the ground truth,
and (c) the output result.
(a)
(b) (c)
(d)
(e)
Figure 5: Hierarchy Generation Algorithm: (a) Original hierarchy, (b) First element selected and Testing Box expanded
horizontally, (c) Testing Box expanded to Accommodate all elements, (d) Process repeated for the remaining elements, and
(e) Process applied to the generated sub-containers vertically.
boundary is updated; in case neighbors are detected,
the container stops its expansion, and the previous
boundary is used. Finally, the candidate boundary
is evaluated and discarded if it does not meet the re-
quirements (here, an area greater than two). At the
end of this process, the containers are considered de-
fined and ready to be filled with elements. Figure 6c
depicts the results so far.
3.5.3 Element Area Definition
The procedure to fill the cells with the elements fol-
lows a process similar to that of the containers. The
only difference is that the container’s area is taken into
account.
At the end of the previous step, all cells are as-
sociated with the container they belong to by tagging
Automatically Generating Websites from Hand-drawn Mockups
53
Width
Leftover X
Leftover Y
Height
(a)
Width
Height
(x,y)
Mockup
(b)
Width
Height
(x,y)
Mockup
(c)
Width
Height
(x,y)
Mockup
Picture
Picture
Text
Button
Checkbox
(d)
Width
Height
(x,y)
Mockup
(e)
Figure 6: High-level overview of our approach, executed in a sequential order: (a) Mockup dimension and leftover calculation,
(b) Mockup translation, (c) Container placement, (d) Element area definition, and (e) Element placement.
them with an ID. In this step we apply the same ratio-
nale to generate new random values and expand ele-
ments horizontally or vertically. For each cell inside
the bounds, a check is made to collect cells that match
the container ID and are empty. In case of a possible
collision, which can occur if (1) a cell belongs to a
different container, or (2) a cell is already occupied,
the algorithm stops and uses the previous available
coordinates as the bound limit. This enables the def-
inition of multiple areas representing different kinds
of elements, which will be later expanded to fill their
respective bounds. The result of this phase is repre-
sented in Figure 6d.
3.5.4 Element Placement
As the grid is already populated with containers and
areas representing the kind of element which must be
placed into, this step is responsible for filling said ar-
eas, depending on multiple parameters that were de-
fined to determine the filling behavior of each area.
For elements such as images, only one element is
added to that area with the same size as the specified
bounds. With small and/or grouped elements such
as checkboxes, it makes sense to limit its shape size
to a semantically natural one. So instead of filling
the whole area with a giant checkbox, we use it to
place multiple checkboxes representing them as ver-
tical lists.
Defining the placement of these lists is similar to
the way the mockup boundaries are calculated. Each
element has a random target height that falls within
a pre-specified bound. Given the list item height, the
full area height is used to calculate the number of el-
ements that the list could fit and the remaining mar-
gin. Once this margin is calculated, the whole list is
displaced by a random factor of said margin, and the
items are created. In the case of buttons, this opera-
tion is straightforward. But in the case of checkboxes
or radio buttons, since each of these items usually has
Table 1: Element’s fill parameters. The expansion column
represents if the element will expand vertically, horizontally
or both. The split value indicates if expansion would be
done by enlarging or creating new elements (in the given
direction). The height contains the intervals used to define
the element’s size. Finally, we also provide an option to fill
the remaining horizontal space with text.
Element Expansion Split Height Text
Picture both none none
Radio But-
ton
vertical vertical [40;50] •
Checkbox vertical vertical [40;50] •
Dropdown horizontal vertical [40;70]
Text field horizontal vertical [40;70]
Text block both vertical [40;70]
Button both vertical [40;70]
the aspect ratio of 1:1, a highly unoccupied horizontal
space can exist. To enrich these elements another pa-
rameter is considered that lets the generator place text
over the unused horizontal space. This creates a more
natural way of defining lists, where each checkbox
is placed near a text description. Table 1 contains the
rules used to fill the area of a given element. Figure 6e
represents the results of element expansion, namely in
the areas belonging to texts and checkboxes.
3.5.5 Elements Drawing Process
Once in this phase, the grid is filled with different el-
ements, which contain the bounding boxes that define
their areas. Would the elements be drawn as currently
set, the result would be perfectly straight lines which
are not expected from hand-drawn mockups. To add
more variety and make them closer to what a human
would sketch, we make further adjustments to the ge-
ometry that dictates the final shape of each element.
We currently apply two types of adjustments.
First, we offset each vertices comprising the element
shape by a random value, which creates the possibil-
ity of non-parallel lines. As a side effect of this op-
VISAPP 2021 - 16th International Conference on Computer Vision Theory and Applications
54

eration, there’s a probability that the element might
look slightly rotated. Then, we target the unintended
uniformity when drawing an edge. We preserve the
original ends while adding multiple points positioned
randomly along the line, thus creating distortions in
the final drawing. We further make usage of bowing,
roughness, brush size, and other drawing strategies
that simulate the distinct styles of different drawing
instruments such as sharpies, pens, or pencils.
Figure 3 provides several examples of this step
when applied to different elements, such as buttons,
text fields, and checkboxes, and compares them to
hand-drawn sketches.
4 EVALUATION
To assess our approach, we prioritized the evaluation
of the detection phase by measuring the mean aver-
age precision (mAP) and the log-average miss rate
(LAMR), as both elements are useful to evaluate the
overall performance in the object detection task (Ren
et al., 2017; Redmon et al., 2016; Girshick et al.,
2014; Suleri et al., 2019; Razavian et al., 2014; Wo-
jek et al., 2011; Zhao et al., 2018). The mean aver-
age precision plots the precision and recall curves for
each class and then proceeds to calculate a simplified
area. The mean of every area calculated is then taken
into account to compute the final mAP score. The
LAMR is defined by averaging the miss rates, where
miss rate is defined as MR = FN/(T P + FN) as pro-
posed by Wojek at al. (Wojek et al., 2011) to evaluate
and compare the performance stably.
The detection phase is comprised of the element
and container detection steps. The container detec-
tion phase, as mentioned before, is composed of two
models executed in sequence, starting with Pix2Pix
and ending with YOLO. This phase was evaluated as a
whole, thus reflecting the interactions and final results
from these models. The results of mAP and LAMR
can be consulted in Table 2. As the real-time con-
straint is paramount to our work, the execution time
of the whole system was also evaluated in very mod-
est commodity hardware (see Table 3).
5 RESULTS AND DISCUSSION
The detection performance of our approach achieved
a mAP score of 95.37%, which shows overall good
element detection. The LAMR of some compo-
nents, such as checkboxes and annotation elements,
still needs further work. We have also observed that
the container phase is the most critical to obtain
good (hierarchically sound) results. Future improve-
ments of this system should focus on reducing the
false positives, which could easily be attenuated with
longer training and a larger dataset. Earlier during
our research, we experimented with U-NET to isolate
containers, but the network could not generalize well,
probably due to the thin size of the container lines.
The usage of Pix2Pix model improved the results sub-
stantially, but at the cost of execution performance. In
fact, the container detection phase has the highest
impact in execution time, accounting for 98% of the
total work on average. However, in 90% of the cases
we tested (N=107), the process was executed entirely
(from image acquisition to HTML generation) in less
than 414ms using our hardware. It should be noted
that the final system is sensitive to camera perspec-
tive, which can result in wrongly-rotated images and
misaligned boundaries. This can be solved either by
resorting to added modules during pre-processing, or
data-augmentation techniques during learning. Fortu-
nately, our real-time approach allows the designer to
correct these cases quickly. There is enough evidence
that our approach improves the result of object de-
tection using current state-of-the-art techniques (here
YOLO), by augmenting a hand-drawn dataset using
synthetically generated mockups.
The results from boosting our system with syn-
thetic datasets are also considerably better when
compared to the baseline, highlighting an overall
better mAP (95.3%) and log-average miss rate in ev-
ery element evaluated. The false positives are also
significantly lower when compared to the other two
models, and there’s also an increase in the true pos-
itives. We show that the difference in performance
cannot be attributed to the sheer size of the train-
ing data, as the mAP of these models is extremely
close (59.7% vs 60.5%).
6 CONCLUSIONS
Designers often use physical hand-drawn mockups
to convey their ideas to stakeholders. In this paper,
we proposed a multi-stage pipelined solution mixing
heuristics and machine learning approaches to pro-
duce a real-time system that generates HTML/CSS
from human-made sketches.
Our solution has the object detection phase at the
heart of the pipeline. Even though some errors/misses
might occur in the detection phase, the detected ele-
ments can still be placed according to the detected lo-
cation, something that pure end-to-end models strug-
gle with, and usually produce strange hierarchies. Our
pipeline architecture also has the advantage of identi-
Automatically Generating Websites from Hand-drawn Mockups
55

Input Generated Input Generated
Figure 7: Example of results produced from our approach. The left column contains the captured image without any pre-
processing, and using a mobile-phone camera. The right column presents the generated HTML rendered using the Chrome
browser.
fying and checking the progress of the inferred hier-
archy, while allowing new strategies to be plugged in.
The possible downside is that different models need
to be trained individually, which can lead to longer
training times and may be difficult to tweak if models
are dependent on each other. We, however, are priori-
tizing real-time performance.
The use of a CSS-grid greatly simplifies the hi-
erarchy generations, making possible layouts tricky
to produce using linear structures. The detection of
lists and aggregation of checkboxes/radio buttons to
text blocks also improved the final alignment of the
generated web pages. This phase still has plenty of
room for exploration, particularly in the definition of
VISAPP 2021 - 16th International Conference on Computer Vision Theory and Applications
56

Table 2: Detection Results. From left-to-right, we have training using only hand-drawn examples, only synthetic examples,
and with our final approach. For each one, Ground-truth represents the absolute number of elements that exist on the validation
dataset. False positives indicate the number of miss detections wrongly classified as the target class. True positives are the
correct classifications where a match is present in the dataset. The overall mAP score is 94.6%.
Hand-Drawn Synthetic Final
Class FP TP AP (%) LAMR FP TP AP (%) LAMR FP TP AP (%) LAMR GT
TextBlock 24 308 86 0.48 42 231 61 0.78 3 334 97 0.06 345
Picture 6 88 86 0.20 2 84 82 0.19 0 99 97 0.03 102
Button 10 80 83 0.34 76 88 61 0.83 2 92 98 0.05 93
Textfield 21 57 69 0.57 0 15 21 0.79 1 70 97 0.03 72
Checkbox 8 36 43 0.78 12 58 68 0.63 3 64 88 0.20 72
Dropdown 13 42 65 0.49 0 28 47 0.53 2 58 97 0.04 60
RadioButton 6 37 66 0.50 0 42 78 0.22 0 53 98 0.02 54
Component 6 4 86 0.20 0 2 22 0.78 1 8 86 0.20 9
Table 3: Execution times (in milliseconds) of 107 runs on a
NVidia GTX 970 and i7 3770k@4.1GHz, using Tensorflow
1.8.0. We provide the mean and the 90
th
percentile.
Phase Mean (ms) 90
th
P (ms)
Detection (Elements) 120 90
Detection (Containers) 310 276
Detection (Total) 430 275
Processing 3 1
Generation 4 5
Total 438 414
the final hierarchy. Inferring the intended web site
hierarchy may be akin to understand its semantics,
and as such, is a difficult problem. Using models
trained with real-world hierarchical information may
improve this step.
We also describe an algorithmic approach to the
generation of arbitrarily large datasets of labeled syn-
thetic mockups that are able to mimic hand-drawn
sketches. This was motivated by the necessity training
Deep Neural Networks that can generalize well, thus
providing them with good candidates that have exact,
high-quality annotations. The particular improvement
of this step is independently evaluated, achieving a
mAP score ≈1.5× higher than training using only
hand-drawn mockups.
Overall, our approach achieves good results, with
the highest mAP score of 94.6% taking just 414ms
from end-to-end generation, translating to ≈2 frames-
per-second using a modest 2014-era graphics card.
REFERENCES
Aguiar, A., Restivo, A., Correia, F. F., Ferreira, H. S., and
Dias, J. P. (2019). Live software development — tight-
ening the feedback loops. In Proceedings of the 5th
Programming Experience (PX) Workshop.
Beltramelli, T. (2018). Pix2Code: Generating Code from a
Graphical User Interface Screenshot. In Proceedings
of the ACM SIGCHI Symposium on Engineering In-
teractive Computing Systems, EICS ’18, pages 3:1—-
3:6, New York, NY, USA. ACM.
Bernardino, J., Teixeira, L. F., and Ferreira, H. S.
(2018). Bio-measurements estimation and support
in knee recovery through machine learning. CoRR,
abs/1807.07521.
Chen, C., Su, T., Meng, G., Xing, Z., and Liu, Y. (2018).
From UI Design Image to GUI Skeleton: A Neural
Machine Translator to Bootstrap Mobile GUI Imple-
mentation. In Proceedings of the 40th International
Conference on Software Engineering, ICSE ’18, pages
665–676, New York, NY, USA. ACM.
Eco, U. et al. (1976). A theory of semiotics, volume 217.
Indiana University Press.
Ellis, K., Ritchie, D., Solar-Lezama, A., and Tenenbaum,
J. (2018). Learning to infer graphics programs from
hand-drawn images. In Bengio, S., Wallach, H.,
Larochelle, H., Grauman, K., Cesa-Bianchi, N., and
Garnett, R., editors, Advances in Neural Information
Processing Systems 31, pages 6059–6068. Curran As-
sociates, Inc.
Girshick, R. B., Donahue, J., Darrell, T., and Malik, J.
(2014). Rich Feature Hierarchies for Accurate Object
Detection and Semantic Segmentation. 2014 IEEE
Conference on Computer Vision and Pattern Recog-
nition, pages 580–587.
Hassan, S., Arya, M., Bhardwaj, U., and Kole, S. (2018).
Extraction and Classification of User Interface Com-
ponents from an Image. International Journal of Pure
and Applied Mathematics, 118(24):1–16.
Huang, R., Long, Y., and Chen, X. (2016). Automaticly
generating web page from a mockup. Proceedings of
the International Conference on Software Engineering
and Knowledge Engineering, SEKE, 2016-Janua.
Kar, A., Prakash, A., Liu, M.-Y., Cameracci, E., Yuan, J.,
Rusiniak, M., Acuna, D., Torralba, A., and Fidler, S.
Automatically Generating Websites from Hand-drawn Mockups
57

(2019). Meta-Sim: Learning to Generate Synthetic
Datasets.
Karpathy, A. and Fei-Fei, L. (2015). Deep visual-semantic
alignments for generating image descriptions. In 2015
IEEE Conference on Computer Vision and Pattern
Recognition (CVPR), pages 3128–3137. IEEE.
Kim, B., Park, S., Won, T., Heo, J., and Kim, B. (2018a).
Deep-learning based web UI automatic programming.
In Proceedings of the 2018 Conference on Research in
Adaptive and Convergent Systems - RACS ’18, pages
64–65, New York, New York, USA. ACM Press.
Kim, S., Park, J., Jung, J., Eun, S., Yun, Y.-S., So, S., Kim,
B., Min, H., and Heo, J. (2018b). Identifying UI wid-
gets of mobile applications from sketch images. Jour-
nal of Engineering and Applied Sciences, 13(6):1561–
1566.
Landay, J. a. (1995). Interactive sketching for user interface
design. Conference companion on Human factors in
computing systems - CHI ’95, pages 63–64.
Masi, I., Tran, A. T., Leksut, J. T., Hassner, T., and Medioni,
G. (2016). Do We Really Need to Collect Millions of
Faces for Effective Face Recognition?
Moran, K. P., Bernal-Cardenas, C., Curcio, M., Bonett, R.,
and Poshyvanyk, D. (2018). Machine Learning-Based
Prototyping of Graphical User Interfaces for Mobile
Apps. IEEE Transactions on Software Engineering,
5589(May):1–26.
Nguyen, T. A. and Csallner, C. (2015). Reverse Engineering
Mobile Application User Interfaces with REMAUI
(T). In 2015 30th IEEE/ACM International Con-
ference on Automated Software Engineering (ASE),
pages 248–259.
Razavian, A. S., Azizpour, H., Sullivan, J., and Carlsson, S.
(2014). CNN Features Off-the-Shelf: An Astounding
Baseline for Recognition. In 2014 IEEE Conference
on Computer Vision and Pattern Recognition Work-
shops, pages 512–519. IEEE.
Redmon, J., Divvala, S., Girshick, R., and Farhadi, A.
(2016). You Only Look Once: Unified, Real-Time
Object Detection. In 2016 IEEE Conference on Com-
puter Vision and Pattern Recognition (CVPR), pages
779–788. IEEE.
Redmon, J. U. o. W., Divvala, S. A. I. f. A. I., Girshick, R. F.
A. R., and Farhadi, A. U. o. W. (2017). You Only Look
Once: Unified, Real-Time Object Detection. Annals
of Emergency Medicine, 70(4):S40.
Ren, S., He, K., Girshick, R., and Sun, J. (2017). Faster R-
CNN: Towards Real-Time Object Detection with Re-
gion Proposal Networks. IEEE Transactions on Pat-
tern Analysis and Machine Intelligence, 39(6):1137–
1149.
Suleri, S., Sermuga Pandian, V. P., Shishkovets, S., and
Jarke, M. (2019). Eve. In Extended Abstracts of the
2019 CHI Conference on Human Factors in Comput-
ing Systems - CHI EA ’19, pages 1–6, New York, New
York, USA. ACM Press.
Weichbroth, P. and Sikorski, M. (2015). User Interface
Prototyping. Techniques, Methods and Tools. Studia
Ekonomiczne. Zeszyty Naukowe Uniwersytetu Eko-
nomicznego w Katowicach, 234:184–198.
Wojek, C., Schiele, B., Perona, P., and Doll, P. (2011).
Pedestrian Detection : An Evaluation of the State of
the Art.
You, Q., Jin, H., Wang, Z., Fang, C., and Luo, J. (2016).
Image Captioning with Semantic Attention. In 2016
IEEE Conference on Computer Vision and Pattern
Recognition (CVPR), pages 4651–4659. IEEE.
Yun, Y.-S., Jung, J., Eun, S., So, S.-S., and Heo, J. (2019a).
Detection of gui elements on sketch images using
object detector based on deep neural networks. In
Hwang, S. O., Tan, S. Y., and Bien, F., editors, Pro-
ceedings of the Sixth International Conference on
Green and Human Information Technology, pages 86–
90, Singapore. Springer Singapore.
Yun, Y.-S., Jung, J., Eun, S., So, S.-S., and Heo, J. (2019b).
Detection of GUI Elements on Sketch Images Us-
ing Object Detector Based on Deep Neural Networks.
In Hwang, S. O., Tan, S. Y., and Bien, F., editors,
Proceedings of the Sixth International Conference on
Green and Human Information Technology, pages 86–
90, Singapore. Springer Singapore.
Zhao, Z.-Q., Zheng, P., Xu, S.-t., and Wu, X. (2018). Ob-
ject Detection with Deep Learning: A Review. CoRR,
abs/1807.0.
Zhu, Z., Xue, Z., and Yuan, Z. (2018). Automatic Graphics
Program Generation using Attention-Based Hierarchi-
cal Decoder. CoRR, abs/1810.1.
VISAPP 2021 - 16th International Conference on Computer Vision Theory and Applications
58
