
Focus-and-Context Skeleton-based Image Simplification
using Saliency Maps
Jieying Wang
1 a
, Leonardo de Melo Joao
2 b
, Alexandre Falc
˜
ao
2 c
, Ji
ˇ
r
´
ı Kosinka
1 d
and Alexandru Telea
3 e
1
Bernoulli Institute, University of Groningen, 9747 AG Groningen, The Netherlands
2
Department of Information Systems, Institute of Computing, University of Campinas, S
˜
ao Paulo CEP 13083-852, Brazil
3
Department of Information and Computing Sciences, Utrecht University, 3584 CC Utrecht, The Netherlands
Keywords:
Medial Axis, Dense Skeleton, Image Simplification, Saliency Map.
Abstract:
Medial descriptors offer a promising way for representing, simplifying, manipulating, and compressing im-
ages. However, to date, these have been applied in a global manner that is oblivious to salient features. In this
paper, we adapt medial descriptors to use the information provided by saliency maps to selectively simplify
and encode an image while preserving its salient regions. This allows us to improve the trade-off between
compression ratio and image quality as compared to the standard dense-skeleton method while keeping per-
ceptually salient features, in a focus-and-context manner. We show how our method can be combined with
JPEG to increase overall compression rates at the cost of a slightly lower image quality. We demonstrate our
method on a benchmark composed of a broad set of images.
1 INTRODUCTION
Images are one of the most widely present data types
in many application areas in science, engineering, but
also end-user applications. Image compression and
simplification are two closely related techniques in
the toolset of the imaging practitioner: Compression
creates images of a smaller file size for archiving,
transmission, and rendering purposes; lossy compres-
sion achieves this by removing certain image details
(or parts thereof), though typically not in an explicitly
user-controlled manner. Simplification creates images
which keep visual structures of interest to the use-
case at hand, and remove the other, less important,
structures, to ease further analysis and processing of
such images; simplification also achieves image-size
reduction, although as a by-product rather than a key
goal.
Recently, Dense Medial Descriptors (DMDs) have
been proposed as a new way to perform image com-
pression (Wang et al., 2020b). DMDs model an im-
a
https://orcid.org/0000-0002-0085-3551
b
https://orcid.org/0000-0003-4625-7840
c
https://orcid.org/0000-0002-2914-5380
d
https://orcid.org/0000-0002-8859-2586
e
https://orcid.org/0000-0003-0750-0502
age as a collection of luminance threshold-sets, or
layers, each layer being encoded by its medial axis
transform (MAT). DMDs create a simplified versions
of an image by suitably selecting a subset of its lay-
ers and storing simplified (pruned) versions of their
MATs. Qualitative and quantitative evaluation has
shown that DMDs deliver good compression ratios
while preserving image quality. As such, DMDs can
be an interesting and promising option for lossy im-
age encoding. However, DMDs offer so far only a
global way to simplify an image, which does not al-
ways lead to optimal quality, as certain details deemed
important by the user may be simplified away together
with less important details.
In this paper, we extend the DMD method (Wang
et al., 2020b) with a so-called spatial saliency map
that models the importance of various areas in an im-
age. We use this map to control image simplification,
thereby enabling finer-grained spatial control of the
simplification. This makes DMDs suitable for appli-
cations such as focus-and-context compression. We
propose several metrics to gauge the effectiveness of
our method and the trade-off between image size and
perceptual similarity. We evaluate these metrics on
a collection of real-world images to illustrate the ad-
vantages of our extended method.
Wang, J., Joao, L., Falcão, A., Kosinka, J. and Telea, A.
Focus-and-Context Skeleton-based Image Simplification using Saliency Maps.
DOI: 10.5220/0010193400450055
In Proceedings of the 16th International Joint Conference on Computer Vision, Imaging and Computer Graphics Theory and Applications (VISIGRAPP 2021) - Volume 4: VISAPP, pages
45-55
ISBN: 978-989-758-488-6
Copyright
c
2021 by SCITEPRESS – Science and Technology Publications, Lda. All rights reserved
45

The remainder of the paper is organized as fol-
lows. We start with an introduction of the back-
ground in Section 2, including dense medial descrip-
tors, saliency maps, and image quality metrics. Sec-
tion 3 describes our proposed modifications to DMD
method to include saliency-aware image simplifica-
tion. Section 4 details the obtained results. Section 5
discusses our results. Finally, Section 6 concludes the
paper.
2 BACKGROUND
We start by outlining related work regarding (dense)
medial descriptors, saliency maps, and image quality
metrics.
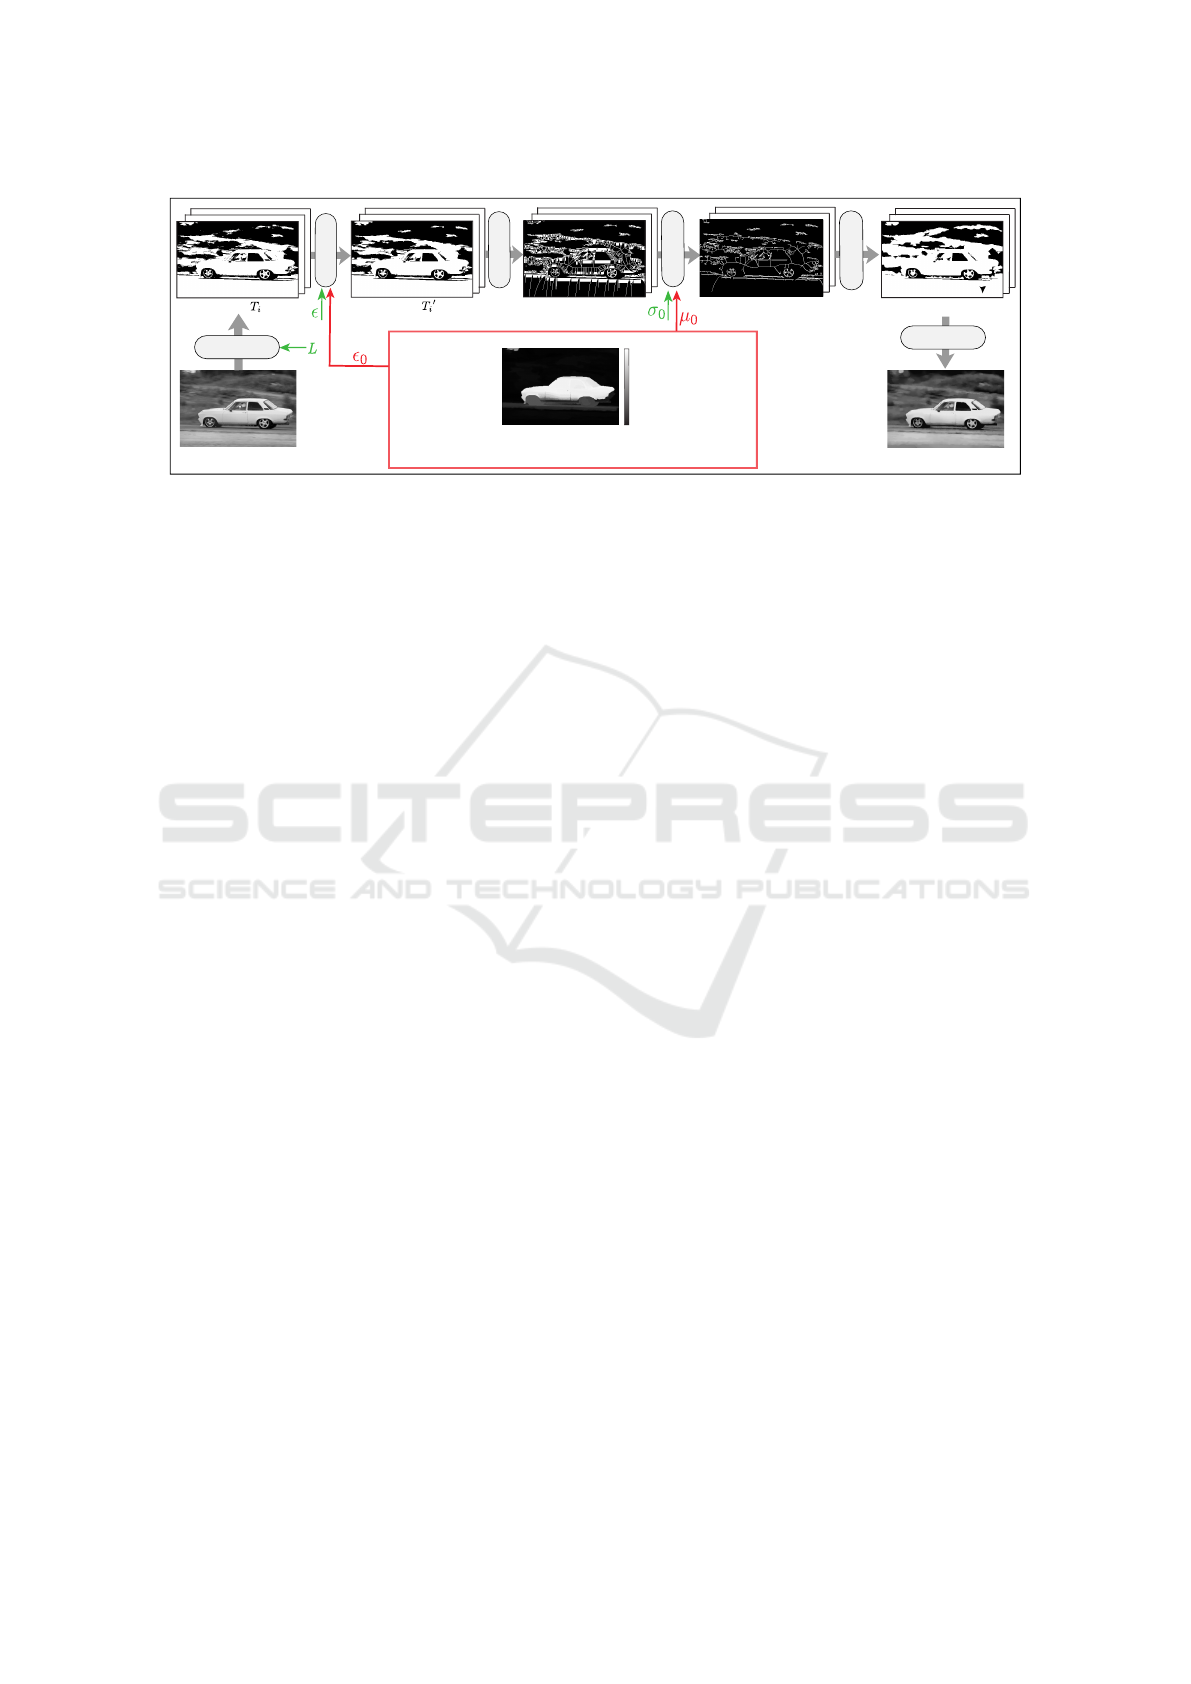
2.1 Dense Medial Descriptors
We first briefly describe the DMD method (Fig. 1).
For full details, we refer to (Wang et al., 2020b). Let
I : R
2
→ [0,255] be an 8-bit grayscale image. All
results next apply to color images too by consider-
ing each of their three channels in e.g. YUV color
space. I is reduced to n = 256 threshold sets or lay-
ers T
i
=
x ∈ R
2
|I(x) ≥ i
,0 ≤ i < n. From these,
a subset of L < n layers is kept, by removing layers
which are very similar to each other, thus contribute
little to describing I. Next, islands (connected compo-
nents in the foreground T
i
or background
¯
T
i
) that are
smaller than a user-given threshold ε, thus contribute
little to the image, are removed. Next, a binary skele-
ton S
i
is extracted from each layer T
i
. Such skeletons
contain spurious branches caused by small perturba-
tions along the boundary ∂T
i
of T
i
. These can be elim-
inated by regularization (Telea and van Wijk, 2002;
Costa and Cesar, 2000; Falc
˜
ao et al., 2004). DMD
uses the so-called salient-skeleton regularization met-
ric (Telea, 2012) which keeps perceptually sharp cor-
ners of ∂T
i
but removes small-scale wiggles along ∂T
i
,
based on a user parameter σ
0
> 0. The parameter σ
0
has a geometric meaning: Setting σ
0
= 0.1 means
removing all wiggles smaller than 10% of the local
object thickness (Telea, 2012). A simplified version
of the image I is finally reconstructed from the reg-
ularized skeletons
˜
S
i
and their distance transforms,
i.e., the simplified medial axis transforms (MATs) of
the selected layers T
i
. The parameter σ
0
controls the
scale of image details to be removed, thereby enabling
applications such as image segmentation (Koehoorn
et al., 2015; Sobiecki et al., 2015; Koehoorn et al.,
2016) and nonphotorealistic image rendering (Zwan
et al., 2013).
However, DMD can only simplify an image glob-
ally. High simplification will easily remove small, but
visually important, details. Conversely, low simplifi-
cation will allocate storage to unimportant image ar-
eas (poor compression). In many cases, users may
want to keep (or remove) same-scale details based on
the context these appear in. Our method, described in
Sec. 3, adapts DMD precisely in this direction, that is,
to use context information to drive the simplification.
2.2 Saliency Maps
Saliency maps µ : R
2
→ [0,1] encode how impor-
tant each image pixel is for a given task or perceptual
standpoint (0 being totally unimportant and 1 being
of maximal importance). Such maps have been used
for image quality assessment (Liu and Heynderickx,
2011), content-based image retrieval (Chen et al.,
2009), context-aware image resizing (Goferman et al.,
2011), image compression (Andrushia and Thangar-
jan, 2018; Z
¨
und et al., 2013), and saliency-based gaze
tracking (Cazzato et al., 2020). They can be computed
by several techniques, as follows.
Supervised methods, especially those using deep
learning, typically outperform unsupervised methods
when enough training images are used (Borji et al.,
2015). Saliency estimators are commonly evaluated
using image segmentation metrics on a thresholded
saliency map, yielding binary saliency with possibly
unnatural values for some regions of a salient ob-
ject. Binary saliency maps are useful for segmenta-
tion; smoother (non-binary) maps allow a more con-
tinuous selection of important vs less important image
areas, as needed in our case (see next Sec. 3).
Unsupervised methods propose heuristics to
model what makes objects salient in a scene. Most
methods start by finding image regions (e.g. super-
pixels) with high color contrast relative to neigh-
bors (Jiang et al., 2013; Li et al., 2013; Zhang et al.,
2018). Besides contrast, objects in focus (Jiang et al.,
2013), near the image center (Cheng et al., 2014),
or having red and yellow tones (important for the
human visual system) (Peng et al., 2016), are likely
salient. Since most image boundaries are background
in natural images, regions similar to the boundary
will have low saliency (Cheng et al., 2014; Zhang
et al., 2018; Li et al., 2013; Jiang et al., 2013). Un-
supervised saliency estimators combine several such
assumptions. In our work, we apply such an un-
supervised bottom-up saliency estimation algorithm,
namely DSR (Li et al., 2013), which provides reliable
saliency maps without requiring parameter tunning,
and in a short amount of time. However, any other
saliency map methods can be directly used instead, in-
VISAPP 2021 - 16th International Conference on Computer Vision Theory and Applications
46
Spatial saliency map μ
Input grayscale image I
Reconstructed image I
~
MAT (DT
i
, S
i
)
Simplified MAT (DT
i
, S
i
)
~
Reconstructed layers T
i
~
2.Denoising
SSDMD method addition
1.Thresholding
1
Layers
Layers
2.Denoising
3.Skeletonization
5.Reconstruction
4.Regularization
6.Composition
0
(unimportant)
(important)
Figure 1: Dense medial descriptor (DMD) pipeline with free parameters in green. Red: Elements added by our SSDMD
method.
cluding manually designed maps, as long as users find
the produced maps suitable for their tasks at hand.
2.3 Image Quality Metrics
A quality metric Q(I,
˜
I) ∈ R
+
measures how per-
ceptually close an image I is to its representation
˜
I.
Such metrics include the mean squared error (MSE)
and peak signal-to-noise ratio (PSNR). While simple
to compute and with clear physical meanings, these
do not match well perceived visual quality (Wang
and Bovik, 2009; Zhang et al., 2011; Zhang et al.,
2012). We illustrate this in the supplementary ma-
terial (Wang et al., 2020a). The structural similar-
ity (SSIM) index (Wang et al., 2004) alleviates this
by measuring, pixel-wise, how similar two images
are by considering human perception. Mean SSIM
(MSSIM) aggregates SSIM to a scalar value by aver-
aging over all image pixels. MSSIM was extended
to three-component SSIM (3-SSIM) by using non-
uniform weights for the SSIM map over three region
types: edges, texture, and smooth areas (Li and Bovik,
2010). Multiscale SSIM (MS-SSIM) (Wang et al.,
2003) is an advanced top-down interpretation of how
the human visual system interprets images that con-
siders variations of image resolution and viewing con-
ditions. Comprehensive evaluations (Sheikh et al.,
2006; Ponomarenko et al., 2009) have demonstrated
that SSIM and MS-SSIM can offer statistically much
better performance in assessing image quality than
other quality metrics. Moreover, as MS-SSIM outper-
forms the best single-scale SSIM model (Wang et al.,
2003), we consider it next in our work.
3 PROPOSED METHOD
As stated in Sec. 2.1, an important limitation of DMD
is that it simplifies an image globally. Therefore,
we improve DMD by considering spatially-dependent
simplification of image foreground and background.
We call our method Spatial Saliency DMD (SSDMD
for short). Fig. 1 (red) shows the steps that SSDMD
adds to DMD. These steps are described next.
3.1 Salient Islands Detection
As explained in Sec. 2, DMD removes islands smaller
than a global value of ε area units. This removes not
only noise but also small important features (e.g. the
animal eyes in Fig. 3 a1–c1). To address this, we com-
pute a saliency-aware metric C
µ
i
=
∑
x∈C
i
µ(x), where
C
i
is the ith connected component, and next remove
only islands where C
µ
i
is below a user-given threshold
ε
0
. This keeps small-size, but salient, details, in the
compressed image.
3.2 Saliency-based Skeletons
We further simplify the regularized skeletons
˜
S
i
by
removing pixels whose saliency µ is below a user-
given threshold µ
0
, resulting in saliency-aware skele-
tons
˜
S
µ
i
= {x ∈
˜
S
i
|µ(x) > µ
0
}. The threshold µ
0
con-
trols the amount of the non-salient areas. To avoid
low-saliency areas (with saliency µ that are below the
global threshold µ
0
) being completely removed, re-
sulting in poor image quality, we reserve one layer
every m layers for these areas. The skeletons
˜
S
i
to be
reconstructed are then computed using to the piece-
wise formulation
˜
S
i
=
(
˜
S
i
, if i mod m = 0,
˜
S
µ
i
, otherwise.
The parameter m controls how smooth color or bright-
ness gradients will be in the non-salient areas; smaller
m values yield smoother gradients. Since only several
layers are reserved in non-salient areas, an intensity-
banding effect can occur. To solve this, we apply
Focus-and-Context Skeleton-based Image Simplification using Saliency Maps
47
a smooth distance-based interpolation between two
consecutive selected layers T
i
and T
i+1
(Zwan et al.,
2013). In detail, for a pixel x located between the
boundaries ∂T
i
and ∂T
i+1
, we interpolate its value I(x)
(in all three channels independently) from the corre-
sponding values I
i
and I
i+1
as
I(x)=
1
2
min
DT
i
DT
i+1
,1
I
i
+ max
1 −
DT
i+1
DT
i
,0
I
i+1
.
where DT
i
is the distance transform of layer T
i
evalu-
ated at location x.
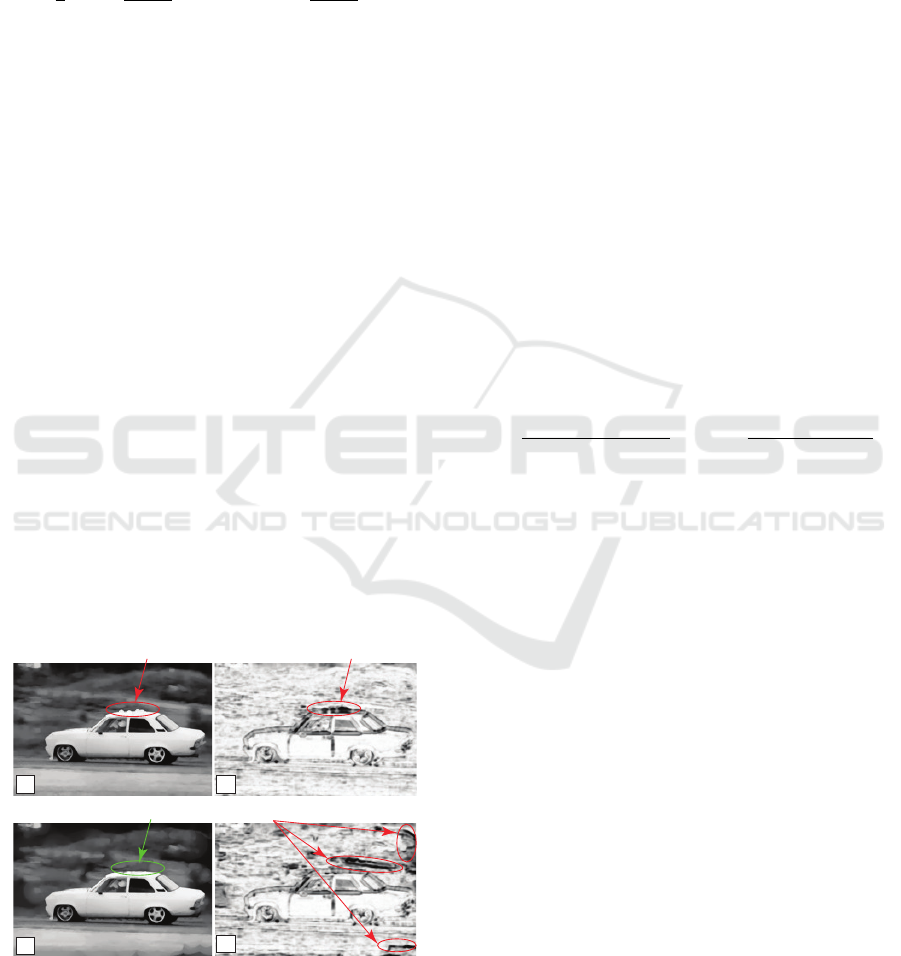
3.3 Saliency-aware Quality Metric
While MS-SSIM models human perception well
(Sec. 2.3), it treats focus (high µ(x)) and context (low
µ(x)) areas identically. Figure 2 shows this: Image (a)
shows the DMD compression of a car image. Image
(b) shows the SSIM map, i.e., the per-pixel structural
similarity between the original image and its DMD
compression, in which darker pixels indicate lower
similarity. Image (a) shows some artifacts on the car
roof, also visible as dark regions in the SSIM map
(b). Image (c) shows the SSDMD compression of the
same image, with strong background simplification
and high detail retention in the focus (car) area. The
car-roof compression artifacts are removed, so (c) is
a better representation than (a) of the original image.
However, the MS-SSIM score of (c) is much lower
than for DMD compression (0.9088 vs 0.9527). The
large dark areas in the background of the SSIM map
(d) explain this: While our saliency map µ clearly says
that background is unimportant, MS-SSIM considers
it equally important as foreground, which is counter-
intuitive.
a
b
c
d
compression artifacts
low-SSIM foreground areas
artifacts are gone
low-SSIM background areas
Figure 2: DMD compression has artifacts (a) found as low-
SSIM regions (b). SSDMD (c) removes these but finds sub-
tle background differences as important for quality (d).
Given the above, saliency data should be (visu-
ally) considered in the quality metric so that the latter
is more consistent with the human visual system. This
is also reflected by saliency-based objective metrics
reported in the literature (Le Callet and Niebur, 2013;
Engelke and Le Callet, 2015; Liu and Heynderickx,
2011; Liu et al., 2013; Alaei et al., 2017). In these
designs, a visual saliency map is integrated into the
quality metric as a weighting map, which improves
image quality prediction performance. We follow the
same idea, by integrating the spatial saliency map into
the MS-SSIM (Wang et al., 2003) pooling function,
as follows. Take the MS-SSIM metric for a reference
image I and a distorted image
˜
I
Q(I,
˜
I) = [SSIM(I,
˜
I)]
β
M
M−1
∏
j=1
[c
j
(I,
˜
I)]
β
j
, (1)
where c
j
is the contrast map c(I,
˜
I) iteratively down-
sampled by a factor of 2 on scale 1 ≤ j ≤ M and
SSIM(I,
˜
I) is the structural similarity of I and
˜
I on
scale M (Wang et al., 2004). The exponent β
j
models
the relative importance of different scales. We weigh
Q by the saliency map µ, yielding the saliency-aware
quality metric
Q
µ
=
∑
x∈I
µ(x)SSIM(x)
∑
x∈I
µ(x)
β
M
M−1
∏
j=1
∑
x∈I
µ
j
(x)c
j
(x)
∑
x∈I
µ
j
(x)
β
j
,
(2)
where µ
j
is the saliency map at scale j. For notation
brevity, we omitted the arguments I and
˜
I in Eqn. 2.
Using Q
µ
instead of Q allows in-focus values (high
µ(x)) to contribute more to similarity than context
values (low µ(x)), in line with our goal of spatially-
controlled simplification.
4 RESULTS
The proposed SSDMD method described in Sec. 3
adapts the original DMD pipeline by using the spatial
saliency information. We next demonstrate SSDMD,
and discuss its properties, on several images. In the
following, we define the compression ratio of an im-
age as CR = |I|/|MAT (
˜
I)|, i.e., the size (in bytes) of
the original I divided by the size (in bytes) of the
MATs of the L selected layers used to encode
˜
I. The
latter includes the size of the encoded file that needs
to be stored to reconstruct the original image using
the (SS)DMD method.
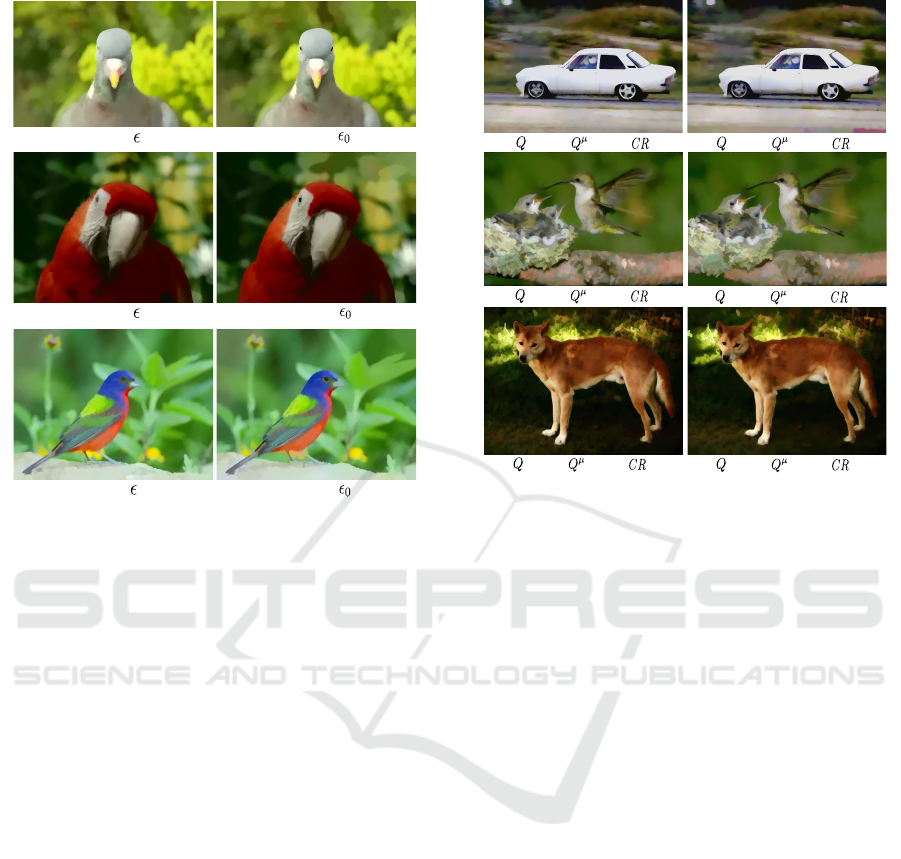
Increasing Compression While Retaining High-
lights. Figure 3 shows the simplification of three
bird images by DMD (a1–c1) and SSDMD (a2–c2).
VISAPP 2021 - 16th International Conference on Computer Vision Theory and Applications
48
a2) CR = 7.46 ( = 7)
a1) CR = 7.08 ( = 0.04)
b2) CR = 7.84 ( = 5)
b1) CR = 7.20 ( = 0.04)
c2) CR = 7.00 ( = 4)
c1) CR = 6.65 ( = 0.03)
DMD compression
SSDMD compression
Figure 3: Comparison of DMD (a1–c1) with SSDMD (a2–
c2). The compression ratio CR is indicated for each image.
To test our new saliency-aware metric C
µ
i
(Sec. 3.1),
we keep all parameter settings of DMD and SSDMD
the same, and only vary the island detection param-
eter ε and ε
0
for DMD and SSDMD separately. The
identical parameters are set to empirically-determined
values (Wang et al., 2020b), i.e., L = 30 and σ
0
= 0.1.
Compared to DMD, SSDMD preserves the birds’
eyes while simplifying the background more, which
allows it to achieve higher compression ratios while
keeping perceptually salient features.
Q
µ
Achieves Higher Correlation with Human Per-
ception. Figure 4 shows DMD (a1–c1) and SS-
DMD (a2–c2) applied to three focus-and-context im-
ages. For each image, we indicate the standard MS-
SSIM quality Q, spatial-saliency-aware quality Q
µ
,
and compression ratio CR. The Q values for SSDMD
are lower than those for DMD, which suggests that
SSDMD has a poorer quality than DMD. Yet, we see
that SSDMD produces images that are visually al-
most identical to DMD, in line with the almost iden-
tical Q
µ
values for SSDMD and DMD. Thus, we ar-
gue that Q
µ
is a better quality measure for focus-and-
context simplification than Q. Also, we see that, while
Q
µ
stays almost identical, SSDMD compresses better
than DMD (CR values on average 24.6% higher).
=0.9364,
=0.9189,
a1)
=4.57
=0.9244,
=0.9128,
a2)
=6.08
=0.9186,
=0.9095,
b1)
=4.91
=0.8975,
=0.9007,
b2)
=5.98
=0.8789,
=0.9065,
c1)
=5.90
=0.8539,
=0.9003,
c2)
=7.02
DMD compression
SSDMD compression
Figure 4: Comparison of DMD (a1–c1) with SSDMD (a2–
c2) for three focus-and-context images. For each image,
we show the standard MS-SSIM quality Q, spatial-saliency-
aware MS-SSIM Q
µ
, and compression ratio CR.
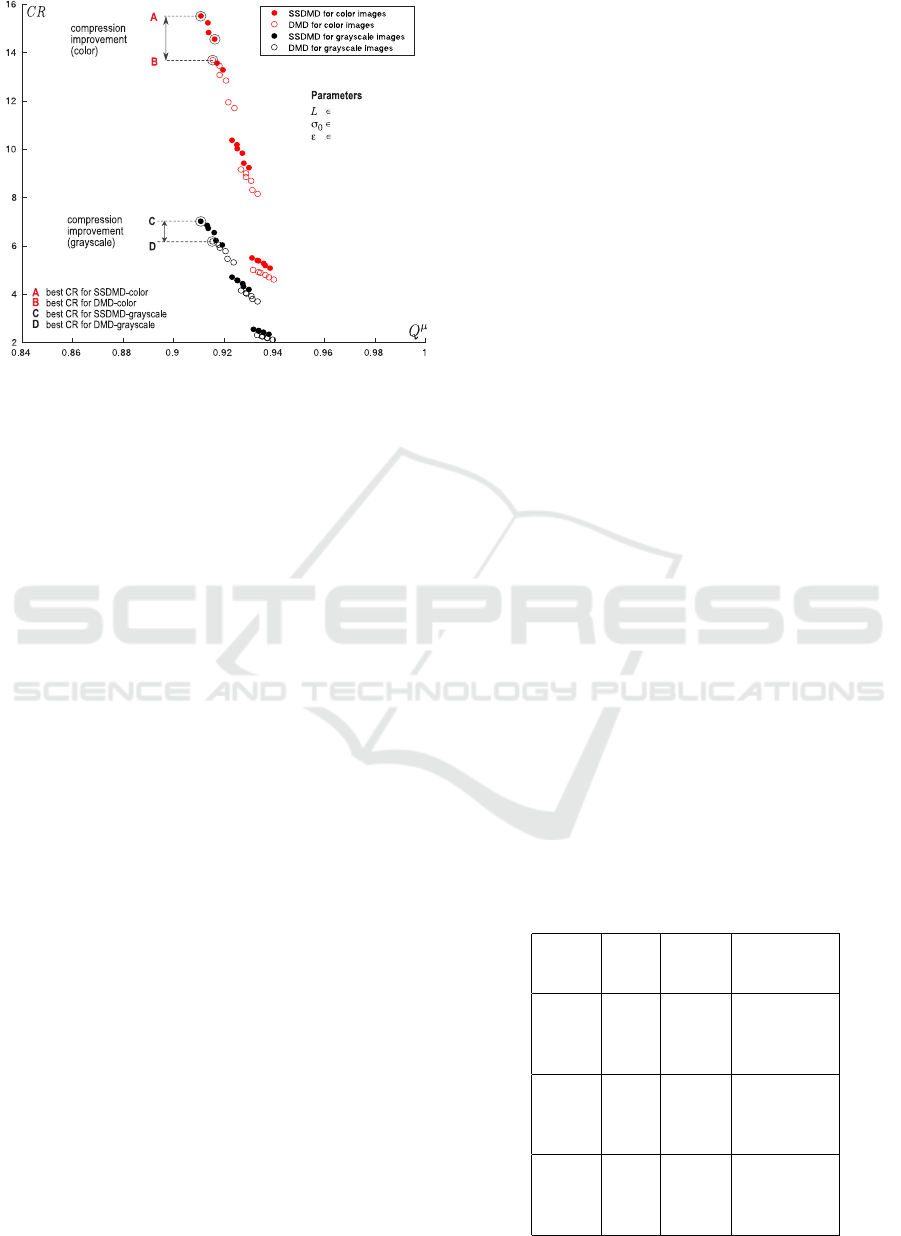
Increasing Compression and/or Quality. Figure 5
extends this insight to 150 images, selected randomly
from the MSRA10K (Cheng, 2014), SOD (Movahedi
and Elder, 2010), and ECSSD (Shi et al., 2016)
benchmarks. Hollow dots in Fig. 5 are DMD com-
pression results, and filled dots are SSDMD results.
One dot represents the average Q
µ
and CR for a spe-
cific parameter-setting over all images in the bench-
mark. Same-kind dots show 2 · 3 · 3 = 18 different
settings of the parameters L, ε, and σ
0
(actual values
shown in Fig. 5). To find these, we first evaluated Q
µ
and CR by grid search over the full allowable ranges
of L, ε, and σ
0
, and then found subranges where both
Q
µ
and CR yielded high values. Next, we took a few
samples within these subranges, leading to the val-
ues shown in the figure. Finally, we set threshold
µ
0
= 0.01, i.e., keeping all but the least salient parts
of the image; recall that µ(x) ∈ [0,1].
As explained in Sec. 2.1, for color images,
(SS)DMD is applied to the individual channels of
these, following representations in various color
spaces. In contrast to (Wang et al., 2020b), which uses
the RGB color space, we choose to use YUV (more
precisely, YCbCr) in all the (SS)DMD experiments,
for two reasons. First, YUV was shown to give better
subjective quality than RGB due to its perceptual sim-
ilarities to human vision (Podpora et al., 2014; Pod-
pora, 2009). Secondly, since the human eye is less
Focus-and-Context Skeleton-based Image Simplification using Saliency Maps
49
{30, 40}
{0.1, 0.8, 1.5}
{0.01, 0.02, 0.03}
E
Figure 5: Average quality Q
µ
vs compression ratio CR for
150 images for SSDMD and DMD.
sensitive to the chrominance components Cb (blue
projection) and Cr (red projection), strongly com-
pressing these components achieves a higher com-
pression ratio while keeping quality high (Nobuhara
and Hirota, 2004). We see this also in Fig. 5: The
SSDMD compression ratio (CR) of color images (red
dots) is more than twice that of the grayscale images
(black dots) on average, and nearly always higher than
the CR of the same images computed by DMD (red
circles), while having the same quality. We also ob-
serve that for both color and grayscale images, the
best CR values we obtain with SSDMD (points A, C)
is about 14% higher than the best CR produced by
DMD (points B, D). Hence, SSDMD improves com-
pression as compared with DMD, with, as visible in
Fig. 5, only a very slight decrease in quality Q
µ
. In
particular, point E shows a run of SSDMD that im-
proves on both compression (CR) and quality (Q
µ
)
as compared to the highest-compression run of DMD
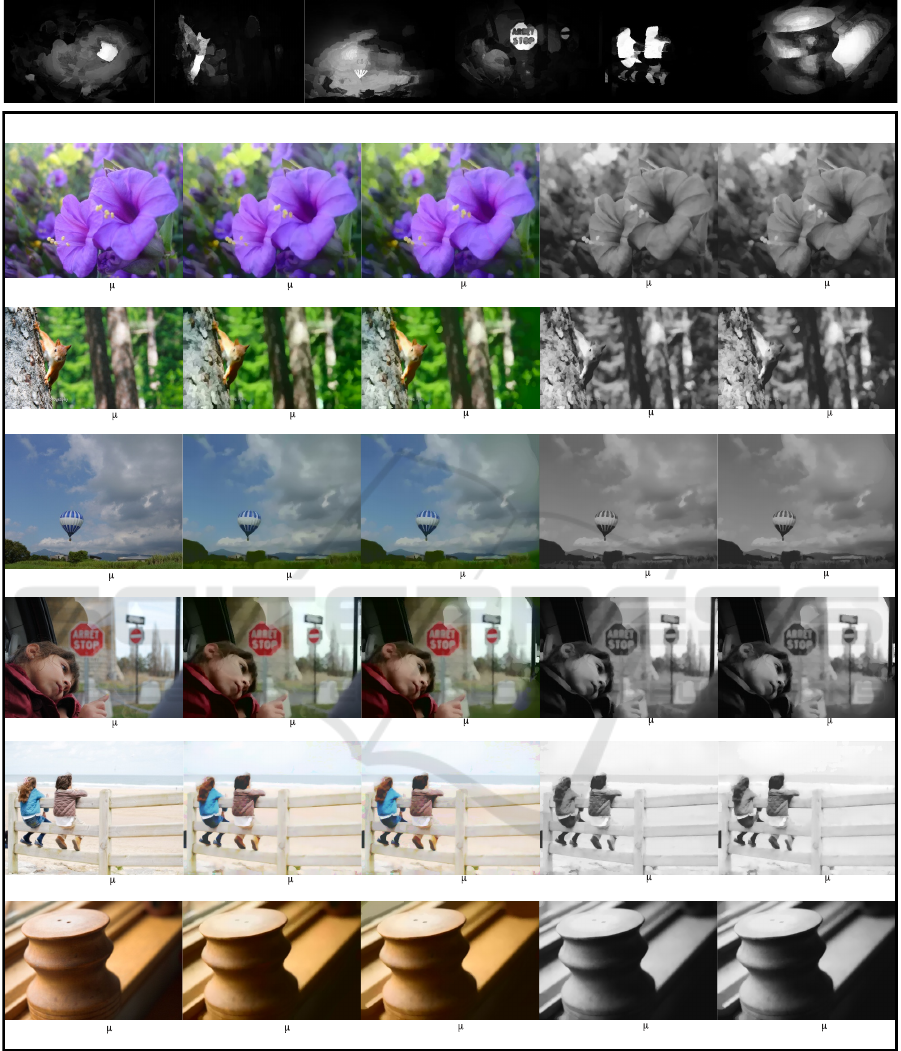
(point B). Figure 6 further explores this insight for six
real-world images (plant, animal, natural scene, peo-
ple, and man-made structure) from the MSRA10K,
SOD, and ECSSD benchmarks. We show both color
versions and their grayscale counterparts compressed
by DMD and SSDMD, and their corresponding CR
and Q
µ
values. We also show their saliency maps µ on
top to illustrate what is considered focus and context.
Both images and values in Fig. 6 show that the SS-
DMD method increases the compression ratio while
maintaining perceived quality.
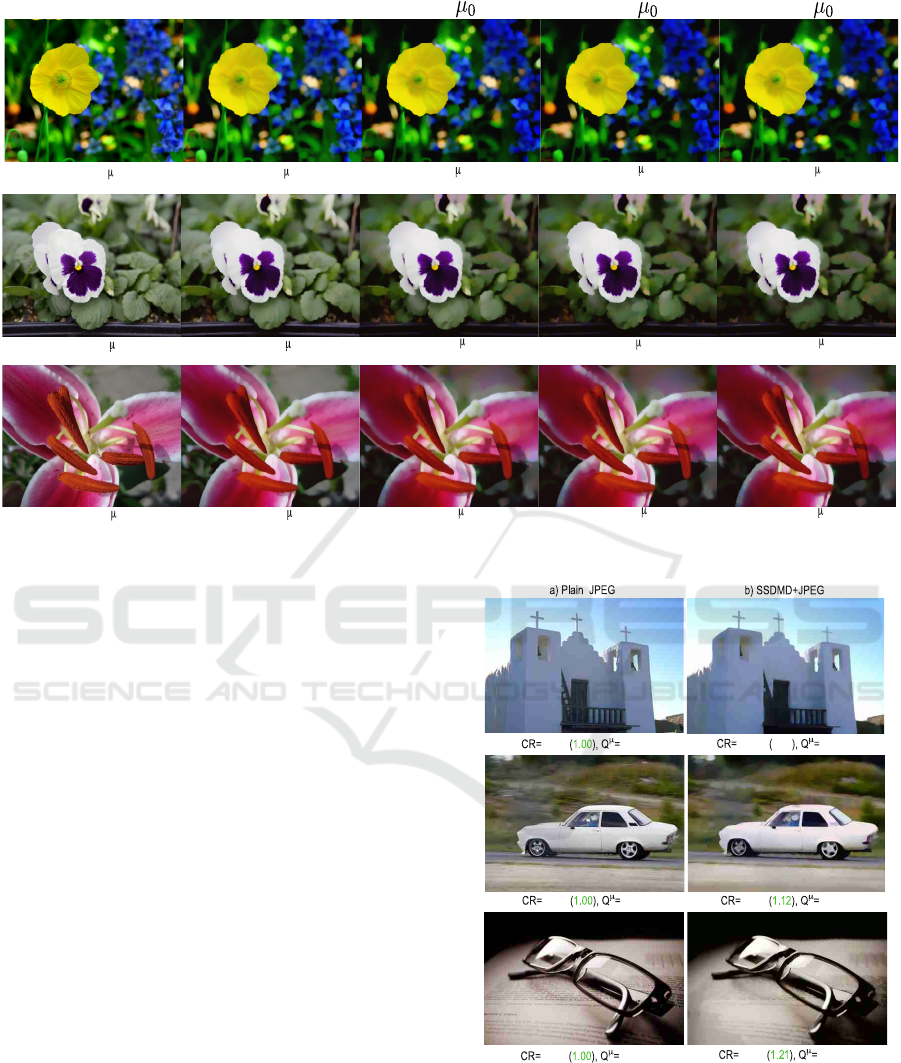
Progressively Simplification Effect of µ
0
. As al-
ready discussed, Fig. 5 compares 18 different set-
tings of the parameters L, ε, and σ
0
for both DMD
and SSDMD, for a fixed value µ
0
= 0.01. This was
done to ease the interpretation of the respective scat-
terplots, as using multiple µ
0
values in the same fig-
ure would have been hard to read. However, the pa-
rameter µ
0
does affect the CR vs Q
µ
trade-off, effec-
tively allowing the user to specify how strongly s/he
wants to simplify the image (increase CR) by trad-
ing off a certain quality amount (decrease Q
µ
). Fig-
ure 7 gives insight into this, showing three images
(flower in the saliency focus in all cases) for three
settings µ
0
∈ {0.04,0.08,0.12}. The setting µ
0
= 0
corresponds to DMD. All other parameters are fixed
to default values L = 50, ε = 0.01, σ
0
= 0.5, and
m = 8. Compared with DMD, the background areas
of the SSDMD images are gradually simplified as µ
0
increases; however, the flower is not changed, as it is
in a high-saliency area. The CR and Q
µ
values shown
below the images show that increasing µ
0
greatly im-
proves the compression ratio of SSDMD while qual-
ity is only slightly reduced.
JPEG Preprocessor. A final interesting use-case is
to combine SSDMD’s simplification ability with a
generic image compressor. For this, we ran SSDMD
as a ‘preprocessor’ and subsequently compressed its
result with standard JPEG. Figure 8 shows the results
of plain JPEG compression at 20% quality setting and
SSDMD+JPEG for the same quality setting for three
images. Values in green are the CR of SSDMD+JPEG
divided by plain JPEG’s CR, i.e., the compression
gain when using SSDMD as preprocessor for JPEG.
This gain is 15%, 12% and 21% for the church, car,
and spectacles image, respectively. For these im-
ages, the results using SSDMD+JPEG are visually
almost identical in the focus areas (church building,
car shape, and spectacles shape). Of course, in the
context area (sky around church, scenery around car,
book around spectacles) some differences are visi-
Table 1: Performance of plain JPEG and SSDMD + JPEG
under different quality settings for the images in Fig. 8.
Images
Quality
Settings
(%)
Plain
JPEG
(CR/Q
µ
)
SSDMD
+ JPEG
(CR (gain)/Q
µ
)
Church
40 61.9/0.991 72.1 (1.16)/0.955
60 47.1/0.994 55.6 (1.18)/0.958
80 30.7/0.997 37.5 (1.22)/0.960
100 4.3/1.0 6.7 (1.55)/0.961
Car
40 37.8/0.994 44.7 (1.18)/0.942
60 28.5/0.996 34.0 (1.19)/0.943
80 19.2/0.998 22.9 (1.19)/0.944
100 3.5/1.0 4.3 (1.23)/0.944
Spectacles
40 38.0/0.995 46.7 (1.23)/0.957
60 29.4/0.997 36.4 (1.24)/0.958
80 20.0/0.999 25.2 (1.26)/0.959
100 5.2/1.0 6.0 (1.15)/0.960
VISAPP 2021 - 16th International Conference on Computer Vision Theory and Applications
50
a) Original Image
b) DMD for color image
c) SSDMD for color image
d) DMD for grayscale image
e) SSDMD for grayscale image
CR = 3.99, Q =0.966
CR = 5.01, Q =0.962
CR = 2.44, Q =0.964
CR = 2.79, Q =0.962
CR = 1.0, Q =1.0
CR = 5.96, Q =0.948
CR = 6.51, Q =0.943
CR = 2.51, Q =0.945
CR = 2.87, Q =0.942
CR = 1.0, Q =1.0
CR = 14.25, Q =0.965
CR = 15.32, Q =0.964
CR = 7.25, Q =0.964
CR = 7.90, Q =0.963
CR = 1.0, Q =1.0
CR = 7.98, Q =0.958
CR = 8.66, Q =0.956
CR = 3.66, Q =0.957
CR = 3.97, Q =0.955
CR = 1.0, Q =1.0
CR = 5.99, Q =0.970
CR = 7.11, Q =0.974
CR = 2.84, Q =0.970
CR = 3.20, Q =0.970
CR = 1.0, Q =1.0
CR = 4.29, Q =0.949
CR = 5.26, Q =0.948
CR = 3.28, Q =0.951
CR = 4.04, Q =0.949
CR = 1.0, Q =1.0
Figure 6: Comparison of the DMD with the SSDMD method for color and grayscale versions of six input images. The top
row shows the spatial saliency maps of each input image. For each image, we show the compression ratio CR and quality
score Q
µ
.
Focus-and-Context Skeleton-based Image Simplification using Saliency Maps
51
CR = 2.00, Q =0.960
CR = 3.26, Q =0.955
CR = 4.08, Q =0.946
CR = 4.90, Q =0.941
CR = 1.0, Q =1.0
a) Original Image
CR = 1.67, Q =0.961
CR = 4.19, Q =0.945
CR = 5.14, Q =0.941
CR = 1.0, Q =1.0
CR = 1.91, Q =0.954
CR = 3.06, Q =0.948
CR = 3.40, Q =0.943
CR = 3.71, Q =0.936
CR = 1.0, Q =1.0
b) DMD
c1) SSDMD ( = 0.04)
c2) SSDMD ( = 0.08)
c3) SSDMD ( = 0.12)
CR = 3.37, Q =0.950
Figure 7: Progressive simplification control with the user-given threshold µ
0
.
ble. This is expected — and intended — since, as
explained, SSDMD aims to keep details in the fo-
cus area while simplifying them away in the context.
Table 1 extends these insights by listing results un-
der additional JPEG quality setting values for these
three images. We see that the higher the quality set-
ting, the higher the compression gain (green value)
obtained by SSDMD as a preprocessor, except for the
last row. In other words, for the same quality setting,
SSDMD can help JPEG to increase compression rates
for a minimal quality loss. This is explained by the
fact that SSDMD removes small-scale sharp corners
(which correspond to high frequencies in the image)
in non-salient, background, image areas, thus making
JPEG’s job overall easier.
5 DISCUSSION
We next discuss a few aspects of our proposed SS-
DMD method.
Genericity of the Saliency Map µ. In general, any
saliency map that encodes which image areas are
more important (salient) and which not for the appli-
cation at hand can be used. In contrast to segmenta-
tion tasks, we do not require precise saliency maps.
Figure 9(a–c) shows the SSDMD compression with
58.75
0.9873 0.9280
65.85
94.24
0.9812 0.9395
108.58
1.15
56.72
0.9884
68.48
0.9513
Figure 8: Comparison of JPEG (a) with the SSDMD
method applied as preprocessor to JPEG (b) for three im-
ages. Green values show CR gains as compared to JPEG.
three different saliency maps applied: DRFI (Jiang
et al., 2013), SMD (Peng et al., 2017) and the very
recent ITerative Saliency Estimator fLexible Frame-
work (ITSELF) (de Melo Joao et al., 2020). ITSELF’s
VISAPP 2021 - 16th International Conference on Computer Vision Theory and Applications
52
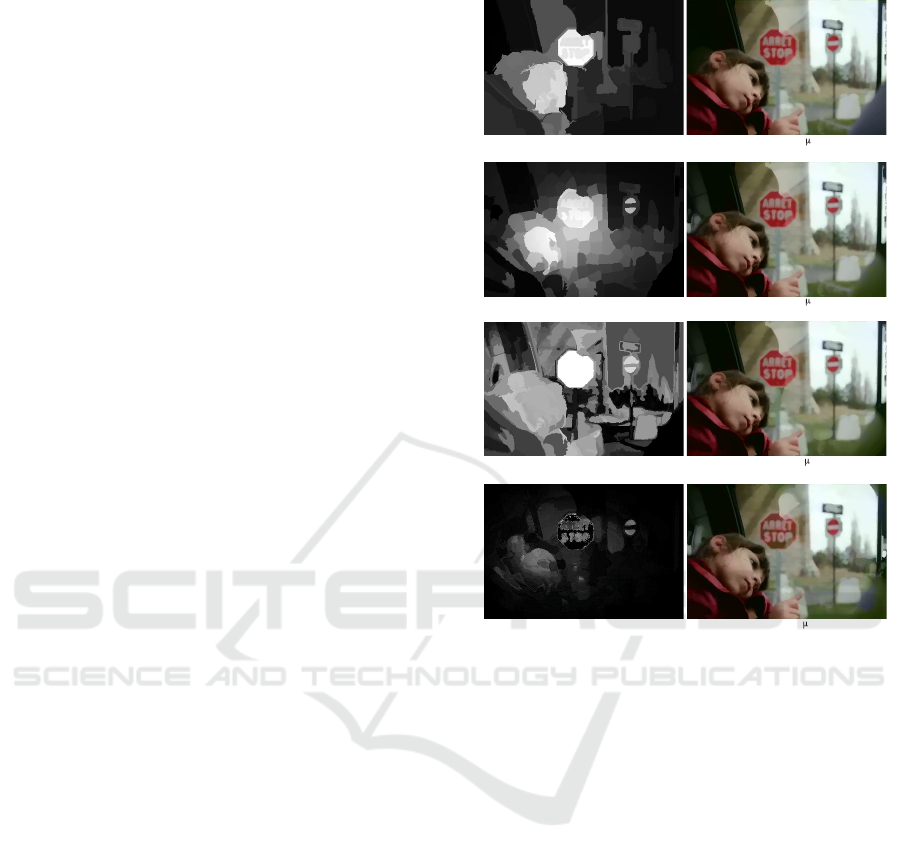
flexibility allows significant changes in the resulting
saliency maps by performing small adjustments to
its parameters. Figure 9(c1) is a more nuanced ver-
sion created by a relaxed threshold. Just like the
result obtained by the DSR saliency map in Fig. 6,
all these three results get a higher compression ratio
compared to the DMD method in Fig. 6 while main-
taining similar quality. Besides, users can even cus-
tomize the saliency maps themselves if the available
saliency map µ does not meet their preferences. For
this example, all these saliency maps say the stop traf-
fic sign in the image is very important. Yet, if the user
does not care about the sign, but rather wants to fo-
cus on the human face in the foreground, s/he could
manually tune this area to be less than µ
0
, as shown
in Fig. 9(d1), which is a user customization based on
the DSR saliency map. This way, one can obtain a
higher CR on the premise of meeting one’s quality re-
quirements, as shown in Fig. 9(d2). We should stress
again that what is a good saliency map is entirely at
the user’s discretion and not a concern of SSDMD:
Given a saliency map one is happy with, SSDMD
compresses in low-saliency regions and preserves de-
tail in high saliency regions.
Ease of Use. SSDMD can be used on any im-
age, and adds two simple-to-control parameters: the
saliency-aware island threshold ε
0
and the spatially-
regularized skeleton threshold µ
0
. These parameters
have an intuitive meaning: ε
0
determines the scale of
details that are kept in the image (higher values re-
move larger details); µ
0
controls how much the back-
ground/unimportant areas are simplified (higher val-
ues simplify background more).
Scalability. We inherit the speed of DMD (process-
ing images up to 1000
2
pixels in a few milliseconds)
given by the GPU-based MAT computation. Apply-
ing the saliency map involves only two simple addi-
tional thresholding operations.
Replicability. We provide the full source code of
SSDMD, implemented in C++ and NVidia CUDA for
replication purposes (Wang et al., 2020a).
Limitations. SSDMD cannot yet produce higher
quality and better compression ratios than JPEG. Yet,
as shown in Sec. 4, combining it with JPEG generi-
cally increases the latter’s compression while main-
taining quality. Separately, the focus-and-context
compression is only as good as the quality of the used
saliency maps. When such maps incorrectly mark fo-
cus details as context, these will be simplified away;
a1) DRFI method
SSDMD compression
Saliency map
a2) CR = 8.38, Q = 0.952
b1) SMD method
b2) CR = 8.30, Q = 0.953
c1) ITSELF method
c2) CR = 8.72, Q = 0.955
d1) Customized saliency map
d2) CR = 8.84, Q = 0.954
[39]
[40]
[41]
Figure 9: SSDMD performance with different spatial
saliency maps applied.
conversely, when context is marked as focus, the com-
pression ratio will be suboptimal.
6 CONCLUSIONS
We have presented SSDMD, a method for saliency-
aware image simplification and compression. SS-
DMD uses dense medial skeletons and a saliency map
specifying which image areas can be simplified with-
out compromising overall image perception. Addi-
tionally, we have proposed a saliency-dependent ver-
sion of the MS-SSIM metric to evaluate SSDMD on
images having a focus-and-context structure. Our
results show that compared with the DMD method,
SSDMD increases compression while keeping im-
age quality high. SSDMD can also be used to im-
prove the compression of standard JPEG though yield
slightly lower quality. Currently, SSDMD is far from
competing, standalone, with JPEG2000, HEVCIn-
tra (Nguyen and Marpe, 2012), not to mention re-
cent image compression methods that use deep learn-
Focus-and-Context Skeleton-based Image Simplification using Saliency Maps
53

ing (Toderici et al., 2016). However, this was not the
goal of our paper. Rather, our purpose was to ex-
plore the potential of skeletons as an alternative tool
to image representation. We believe that our results
show that skeletons, when combined with saliency
maps, offer a promising tool for lossy image encod-
ing, which can be refined next in the direction of com-
petitive image compression.
We next aim to study more effective ways to en-
code skeletons prior to compression using piecewise-
spline representations. Separately, we aim to test
our method for simplifying general 2D and 3D
scalar fields in scientific visualization, weighted with
uncertainty-based saliency maps. In the long run, as
outlined above, we believe that skeletons and saliency
maps can provide effective and efficient tools for
general-purpose, but also application-specific, lossy
image representation.
ACKNOWLEDGEMENTS
The first author acknowledges the China Scholarship
Council (Grant number: 201806320354) for financial
support.
REFERENCES
Alaei, A., Raveaux, R., and Conte, D. (2017). Image quality
assessment based on regions of interest. Signal, Image
and Video Processing, 11:673–680.
Andrushia, A. and Thangarjan, R. (2018). Saliency-based
image compression using Walsh-Hadamard transform
(WHT). In Lecture Notes in Computational Vision and
Biomechanics, pages 21–42. Springer.
Borji, A., Cheng, M., Jiang, H., and Li, J. (2015).
Salient object detection: A benchmark. IEEE TIP,
24(12):5706–5722.
Cazzato, D., Leo, M., Distante, C., and Voos, H. (2020).
When i look into your eyes: A survey on computer
vision contributions for human gaze estimation and
tracking. Sensors, 20:3739.
Chen, T., Cheng, M., Tan, P., Shamir, A., and Hu, S. (2009).
Sketch2photo: Internet image montage. ACM Trans.
Graph., 28(5):1–10.
Cheng, M. (2014). MSRA10K salient object database. http:
//mmcheng.net/msra10k.
Cheng, M., Mitra, N. J., Huang, X., Torr, P. H., and Hu, S.
(2014). Global contrast based salient region detection.
IEEE TPAMI, 37(3):569–582.
Costa, L. d. F. D. and Cesar, R. M. (2000). Shape Analysis
and Classification: Theory and Practice. CRC Press,
Inc., USA, 1st edition.
de Melo Joao, L., de Castro Belem, F., and Falcao, A. X.
(2020). Itself: Iterative saliency estimation flexible
framework. Available at https://arxiv.org/abs/2006.
16956.
Engelke, U. and Le Callet, P. (2015). Perceived interest
and overt visual attention in natural images. Signal
Processing: Image Communication, 39:386–404.
Falc
˜
ao, A., Stolfi, J., and Lotufo, R. (2004). The image
foresting transform: Theory, algorithms, and applica-
tions. IEEE TPAMI, 26(1):19–29.
Goferman, S., Zelnik, L., and Tal, A. (2011). Context-aware
saliency detection. IEEE TPAMI, 34(10):1915–1926.
Jiang, H., Wang, J., Yuan, Z., Wu, Y., Zheng, N., and Li,
S. (2013). Salient object detection: A discriminative
regional feature integration approach. In 2013 IEEE
Conference on Computer Vision and Pattern Recogni-
tion, pages 2083–2090.
Jiang, P., Ling, H., Yu, J., and Peng, J. (2013). Salient re-
gion detection by ufo: Uniqueness, focusness and ob-
jectness. In Proc. ICCV, pages 1976–1983.
Koehoorn, J., Sobiecki, A., Boda, D., Diaconeasa, A.,
Doshi, S., Paisey, S., Jalba, A., and Telea, A. (2015).
Automated digital hair removal by threshold decom-
position and morphological analysis. In Proc. ISMM,
volume 9082, pages 15–26. Springer.
Koehoorn, J., Sobiecki, A., Rauber, P., Jalba, A., and Telea,
A. (2016). Efficient and effective automated digital
hair removal from dermoscopy images. Math. Mor-
phol. Theory Appl., 1.
Le Callet, P. and Niebur, E. (2013). Visual attention and
applications in multimedia technologies. Proceedings
of the IEEE, 101(9):2058–2067.
Li, C. and Bovik, A. (2010). Content-weighted video qual-
ity assessment using a three-component image model.
J. Electronic Imaging, 19:110–130.
Li, X., Lu, H., Zhang, L., Ruan, X., and Yang, M. (2013).
Saliency detection via dense and sparse reconstruc-
tion. In Proc. IEEE ICCV, pages 2976–2983.
Li, X., Lu, H., Zhang, L., Ruan, X., and Yang, M. (2013).
Saliency detection via dense and sparse reconstruc-
tion. In 2013 IEEE International Conference on Com-
puter Vision, pages 2976–2983.
Liu, H., Engelke, U., Wang, J., Callet, Le, P., and Heyn-
derickx, I. (2013). How does image content affect
the added value of visual attention in objective image
quality assessment? IEEE Signal Processing Letters,
20:355–358.
Liu, H. and Heynderickx, I. (2011). Visual attention in
objective image quality assessment: Based on eye-
tracking data. IEEE TCSVT, 21(7):971–982.
Liu, H. and Heynderickx, I. (2011). Visual attention in
objective image quality assessment: Based on eye-
tracking data. IEEE Transactions on Circuits and Sys-
tems for Video Technology, 21(7):971–982.
Movahedi, V. and Elder, J. H. (2010). Design and perceptual
validation of performance measures for salient object
segmentation. In 2010 IEEE Computer Society Con-
ference on Computer Vision and Pattern Recognition
- Workshops, pages 49–56.
Nguyen, T. and Marpe, D. (2012). Performance analysis of
HEVC-based intra coding for still image compression.
In Proc. IEEE Picture Coding Symp., pages 233–236.
VISAPP 2021 - 16th International Conference on Computer Vision Theory and Applications
54

Nobuhara, H. and Hirota, K. (2004). Color image compres-
sion/reconstruction by yuv fuzzy wavelets. In IEEE
Annual Meeting of the Fuzzy Information, 2004. Pro-
cessing NAFIPS ’04., volume 2, pages 774–779.
Peng, H., Li, B., Ling, H., Hu, W., Xiong, W., and
Maybank, S. J. (2016). Salient object detection
via structured matrix decomposition. IEEE TPAMI,
39(4):818–832.
Peng, H., Li, B., Ling, H., Hu, W., Xiong, W., and
Maybank, S. J. (2017). Salient object detection
via structured matrix decomposition. IEEE Transac-
tions on Pattern Analysis and Machine Intelligence,
39(4):818–832.
Podpora, M. (2009). Yuv vs. rgb–a comparison of lossy
compressions for human-oriented man-machine inter-
faces. Zeszyty Naukowe. Elektryka, pages 55–56.
Podpora, M., Korba
´
s, G., and Kawala-Janik, A. (2014). Yuv
vs rgb – choosing a color space for human-machine
interaction. Annals of Computer Science and Infor-
mation Systems, Vol. 3:29–34.
Ponomarenko, N., Lukin, V., Zelensky, A., Egiazarian, K.,
Carli, M., and Battisti, F. (2009). Tid2008 - a database
for evaluation of full-reference visual quality assess-
ment metrics. Advances of Modern Radioelectronics,
10:30–45.
Sheikh, H. R., Sabir, M. F., and Bovik, A. C. (2006). A sta-
tistical evaluation of recent full reference image qual-
ity assessment algorithms. IEEE Transactions on Im-
age Processing, 15(11):3440–3451.
Shi, J., Yan, Q., Xu, L., and Jia, J. (2016). Hierarchical im-
age saliency detection on extended cssd. IEEE Trans-
actions on Pattern Analysis and Machine Intelligence,
38(4):717–729.
Sobiecki, A., Koehoorn, J., Boda, D., Solovan, C., Di-
aconeasa, A., Jalba, A., and Telea, A. (2015). A
new efficient method for digital hair removal by dense
threshold analysis. In Proc. 4
th
WC of Dermoscopy.
poster and extended abstract; Conference date: 21-04-
2015.
Telea, A. (2012). Feature preserving smoothing of shapes
using saliency skeletons. In Proc. VMLS, pages 153–
170.
Telea, A. and van Wijk, J. (2002). An augmented fast
marching method for computing skeletons and center-
lines. In Proc. VisSym, pages 251–ff. Eurographics.
Toderici, G., O’Malley, S., Hwang, S. J., Vincent, D., Min-
nen, D., Baluja, S., Covell, M., and Sukthankar, R.
(2016). Variable rate image compression with recur-
rent neural networks. In Proc. ICLR. San Juan, Puerto
Rico, May 2-4, 2016.
Wang, J., de Melo Jo
˜
ao, L., Falcao, A., Kosinka, J., and
Telea, A. (2020a). Implementation of SSDMD.
https://wangjieying.github.io/SSDMD-resources.
Wang, J., Terpstra, M., Kosinka, J., and Telea, A. (2020b).
Quantitative evaluation of dense skeletons for image
compression. Information, 11(5):274.
Wang, Z. and Bovik, A. (2009). Mean squared error: Love
it or leave it? a new look at signal fidelity measures.
IEEE Signal Proc Mag, 26:98–117.
Wang, Z., Bovik, A., Sheikh, H., and Simoncelli, E. (2004).
Image quality assessment: from error visibility to
structural similarity. IEEE TIP, 13:600–612.
Wang, Z., Simoncelli, E., and Bovik, A. (2003). Multiscale
structural similarity for image quality assessment. In
Proc. Asilomar Conf. on Signals, Systems Computers,
pages 1398–1402.
Zhang, J., Fang, S., Ehinger, K. A., Wei, H., Yang, W.,
Zhang, K., and Yang, J. (2018). Hypergraph optimiza-
tion for salient region detection based on foreground
and background queries. IEEE Access, 6:26729–
26741.
Zhang, L., Zhang, L., Mou, X., and Zhang, D. (2011).
Fsim: A feature similarity index for image quality as-
sessment. IEEE Transactions on Image Processing,
20(8):2378–2386.
Zhang, L., Zhang, L., Mou, X., and Zhang, D. (2012).
A comprehensive evaluation of full reference image
quality assessment algorithms. In 2012 19th IEEE
International Conference on Image Processing, pages
1477–1480.
Z
¨
und, F., Pritch, Y., Sorkine-Hornung, A., Mangold, S., and
Gross, T. (2013). Content-aware compression using
saliency-driven image retargeting. In 2013 IEEE In-
ternational Conference on Image Processing, pages
1845–1849.
Zwan, M. V. D., Meiburg, Y., and Telea, A. (2013). A dense
medial descriptor for image analysis. In Proc. VIS-
APP, pages 285–293.
Focus-and-Context Skeleton-based Image Simplification using Saliency Maps
55
