
Developing a Robust Estimator for Remote Optical Erythema Detection
Maksym Ptakh
1,2
and Gennadi Saiko
1a
1
Swift Medical Inc., 1 Richmond St. W, Toronto, Canada
2
University of Waterloo, Waterloo, Canada
Keywords: Erythema, Inflammation, Turbid Tissues, Optical Biopsy.
Abstract: Introduction: Erythema is redness of the skin or mucous membranes, which is symptomatic for any skin injury,
infection, or inflammation. In some cases, it can be indicative of certain medical conditions (e.g.,
nonblanchable erythema in Stage I pressure injuries), and its detection can facilitate intervention at an earlier
timepoint. The most common and effective means of erythema detection is a visual inspection of the skin.
However, in many cases (especially for people with darkly pigmented skin), erythema can be masked by
melanin. Moreover, it would be useful to have an automated delineation and measurement of erythema using
consumer-grade devices, e.g., smartphones. It would facilitate automated symptom detection and measuring
healing progress in various settings, including the patient's home. Aims: This study aims to evaluate and
compare several algorithms that can be used for automated erythema detection using a smartphone's camera
in clinical settings. Methods: We have compared three potential estimators, which can be derived from an
RGB image: a) log(R/G), b) R-G, and c) a* channel in CIELAB color space. Here, R and G are red and green
channels of an RGB image, respectively. Imaged skin was divided into two classes: erythema and non-
erythema. The "erythema" class was seeded with pixels with E>mean(E)+z*st.dev(E), where E is the value
of the estimator for a particular pixel, z is a model parameter (z-score). The erythema cluster was then grown
by gradually adding nearby regions with an estimator E closer to the estimator’s mean of erythema cluster
than the mean of the estimator for the normal skin area (K-Mean (K=2)). The segmentation algorithm was
tested on a subset of labeled images from the Swift Medical proprietary wound imaging database. To evaluate
algorithm performance, the results of segmentation were compared with ground truth, manually labeled
images. To quantify results, sensitivity, specificity, and ROC curves were used. Results: We have found that
all investigated estimators could provide reasonable sensitivity (>0.8) and specificity (>0.78). However, a*
based estimator offers slightly better performance (0.86/0.84). Discussion: The preliminary data shows that
smartphone cameras can delineate erythema with reasonable sensitivity and specificity. Further studies are
required to correlate the accuracy with the skin type (melanin concentration in the skin).
1 INTRODUCTION
Erythema is redness of the skin or mucous
membranes caused by hyperemia in capillaries. It is
symptomatic of any skin injury, infection, or
inflammation. In some cases, it can be indicative of
certain medical conditions (e.g., nonblanchable
erythema in Stage I pressure injuries), and its
detection can facilitate intervention at an earlier
timepoint. For example, detecting a Stage I ulcer will
allow timely intervention to prevent the ulcer's
progression.
a
https://orcid.org/0000-0002-5697-7609
The most common and effective means of
erythema detection is a visual inspection of the skin.
However, for people with darkly pigmented skin,
erythema can be masked by melanin. One specific
benefit of a robust erythema detection algorithm is the
development of an instrument for use by health care
professionals to detect erythema. This can be useful
in monitoring reactive hyperemia or detecting Stage I
pressure ulcers in intensely pigmented subjects.
Several techniques have been proposed to
increase the sensitivity and specificity of erythema
detection. Tissue Reflectance Spectroscopy (TRS) is
a non-invasive method of quantifying skin color. In
Ptakh, M. and Saiko, G.
Developing a Robust Estimator for Remote Optical Erythema Detection.
DOI: 10.5220/0010192901150119
In Proceedings of the 14th International Joint Conference on Biomedical Engineering Systems and Technologies (BIOSTEC 2021) - Volume 2: BIOIMAGING, pages 115-119
ISBN: 978-989-758-490-9
Copyright
c
2021 by SCITEPRESS – Science and Technology Publications, Lda. All rights reserved
115

particular, TRS has been used to characterize the
presence of erythema due to reactive hyperemia or
Stage I pressure ulcers (Hagisawa, 1994). While TRS
is a data-collection technique, the absorption data
have to be processed by an algorithm to detect and
quantify the erythema. In Riordan et al. (Riordan,
2001), five different algorithms have been compared.
The authors found that most algorithms demonstrated
adequate validity across all subjects. However,
spectroscopic techniques have certain limitations.
Firstly, they are a single point measurement, which
precludes them from providing additional clinical
parameters, e.g., redness surface size, which can be
used by dermatologists, alergologists, and other
clinical specialists. Secondly, it may require contact
with the skin, which is undesirable in many cases.
Finally, they are labor- and time-consuming and
require specialized equipment, which cannot be
universally available.
With the proliferation of smartphones and
improvements in their cameras, they have become
standard tools for healthcare professionals to measure
and document wounds and skin conditions. These
measurements are remote and non-invasive. More
importantly, they can be performed in any setting,
including the patient's home. Thus, the ability to
detect erythema using a smartphone can have a
significant clinical value.
This study aims to evaluate and compare several
estimators that can be used for automated erythema
detection using a smartphone's camera.
Skin detection and tissue type analysis are fairly
active research areas. Skin detection is important for
many applications (e.g., automated screening for
adult content detection). Tissue type analysis and
classification are important for wound care
applications.
These areas use multiple approaches, which
typically fall into a) traditional image processing
methods (e.g., Mukherjee et al. (Mukherjee, 2014)) or
b) Machine Learning (ML) algorithms, and
particularly deep neural networks (DNN) (e.g., Wang
at al. (Wang, 2015)). In some cases (see, for example,
Veredas et al. (Veredas, 2010) or Li et al. (Li, 2018)),
hybrid methods are used.
Skin detection and segmentation are well
performed using conversion into YCbCr color space
(see Brancati et al. (Brancati, 2017)). In YCbCr
space, skin colors for healthy skin are clustered in a
compact area, which can be approximated by an oval
(Hsu, 2002)).
Machine learning methods require labeled
images. While Swift Medical has its own database of
labeled wound images, in our first proof of concept
study, we did not use any ML approaches. The reason
for this is the following. While wound tissue types
(namely epithelial, granulation tissue, slough, and
eschar) can be considered "absolute," i.e., their colors
are independent of the color (tone) of the surrounding
skin, erythema colors are "relative" with respect to the
surrounding skin. Thus, wound tissue types are ideal
candidates for the ML, and particularly for DNN-
based algorithms. However, the "relativeness" of
erythema colors makes it possible to apply traditional
image segmentation techniques. Moreover,
traditional methods can be useful to derive and
quantify underlying physiological information.
While several attempts were made to develop and
analyze such classifiers before (e.g., Roullot et al.
(Roullot, 2005)), these studies were conducted in a
well-controlled lab environment on healthy
volunteers. While it is useful as a proof of concept and
benchmarking, it is not clear how these classifiers will
perform in real-life scenarios on patients with
wounds, dressings, etc. This article aims to evaluate
the performance of classifiers in a realistic setting on
wound care patients.
The article is structured as follows:
First, we discuss several potential estimators,
which can be derived from simple physiological
considerations.
Then, we discuss the cluster segmentation
algorithm to segment the erythema cluster.
Finally, we evaluate the estimators' performances.
2 METHODS
2.1 Estimators
We can try to select candidates for an erythema
estimator based on simple physiological
considerations. It is known that erythema is
characterized by an elevated blood supply. Thus, one
can expect that erythema will be accompanied by
reduced reflectance in the green range of the spectrum
(oxyhemoglobin absorption peaks) and
approximately the same tissue reflectance in the red
range of the spectrum (oxyhemoglobin absorption is
small).
Based on these considerations, we can consider
several potential candidates for estimators.
Diffey et al. (Diffey 1991) proposed 𝐸
log R
/R
. Here R
635
and R
525
are the
reflectances of the skin at 635nm and 525nm,
respectively. Based on this idea, we can start from the
BIOIMAGING 2021 - 8th International Conference on Bioimaging
116
following estimator based on red and green channel
pixel values
𝐸
log
𝑆
𝑆
(1)
Tronnier erythema index (Tronnier, 1969) is
based on the difference between red and green
reflectance at a control site and an erythematic area.
Melanin compensation is achieved by comparing two
sites. Based on these considerations, we can introduce
another estimator:
𝐸
𝑆
𝑆
(2)
Finally, we can take into account that in CIELAB
color space (Lab color space): L* is the lightness,
which changes from black (0) to white (100), a*
changes from green (−) to red (+), and b* changes
from blue (−) to yellow (+). Taking into account that
definition, we can transform the initial image from
RGB to Lab color space and use a* channel as an
estimator:
𝐸
𝑎
∗
(3)
2.2 Test Set
The estimators' performance was evaluated on the
wound images from Swift Medical (Swift Medical
Inc, Toronto, Canada) image repository. Swift’s
image repository consists of wound images taken by
a proprietary Swift Skin and Wound system using
iOS smartphone cameras. The image dimensions are
1077x808 and are in jpg format. 2000 images were
cleared of personally identifiable information (PHI).
Subsequently, images were labeled using a
browser-based image labeling platform (LabelBox)
by a team of trained labelers and reviewed.
Tissues were labeled using the following
categories: four types of wound tissue (epithelial,
granulation, slough, and necrotic),
maceration/erythema, normal tissue, a fiduciary
object, and other (e.g., gloves, cloth). For the
purposes of this pilot study, we manually went
through the dataset and selected a much smaller
subset, which contained the correct labeling of the
erythema. In particular, we selected 18 images that a)
contained erythema visually, and b) erythema was
correctly labeled, and 20 images that a) does not
contain erythema visually, and b) no erythema labels
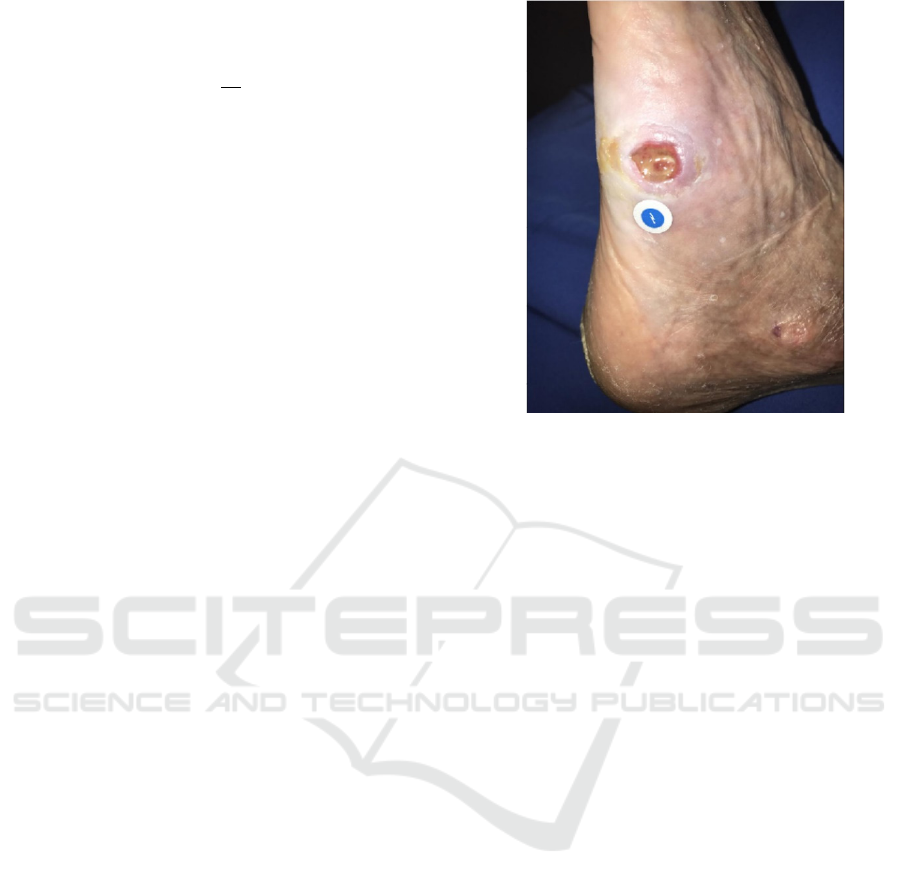
on the image. An example of an unlabeled wound
image from the Swift Medical image repository is
depicted in Figure 1.
Figure 1: An example of an unlabeled wound image from
the Swift Medical image repository. The white/blue circle
at the center is a fiduciary object.
2.3 Cluster Segmentation
Each intact skin area was segmented into two
clusters: "normal" skin and erythema. Wound tissues,
fiduciary objects, and others (gloves, cloth) were
excluded from consideration (it was assumed that
other methods could identify these classes).
The segmentation algorithm consisted of the
following steps:
1. Find a "normal" skin cluster (manually or
automatically)
2. Calculate mean 𝐸
) and standard deviation
(𝜎𝐸
) for an estimator for all pixels within
the "normal" cluster
3. Seed an erythema cluster (R) using the
following algorithm
𝐸𝐸
𝑧𝜎𝐸
4. Grow the erythema cluster from seed points
using the algorithm similar to (Roullot, 2005):
a. Compute C, which is the region of pixels
adjacent to the current region R, obtained
with morphological dilatation: C = (R
⊕
E
S
) − R where
⊕
represents a
morphological dilatation with a 3x3
structuring element E
S
b. K-Mean (K=2) step. Compute C
2
, which
is the region of pixels that have an
estimator closer to the mean of R than the
mean of the normal skin area: C
2
= |E −
E
N
| > |E –
R
)| where E
R
is the mean
estimator over the area R
c. Update R : R = R
⋁
(C
⋀
C
2
)
Developing a Robust Estimator for Remote Optical Erythema Detection
117

5. Repeat step 4 until R has no new pixels
6. To improve the accuracy of the results, the
noise was removed using open morphological
operations on R.
Here the first term 𝐸
) is the mean of the
estimator for the normal skin, 𝜎𝐸
is the standard
deviation of the normal skin, z is a model parameter
(z-score).
The segmentation algorithm was applied to all
estimators under consideration.
2.4 Performance Evaluation
Labeled images were processed using the
segmentation algorithm for each estimator under
consideration and compared with the ground truth
(manually labeled images).
If the algorithm identified a pixel as erythema,
and it was labeled as erythema, then it was marked as
true positive (TP).
If the algorithm identified a pixel as erythema,
and it was not labeled as erythema, then it was marked
false positive (FP). If a pixel was not identified as
erythema; however, it was labeled as erythema, we
assign it to false negative (FN). Finally, if a pixel was
neither identified nor labeled as erythema, it was
marked as a true negative (TN).
Thus, for each image, we can calculate sensitivity
(true positive rate or TPR=TP/(TP+FN)) and
specificity (true negative rate or TNR=TN/(TN+FP)).
To find an optimal performance, we assessed
performance at different values of z-score and built
ROC (receiver operating characteristic) curves.
3 RESULTS
To compare estimators' performance, we calculated
sensitivity and specificity for several values of z (see
Table 1) and plotted ROC curves (see Figure2).
One can see that the a*-based estimator provides
the best prediction values. However, the performance
of diff (R-G) and log (log(R/G)) estimators follows it
closely.
4 DISCUSSION
Here we presented a pilot evaluation of potential
estimators, which can be derived from a regular RGB
image. While all estimators demonstrated reasonable
sensitivity and specificity, the a*- based estimator
outperformed the log(R/G) and R-G estimators. Thus,
transformation to another color space (namely,
CIELAB) provides some benefits. It also should be
noticed that results are relatively consistent in the
wide range of z-score (at least 1<z<3). It is a positive
sign, which indicates that it is probably not a spurious
finding.
The results are also in good agreement with
findings reported by other groups (Roullot, 2005).
A variety of factors can impact the accuracy of the
proposed approach. Firstly, various smartphones
have different color-correction mechanisms (auto
white balancing, AWB). Thus, disabling AWB can be
helpful to standardize colors. Secondly, the results
may be influenced by ambient illumination. Finally,
the comparison with ground truth can be problematic
for dark skin tones (e.g., V and VI). For example, it is
challenging to label erythema on dark skin. Other
means (for example, induced erythema) have to be
used instead of labeled images.
In future work, we plan to validate the algorithm
by studying the induced erythema on volunteers. In
particular, we plan to correlate algorithm
performance with skin tone. We also plan to compare
the performance of these estimators with CNN-based
classifiers.
Table 1: Performance of estimators at several z-scores.
Estimator log (R/G) R-G a*
Z-score Sensitivity Specificity Sensitivity Specificity Sensitivity Specificity
Z=1.0 0.811 0.767 0.836 0.78 0.862 0.836
Z=1.5 0.806 0.783 0.836 0.78 0.861 0.842
Z=2.0 0.806 0.783 0.836 0.781 0.86 0.842
Z=3.0 0.807 0.786 0.727 0.817 0.859 0.844
BIOIMAGING 2021 - 8th International Conference on Bioimaging
118
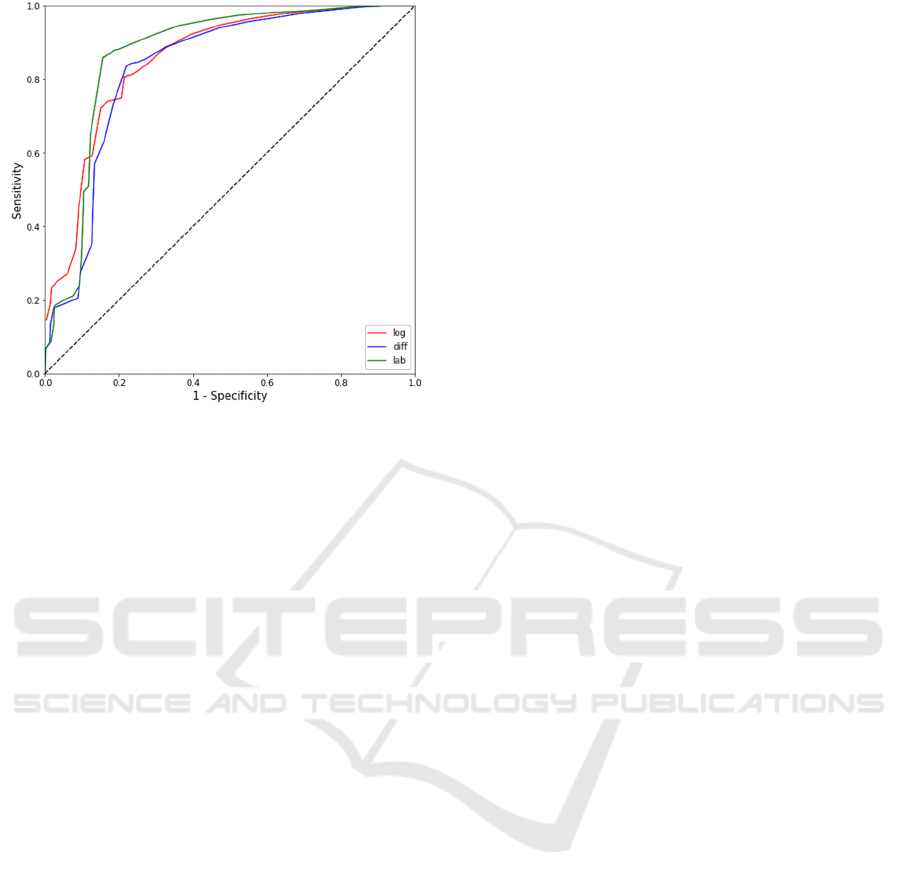
Figure 2: ROC curves for three estimators: R-G (blue
curve), log(R/G) (red curve), and a* (green curve).
5 CONCLUSIONS
We have analyzed the performance of several simple
estimators for erythema detection in realistic settings.
The preliminary data shows that smartphone cameras
can delineate erythema with reasonable sensitivity
and specificity. The approach can be implemented
using an inexpensive imaging setup (e.g.,
smartphone) and can be used in any setting.
ACKNOWLEDGEMENTS
The authors are thankful to Dhanesh Ramachandram
for help with the dataset.
REFERENCES
Hagisawa, S., Ferguson-Pell, M., Cardi, M., et al., 1994.
Assessment of skin blood content and oxygenation in
spinal cord injured subjects during reactive hyperemia.
J Rehabil Res Dev 31(1):1-14
Riordan, B., Sprigle, S., Linden, M., 2001. Testing the
validity of erythema detection algorithms. J Rehabil
Res Dev 38(1): 13-22.
Mukherjee, R., Manohar, D. D., Das, D. K., et al., 2014.
Automated tissue classification framework for
reproducible chronic wound assessment, BioMed
Research International, vol. 2014, Article ID 851582.
Wang, C., Yan, X., Smith X., et al., 2015. A unified
framework for automatic wound segmentation and
analysis with deep convolutional neural networks, in
Proceedings of the 2015 37th Annual International
Conference of the IEEE Engineering in Medicine and
Biology Society (EMBC '15), pp. 2415–2418.
Veredas, F., Mesa, H., Morente, L., 2010. Binary tissue
classification on wound images with neural networks
and bayesian classifiers, IEEE Transactions on Medical
Imaging, vol. 29, no. 2, pp. 410–427.
Li, F., Wang, C., Liu, X., et al., 2018. A Composite Model
of Wound Segmentation Based on Traditional Methods
and Deep Neural Networks, Computational
Intelligence and Neuroscience, vol. 2018, Article ID
4149103.
Brancati, N., De Pietro, G., Frucci, M., et al., 2017. Human
skin detection through correlation rules between the
YCb and YCr subspaces based on dynamic color
clustering, Computer Vision and Image Understanding,
vol. 155, pp. 33–42.
Hsu, R.-L., Abdel-Mottaleb, M., Jain, A. K., 2002. Face
detection in color images, IEEE Transactions on
Pattern Analysis and Machine Intelligence, vol. 24, no.
5, pp. 696–706.
Diffey, B.L., Farr, P.M., 1991, Quantitative aspects of
ultraviolet erythema. Clin Phys Physiol Meas
12(4):311-25
Tronnier, H., Evaluation and measurement of ultraviolet
erythema. In: F Urbach (editor). Biologic effects of
ultraviolet radiation. Oxford: Pergamon Press; 1969. p.
255-66.
Roullot, E., Autegarden, J.E., Devriendt, P., et al., 2005.
Segmentation of Erythema from Skin Photographs for
Assisted Diagnosis in Allergology. International
Conference on Advances in Pattern Recognition, p.754-
763.
Developing a Robust Estimator for Remote Optical Erythema Detection
119
