
Canopy: A Learning-based Approach for Automatic Low-and-Slow
DDoS Mitigation
Lucas Cadalzo, Christopher H. Todd, Banjo Obayomi, W. Brad Moore and Anthony C. Wong
Two Six Labs, Arlington, VA, U.S.A.
Keywords:
Network Defense, Distributed Denial of Service, LSDDoS, Machine Learning.
Abstract:
In a low-and-slow distributed denial-of-service (LSDDoS) attack, an adversary attempts to degrade the server
with low-bandwidth requests specially crafted to slowly transmit data, consuming an inordinate amount of
the server’s resources. This paper proposes Canopy, a novel approach for detecting LSDDoS attacks by
applying machine learning techniques to extract meaning from observed patterns of TCP state transitions.
While existing works have presented techniques that successfully mitigate different examples of LSDDoS
attacks, Canopy has uniquely shown the ability to mitigate a diverse set of LSDDoS attacks, including never-
before-seen attacks, all while maintaining a low false positive rate. Canopy is able to detect and mitigate
low-and-slow attacks accurately and quickly: our tests find that attacks are identified during 100% of test
runs within 650 milliseconds. Server performance is restored quickly: in our experimental testbed, we find
that clients’ experience is restored to normal within 7.5 seconds. During active attack mitigation, which only
occurs during server performance degradation indicative of an attack, Canopy exhibits minimal erroneous
mitigative action applied to benign clients as it achieves a precision of 99%. Finally, we show that Canopy’s
capabilities generalize well to LSDDoS attacks not included in its training dataset, identifying never-before-
seen attacks within 750 milliseconds.
1 INTRODUCTION
Distributed denial-of-service (DDoS) attacks remain
a pervasive cybersecurity threat with impacts that vary
from minor nuisances, e.g. knocking rivals offline in
online competitive games (Plante, 2015), to national
security, as when the nation-state of Georgia’s Inter-
net was disrupted ahead of a Russian land invasion in
2008 (Markoff, 2008). DDoS attacks are a perennial
and widespread problem: in a seminal paper (Moore
et al., 2006) on the enumeration of DDoS attacks,
Moore described the observation of 68,000 such at-
tacks between 2001 and 2004. The NetScout Threat
Intelligence Report for the second half of 2018 (Modi,
2018) estimated monthly DDoS attacks numbering in
the hundreds of thousands.
Traditional DDoS attacks attempt to overwhelm a
service by transmitting such a large volume of traffic
that the server is unable to handle all of the requests
it receives, including those of legitimate clients. If
the attacker is able to generate more traffic than the
service can handle, the service will be forced to drop
requests.
Today, various commercial services such as Aka-
mai and CloudFlare are effective in mitigating these
kinds of attacks. In 2016, a world-record-setting, 620-
Gbps DDoS attack was mounted against KrebsOnSe-
curity.com; however, this attack was unsuccessful, ab-
sorbed by Akamai’s DDoS mitigation service (Krebs,
2016). Volumetric attacks are also quite expensive
to launch. A recent study found that a small, 1,000-
machine DDoS attack costs on the order of $25 per
hour (Makrushin, 2013), an attack that would be all-
but-unnoticed by a service with DDoS protection.
In addition to their high cost, volumetric attacks
are also relatively easy to detect due to the abnormal
increase in traffic volume they entail. In comparison,
low-volume attacks send smaller amounts of data and
can more easily evade detection systems.
Low-volume or low-rate attacks stealthily degrade
server performance through cleverly crafted transmis-
sions of data. While these terms encompass a wide
body of DDoS approaches, our work focuses on a
subset of this category called low-and-slow attacks.
These attacks slowly send small streams of data that
keep connections alive for long periods of time, ty-
ing up server resources throughout the process. There
356
Cadalzo, L., Todd, C., Obayomi, B., Moore, W. and Wong, A.
Canopy: A Learning-based Approach for Automatic Low-and-Slow DDoS Mitigation.
DOI: 10.5220/0010192303560367
In Proceedings of the 7th International Conference on Information Systems Security and Privacy (ICISSP 2021), pages 356-367
ISBN: 978-989-758-491-6
Copyright
c
2021 by SCITEPRESS – Science and Technology Publications, Lda. All rights reserved

are different ways in which attackers can utilize this
kind of traffic to create a denial-of-service condi-
tion. At the application layer, they can exhaust web
servers through specially crafted HTTP requests. At
the transport layer, attackers can exploit vulnerabili-
ties in the TCP stack. We will detail the scope of the
low-and-slow attacks we employ in Section 3.1.2.
The relatively low resource requirement for
mounting a low-and-slow attack has two important
consequences. First, the potential for abuse is much
higher as the barrier to launching an attack is reduced.
Additionally, these attacks are more difficult to de-
tect since they are not characterized by large bursts
of traffic. LSDDoS attacks not only expose vulner-
able Internet services to lower-resourced adversaries,
but also present a distinct advantage for adversaries
against whom defenders were previously on equal
footing.
Canopy is designed to protect services from such
attacks, both detecting and, importantly, mitigating
LSDDoS adversaries in real-time. We present what
we believe is the first application-agnostic defense for
mitigating a diverse set of low-and-slow attacks, in-
cluding attacks not represented in the defense’s train-
ing dataset, or signature database.
2 BACKGROUND
Denial-of-service attacks have been a persistent threat
in the computer security space for decades; as such,
a large volume of research toward mitigating their
threat has developed. Denial-of-service attacks whose
efficacy is based on raw volume of data have estab-
lished effective methods of mitigation (Tripathi and
Mehtre, 2013; Specht and Lee, 2003). The cost of
these methods generally scales with the size of the at-
tack, though research (Fayaz et al., 2015) into making
these methods more efficient continues.
The focus of this paper, however, is not on these
”brute-force” denial-of-service attacks. We also seek
to distinguish our work from research on low-volume
attacks that induce congestion through periodic bursts
or ”pulses” of traffic (Kuzmanovic and Knightly,
2003; Zhang et al., 2012; Zhou et al., 2017). Our
work pertains specifically to low-and-slow attacks,
whose efficacy stems from requests crafted to ex-
haust its target’s resources through low-bandwidth,
slow transmissions of data. Despite progress made
in the research community, defense against low-and-
slow attacks remains an open problem. This section
reviews LSDDoS research within the context of these
key characteristics of an effective solution:
1. Operates in real-time
2. Is not tied to a specific application
3. Can detect a variety of low-and-slow attacks
4. Can detect low-and-slow attacks not included in
signature database
Real-time Detection. Considering that the ultimate
goal in DDoS detection is the mitigation of attacks, it
is imperative that a viable detection system operates
in real-time. Siracusano et al (Siracusano et al., 2018)
extract TCP statistics for benign and malicious flows,
including multiple low-and-slow attacks: slowread,
slowheaders, and slowbody. The experiments reveal
that, given this set of features, decision trees and KNN
algorithms are able to achieve very high accuracy in
detecting malicious flows. The fact that these attacks,
which exploit vulnerabilities at the application layer,
yield highly separable transport-layer features is a no-
table finding that is corroborated by our work. The
real-world applicability of this approach is limited,
however, by the fact that features are obtained through
post-processing steps following the capture of net-
work traffic, rather than in real-time.
Sharafaldin et al (Sharafaldin et al., 2018) intro-
duced the CICIDS2017 dataset, a widely-used public
source of LSDDoS traffic. The authors additionally
trained various classifiers on features extracted from
their experiments in a post-processing fashion. While
the high accuracy of these models provides evidence
as to possible features to include in a mitigative de-
fense, the offline manner in which features were ex-
tracted limits the direct utility of such a solution. The
dataset is also limited in the scope of LSDDoS attacks
it contains, as well as by the fact that attackers and be-
nign clients target different services.
Application Agnosticism. An additional considera-
tion when assessing the utility of LSDDoS solutions
is the degree of versatility with regard to the applica-
tions it protects. FINELAME (Demoulin et al., 2019)
detects low-and-slow attacks, such as Slowloris,
through the use of probes that identify anomalous re-
source utilization. This approach, however, requires
host-based instrumentation of executable code upon
installation, as well as componentization of the pro-
tected application. FINELAME’s performance is also
dependent on the K-means algorithm parameter that
needs to be altered depending on the number of re-
quest types in the application. We seek to design a
system that is easily portable to new environments
and not tied to any one application.
Robustness to Attack Diversity. An important at-
tribute of any LSDDoS defense is the ability to detect
a variety of low-and-slow attacks that differ in nature.
Attacks can be conducted at both the transport layer
Canopy: A Learning-based Approach for Automatic Low-and-Slow DDoS Mitigation
357

and, more commonly, the application layer. Within
the scope of application layer LSDDoS, attackers can
exploit the HTTP protocol through varying means in-
cluding slowly reading server responses, slowly send-
ing packets, opening many partial connections, and
requesting large numbers of overlapping byte ranges.
Smart Detection (Lima Filho et al., 2019) presents
a detection system that, from pcap files, extracts
statistics on IP lengths, source and destination ports,
as well as TCP flags. These features are then input
into a random forest model. The model achieves high
accuracy on a dataset that consists primarily of flood-
ing attacks, but also includes HTTP-based LSDDoS
attacks. It remains inconclusive, though, whether
Smart Detection can defend against LSDDoS attacks
that are not HTTP-based, such as Sockstress. Addi-
tionally, since the vast majority of instances in the
dataset are from flooding attacks, its performance on
LSDDoS is difficult to evaluate absent a breakdown
of results by attack type.
Detection of Unknown Attacks. Methods for DDoS
detection can broadly be grouped into two categories:
anomaly-based and signature-based. Anomaly-based
systems identify attacks by developing a profile of be-
nign behavior and flagging traffic that deviates too
significantly from this profile (Demoulin et al., 2019;
Ranjan et al., 2008; Wang et al., 2017). While these
systems are thus naturally suited to detect new or un-
known attacks, they often suffer from high false posi-
tive rates.
Signature-based methods entail building a dataset
of benign and malicious traffic. These systems can
then identify attacks assuming the traffic exhibits sim-
ilar characteristics as the previously collected mali-
cious traffic. The downside of this approach is that
this assumption may not hold true for attacks not in-
cluded in the signature dataset (i.e. new or unknown
attacks). Given the constantly-evolving nature of LS-
DDoS threats, it is important that a real-world defense
can detect new or unknown attacks. Absent this capa-
bility, defenses would need to undergo expensive cy-
cles of data collection and model retraining whenever
new attacks surface.
Researchers can assess the ability of signature-
based methods to identify new or unknown attacks by
omitting certain attacks from the signature database.
Recent work follows this methodology and suggests
that signature-based methods have the potential to
detect DDoS attacks not included in the collected
dataset (Demoulin et al., 2018; Saied et al., 2016). We
seek to determine to what extent this holds true for
LSDDoS attacks specifically, including cases where
the omitted attack differs substantially in nature from
those in the signature database.
3 CONTRIBUTION AND
METHODOLOGY
This section describes our LSDDoS defense, Canopy,
in detail. First, we introduce our custom testbed, in-
cluding the myriad components and parameters that
allow us to experiment with different test scenarios.
We then detail our novel data featurization process
that enables us to extract rich information from TCP
state sensors in real-time. Next, we discuss how our
detection and mitigation engines work to protect the
system under test. In Section 3.4, we describe the
machine learning techniques we employ to make pre-
dictions based on the data we generate. Finally, in
Section 3.5, we discuss our experimental setup, de-
tailing how test runs are configured, as well as how
data is selected for training and validation
3.1 Architecture
To evaluate our defenses, we test attacks on a cus-
tom testbed with a virtual network connecting con-
tainerized instances of our server, clients, attackers,
and other necessary utility applications. We refer
to instances of a test as test runs, which are config-
ured in test plans that include the following param-
eters: number and type of clients, type and severity
of attack (e.g. number of threads, size of packets,
requests per second), the event timing of the run, a
victim system-under-test, and whether mitigation is
enabled. Containers are provisioned by Mesosphere
DC/OS
1
, through a custom test orchestration suite
that provides scheduling of the various containers dur-
ing each test run, job queue management, and exper-
iment creation via our custom management UI. We
use three machines for testing, each with a 28-core
Intel(R) Xeon(R) CPU E5-2660 v4 CPU @ 2.00GHz
and 128GB of RAM.
The containers we use in experimental test runs
are as described below. Test runs consist of three main
entities: the system subjected to attack, the attack-
ers, and legitimate clients attempting to obtain service
from that system.
3.1.1 System-Under-Test
For our work, we choose Apache HTTP Server
with WordPress as our System-Under-Test (SUT). We
choose this stack for two reasons: first, it is widely
used on the web, ensuring our system has wide ap-
1
DC/OS is an open-source, distributed operating system
based on the Apache Mesos distributed systems kernel that
provides networking, service discovery, and resource man-
agement
ICISSP 2021 - 7th International Conference on Information Systems Security and Privacy
358
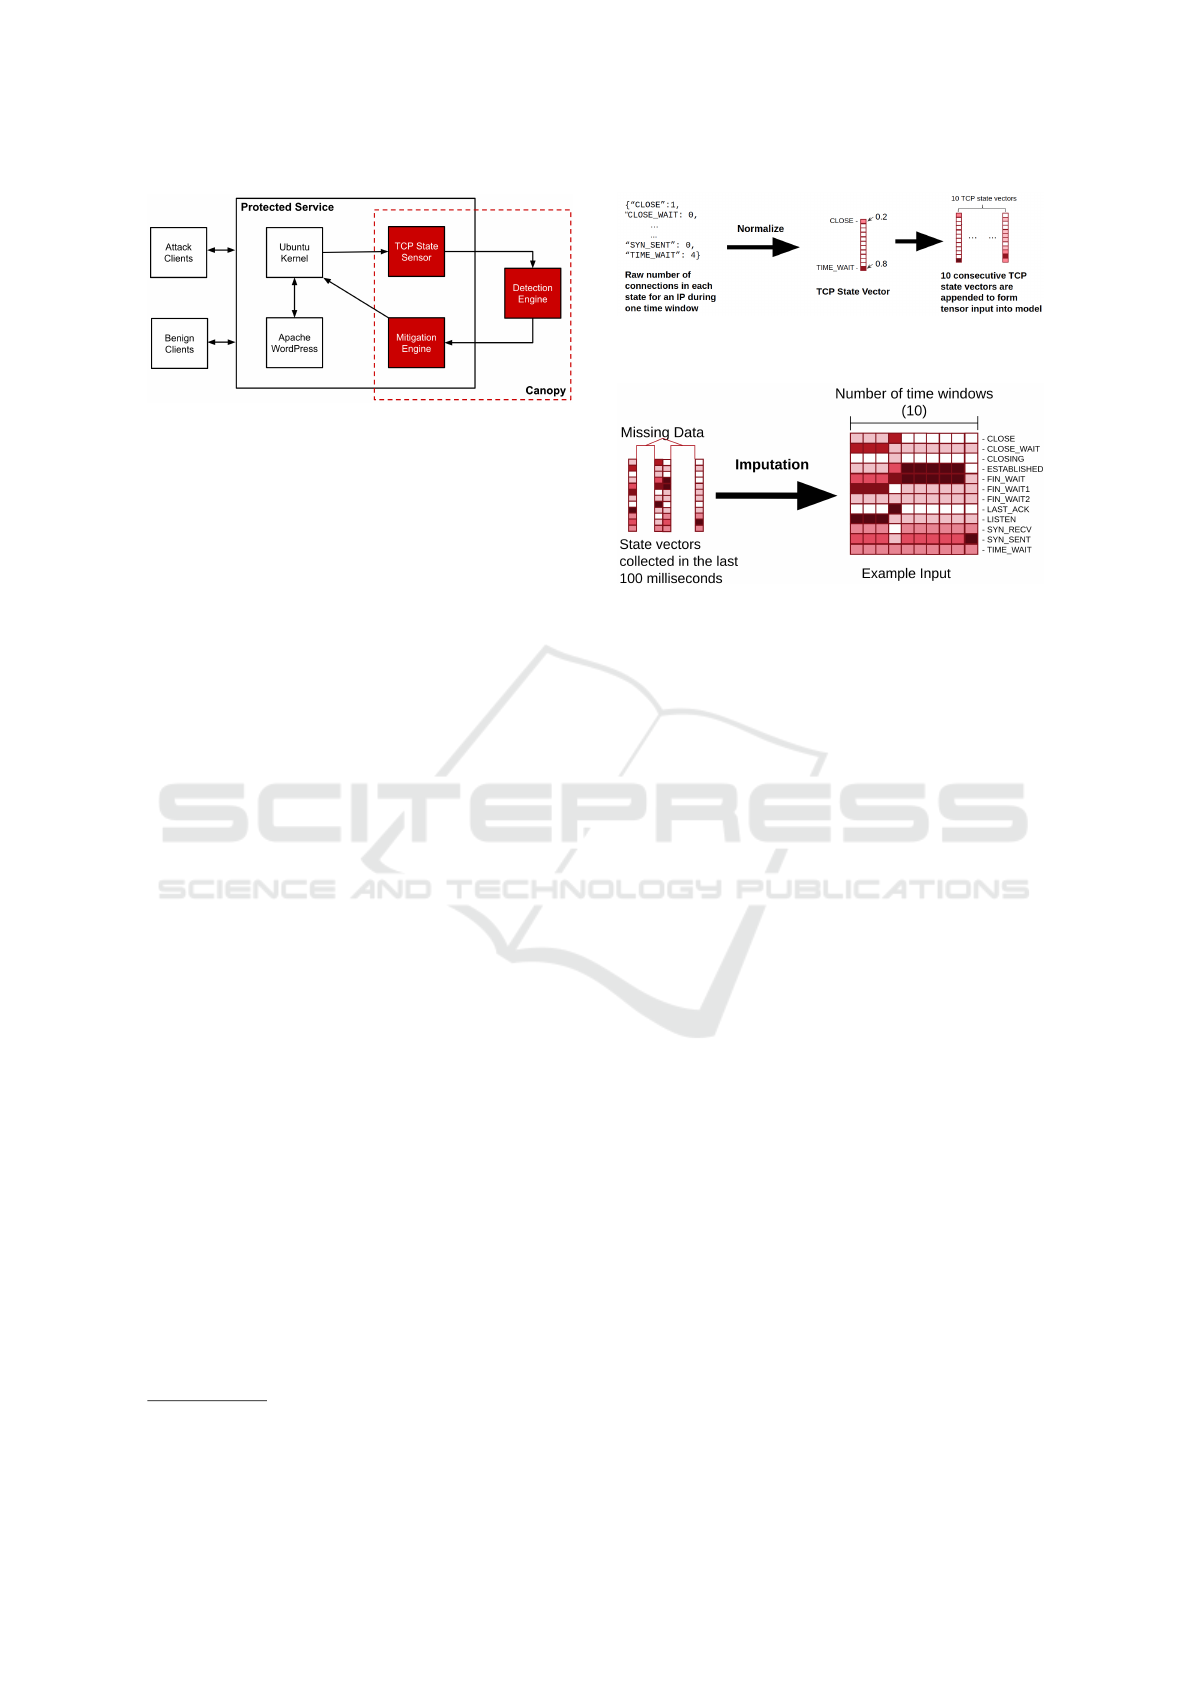
Figure 1: Canopy system architecture.
plicability even before considering the agnosticism of
the techniques used. Second, there is a substantial
set of known LSDDoS attack implementations for this
stack. We specifically use Apache 2.2.11 for its vul-
nerability to the set of attacks we wish to test. SUTs
are configured with 8 CPUs and 16GB of RAM. SUTs
are based on stock Ubuntu 14.04 with minimal ad-
ditions other than of the aforementioned server stack
and a lightweight TCP state sensor, which uses the
conntrack
2
user space daemon to capture TCP con-
nection state changes.
Note that while our evaluation focuses on a par-
ticular web server, no aspect of Canopy is tailored
to this particular application. Furthermore, we em-
phasize that while the version of Apache we use has
been superceded, and the attacks we test on largely
mitigated, our techniques are not specific to this ap-
plication, version, or these attacks. Rather, we show
that Canopy is capable of detection and mitigation of
a given attack despite not having seen it before.
3.1.2 Attack and Client Containers
During simulation, attacks are carried out by one
of six types of test containers, each with eight pre-
determined levels of intensity. The set of imple-
mented attack images consists of Slowloris (Valialkin,
2014), R U Dead Yet (Shekyan, 2011), Slow
Read (Shekyan, 2011), Apache Killer (Stampar,
2011), Sockstress (Hornby, 2012), and a second im-
plementation of Slowloris (Shekyan, 2011). The se-
lection of attacks warrants careful consideration, as
we seek to employ attacks that differ in the means by
which they induce congestion. Sockstress attempts to
exhaust the SUT’s resources by means of TCP pro-
tocol exploitation, while the other attacks accomplish
this end by exploiting different aspects of the HTTP
protocol. As we will show, TCP state transition pat-
terns are affected even in the case of an attack exe-
cuted at the application layer, for example, by a TCP
connection being held longer in the ESTABLISHED
2
conntrack is a set of user space tools allowing interac-
tion with the kernel connection tracking system
Figure 2: Transforming conntrack sensor data into TCP
state vectors.
Figure 3: Imputing missing time windows using a ”sample
and hold” approach.
TCP state during a slow HTTP request. The differing
targets of these attacks help us ensure that Canopy’s
usefulness is not dependent on the protocol being ex-
ploited.
In our simulations, synthetic legitimate-user traf-
fic is generated by HTTP request agents that mimic
human behavior. These customized agents, based on
Locust (Bystr
¨
om et al., 2019), continuously browse
the SUT, traversing randomly from link to link within
the hosted WordPress site. Locust allows us to easily
scale the number of clients per container and their rate
of activity. We also use Noisy (Hury, 2019), a website
crawler whose intended purpose is to add ”noise” to
mask a user’s web browsing patterns. While these two
methods of traffic generation are similar in intent, im-
plementation details can cause differences in the TCP
state transition patterns they exhibit, hence the inclu-
sion of both.
3.2 TCP State Data Featurization
This section describes the steps we take to convert raw
TCP sensor data into a form that can be input into a
detection model. Figure 1 shows these steps in re-
lation to the overall system. The key components of
this featurization pipeline are our TCP state sensor,
our data transformation process, and finally our im-
putation engine.
3.2.1 TCP State Transition Sensor
As mentioned in Section 3.1.1 and depicted in Fig-
ure 1, data is captured from the TCP state sensor co-
located with the SUT. This sensor utilizes conntrack
Canopy: A Learning-based Approach for Automatic Low-and-Slow DDoS Mitigation
359

on the host, identifying TCP state transitions in con-
nections to the SUT. These transition messages are
sent to an Apache Kafka cluster, leading to the next
part of our pipeline: the data transformation step.
3.2.2 Transformation
At this step of the process, the various TCP state tran-
sition messages sent by the sensor are aggregated into
summary statistics for 100 milliseconds time win-
dows for each IP. This component of our system gath-
ers all the messages for an IP in a time window, and
then outputs a vector containing the percentage of the
IP’s open connections in each TCP state. For each
IP, we append 10 consecutive 100 milliseconds time
window vectors to form an array that’s input into a
classifier. Figure 2 provides an example of how this
process works. While the window size and number
of windows that form an array are tunable parame-
ters, we selected these values based on the intuition
that the malicious behavior of an LSDDoS attack will
manifest itself in TCP states in less than a full sec-
ond (ten 100 millisecond time windows). In the future
we aim to empirically test the performance exhibited
when varying these parameters, as discussed in Sec-
tion 5.4 Limitations and Future Work.
3.2.3 Imputation
While we mentioned in the previous section that 10
consecutive time window vectors are appended for an
IP to form an input array, it is often the case that the
transformation engine does not receive data from the
TCP state sensor for a given IP during a time win-
dow. This occurs whenever an IP does not experience
any TCP state changes during a time window. In this
event, the missing window of data is imputed by fill-
ing in the most recent TCP state vector outputted by
the transformation engine for the IP. This ”sample and
hold” approach is depicted in Figure 3.
During experimental runs used to generate train-
ing data, the imputed arrays are serialized and stored
in MinIO
3
. These arrays can later be converted from
serialized format into different forms necessary for
training models.
3.3 Inference and Mitigation Engines
Once the data exists in a form suitable for input into
a model, the next step is to classify examples as be-
nign or malicious. These predictions are fed into our
mitigation engine, which takes the steps necessary to
3
MinIO is an open-source cloud data storage service re-
leased under Apache License v2.
protect the SUT. Figure 1 again shows how these pro-
cesses relate to Canopy as a whole.
With mitigation enabled, imputed data is passed
along in real-time to an inference engine that makes a
prediction on each array by running the input through
a loaded model. The first time an IP is seen by the in-
ference engine, its predicted class (benign or attack)
is sent to the mitigation engine. From that point for-
ward, a prediction is sent to the mitigation engine only
if the predicted class differs from the most recent pre-
diction for that IP.
The mitigation engine is co-located with the SUT
and is responsible for consuming prediction mes-
sages and mitigating attack IPs. When a new predic-
tion is received, the mitigation engine adds or drops
iptables
4
filter rules to deny or allow traffic for the
classified IP.
3.4 Learning Methods
Our work aims to differentiate between malicious and
benign traffic using a supervised learning approach,
using features extracted from the temporal patterns of
TCP state transitions. Our experiments include three
different methods of varying complexity for our clas-
sification model: temporal convolutional networks
(TCNs), decision trees, and an ensemble approach.
TCNs are a special case of convolutional neural
networks designed to learn meaningful relationships
between temporally-related features, and we include
this algorithm due to its success on tasks featuring
temporal data (Bai et al., 2018). We evaluate decision
trees because they have proven effective in LSDDoS
detection, and have even been shown to outperform
neural networks (Siracusano et al., 2018; Lima Filho
et al., 2019). The success of decision trees in our
initial experiments prompted us to also build an en-
semble of simpler classifiers (decision trees, random
forests, and logistic regression) in an attempt to im-
prove model robustness. To combine predictions from
the components of the ensemble, we simply average
the output probabilities.
3.5 Experimental Setup
In this section, we discuss the experimental condi-
tions under which we train and test Canopy.
Test Run Configuration. As mentioned in Sec-
tion 3.1, our experimental testbed suite allows for the
specification of many different parameters of each test
run, including attack type, intensity of attack, client
type(s), and whether mitigation is enabled. For each
4
iptables is a user space program allowing configuration
of the kernel firewall
ICISSP 2021 - 7th International Conference on Information Systems Security and Privacy
360

attack and attack level, we generate test runs includ-
ing all Locust clients, all Noisy clients, and an even
mix of both. Mitigation is disabled for the generation
of training data and is activated only to evaluate how
well models are protecting the SUT.
Global vs. N-1 and N-2 Experiments. In a global
experiment, we include data from all test run config-
urations in the training set. This means, of course,
that for any data the model is evaluated on, the model
has been trained on data generated using the same test
run configuration. This experiment tests how well a
model detects known attacks.
To understand how a model would respond to un-
known attacks, we conduct two other types of experi-
ments. In an N-1 experiment, we leave one attack type
out of the training set. For example, in a Sockstress
N-1 experiment, we train the model on data from all
test run configurations except those that contain Sock-
stress attackers. This kind of experiment simulates an
unknown attack by excluding an attack (in this case,
Sockstress) from the training set, but testing against
it in the validation set. The N-2 experiments follow
the same logic, except we exclude two attack types
from the train set, testing the models’ ability to gen-
eralize given an even further limited set of attacks to
train on. These experiments demonstrate the general-
izability of Canopy, which is critically important to its
practical utility, given that new LSDDoS attack vec-
tors will continue to be discovered and abused.
4 EVALUATION
In this section, we discuss our performance evaluation
of Canopy. In Section 4.1, we cover the detection
metrics used to evaluate our models and provide re-
sults for different experiments. Next, in Section 4.2,
we define the mitigation metrics used to assess our
system in a practical test setting, providing results for
how well Canopy protects the SUT.
Before diving into the specifics of detection and
mitigation metrics, we highlight two key distinctions
when understanding our results:
Per-example vs. Per-client. First, the detection met-
rics we will discuss in Section 4.1 show AUC, pre-
cision, and recall computed on a per-example basis.
If, for example, one of 50 examples from a benign
Table 1: Mean detection results for global models, averaged
over each attack.
Method AUC Precision Recall
Decision Tree 0.99 0.99 0.95
Ensemble 0.99 0.99 0.95
TCN 0.96 0.91 0.91
client is classified as malicious, this constitutes a per-
example false positive rate of 2%. On the contrary, the
per-client false positive rate describes what percent of
benign clients are classified as malicious at least once
during the run. Using the previous example, if that
benign client is the only benign client, we would have
a per-client false positive rate of 100%.
Disabling vs. Enabling the Mitigation Engine. Sec-
ond, detection metrics (unless explicitly stated other-
wise) are computed from test runs where mitigation
is disabled and the SUT is left unprotected. This pro-
cess of evaluation is necessary to assess models be-
fore they are inserted into the mitigation engine. Im-
portantly, this means that these metrics are a function
of flagged-IP examples that reach the system before,
during, and after the occurrence of an attack. On
the contrary, mitigation metrics are of course com-
puted with mitigation enabled. Thus, IPs flagged as
malicious get blocked and no longer impact the met-
rics computed. To understand why this difference is
important, consider a model that struggles to detect
the onset of a attack, but correctly identifies attack-
ers long after they’ve had their effect. Such a model
would yield poor mitigation metrics, but its detection
metrics would be inflated by parts of the run not con-
taining the onset of the attack.
4.1 Detection Results
Global Results. In Table 1, we observe the results of
the global experiments. Each global model is evalu-
ated on all attacks at varying levels, and the results
are averaged over the different attacks. The results
indicate that the ensemble and decision tree perform
very similarly, both outperforming the TCN in AUC,
precision, and recall.
N-1 Results. In these experiments (results illustrated
in Table 2), we find that the ensemble classifier stands
out as the best performing method with a precision
of 0.99, compared to 0.92 and 0.89 for the TCN and
decision tree classifiers, respectively. While TCN’s
recall of 0.91 exceeds those of the ensemble and deci-
sion tree methods, both 0.89, this metric is less critical
than precision in our context. The reasoning for this is
that false positives cause benign clients to be blocked,
and while false negatives may delay the mitigation of
an attack, Canopy can flag the attacker at subsequent
Table 2: Mean detection results on a single never-before-
seen attack, averaged over all N-1 models.
Method AUC Precision Recall
Decision Tree 0.92 0.89 0.89
Ensemble 0.95 0.99 0.89
TCN 0.94 0.92 0.91
Canopy: A Learning-based Approach for Automatic Low-and-Slow DDoS Mitigation
361

data examples it receives. Notably, the absolute per-
cent decrease in AUC, precision, and recall for the de-
cision trees in comparison to the global experiments
is 0.07, 0.10, and 0.06 respectively.
N-2 Results. For the N-2 experiments, we sample five
different subsets of attacks, each time omitting two
attacks from the training set. We then evaluate each
trained model on the two attacks omitted from its re-
spective training set. The results are averaged over all
five models for each method and can be found in Ta-
ble 3. The ensemble method again finishes with the
highest precision at 0.99. Its AUC of 0.96 also ex-
ceeds the TCN’s and decision tree’s AUC’s of 0.95
and 0.89 respectively.
Effect of Attack Type on Performance. We evalu-
ate each global model, averaging over the three learn-
ing methods, on all attacks and observe how perfor-
mance is dependent on the attack type. These results
are depicted in Table 4. Notably, Canopy’s perfor-
mance against Sockstress is on par with the HTTP-
based attacks, exemplifying Canopy’s application-
agnosticism.
The detection results indicate that Apache Killer
is the most challenging attack for Canopy to detect.
While the recall for all other attacks ranges between
0.95 and 0.98, Apache Killer is identified with a re-
call of 0.77. Though our detection metrics indicate
weak performance against Apache Killer with miti-
gation disabled, in operation with mitigation active,
recall rises from 0.77 to 0.98. This observation of-
fers a key insight: Canopy is able to identify an attack
like Apache Killer as it is ramping up and mitigates
it before later stages of the attack cause confusion for
the model. This also demonstrates that Canopy can
perform significantly better during practical operation
than what may be reflected in detection metrics absent
mitigating action. This leads us to our mitigation met-
rics, which will be discussed in the following section.
4.2 Mitigation
To evaluate Canopy’s mitigation capability, we mount
an Apache Killer attack campaign against a specified
SUT and measure client experience throughout the
test run. We focus on the Apache Killer attack as it
represents a likely lower bound for Canopy’s mitiga-
tive performance, given the results in Table 4. We ex-
Table 3: Mean detection results on multiple never-before-
seen attacks, averaged over all N-2 models.
Method AUC Precision Recall
Decision Tree 0.89 0.92 0.86
Ensemble 0.96 0.99 0.86
TCN 0.95 0.95 0.86
amine global and N-1 models in mitigation, for each
learning method. In this section, we first define our
mitigation policies. Next, we describe the metrics we
use to evaluate mitigation, examine the results for our
experiments, and visualize the impact Canopy has on
a system.
4.2.1 Mitigation Policies
A risk associated with Canopy and other defensive
systems is the possibility of incorrectly identifying
a client as an attack (false positive). A fundamen-
tal design principle in developing Canopy is to favor
models and policies that would reduce false positives
and impact to benign users. One measure we take
to this end is the implementation of a classification
strike policy; the inference engine will not take de-
fensive action unless the active model classifies an IP
as an attacker for multiple consecutive examples. Fur-
thermore, Canopy forces increasing backoff on IP ad-
dresses classified as malicious. These IPs are blocked
for an increasing amount of time for every such clas-
sification by the model. This ensures that attackers
will continue to be mitigated for long periods of time,
while client IPs that are misclassified as an attack will
eventually return to normal response rates.
4.2.2 Description of Mitigation Metrics Used
We have presented Canopy as a practical lightweight
LSDDoS defense that is server application-agnostic
and easily deployable. As such, we evaluate not
only our models’ ability to classify IPs in mitigation-
disabled runs, but also the practical measurable ef-
fects of Canopy’s ability to mitigate attacks in defense
of a server. Specifically, we measure:
• the time to detect an attack campaign
• the time to mitigate the effects of an attack, with
benign clients’ experience returning to normal
• the per-client false positive rate
Time to Detect. We measure this value as the time
between the first TCP state transition reported from
an attacker IP and the time the model identifies an
attacker IP.
Table 4: Mean detection results for global models on each
attack, averaged over each method.
Attack AUC Precision Recall
Goloris/Slowloris 0.99 0.95 0.95
R.U.D.Y. 0.99 0.96 0.99
Slowread 0.99 0.97 0.99
Apache Killer 0.93 0.99 0.77
Sockstress 0.99 0.99 0.98
ICISSP 2021 - 7th International Conference on Information Systems Security and Privacy
362

Time to Mitigate. We measure the impact of an at-
tack by the time it takes for legitimate clients to inter-
act with the server. As our server is running a Word-
Press website, we measure this interaction by the time
it takes for the client to be served all content on a page
from the time that page was requested. We refer to
this measurement as Round-Trip Time, or RTT. When
we refer to a percentile RTT, we are referring to the
percentage of client requests in which the calculated
RTT is below a specified value. We consider an at-
tack to be mitigated when the RTT for client requests
return to normal levels. For each test run, a baseline
RTT is measured to determine the expected RTT that
a client will encounter when using the SUT during
non-attack conditions. A client’s experienced RTT is
considered to have returned to normal levels when it is
within one standard deviation of the baseline value.
5
4.2.3 Mitigation Results
Time to Detect. In global experiments, Canopy de-
tects the Apache Killer attack within 650 millisec-
onds. In N-1 experiments, the time to detect increases
to 750 milliseconds. Table 5 shows the average time it
takes for Canopy’s models to detect an attacker’s IP.
These metrics show that the models are identifying
patterns in how an attack communicates with a SUT
early in the attack, which is critical for mitigating in a
timely manner and reducing the impact on clients.
Time to Mitigate. After Canopy takes mitigating
action, the SUT begins to quickly recover, with client
request RTTs returning to pre-attack levels. In our ex-
periments, within 7.5 seconds, 90% of new requests
are served without impact. Table 6 shows the time
it takes for the average client request RTT to return
Table 5: Time to detect Apache Killer.
Experiment Time Since Attack
Campaign Start (ms)
Global DT 634
Global Ensemble 602
Global TCN 1925
N-1 DT 658
N-1 Ensemble 637
N-1 TCN 2009
5
The idea that we expect most or all clients to return to
within one standard deviation of a mean RTT may raise a
red flag for some readers. However, this assumption is rea-
sonable due to the way we evaluate client RTT. The stan-
dard deviation cutoff that creates the bounds for a ”normal”
RTT is calculated based on individual RTTs measured be-
fore the attack. A client’s experienced RTT, used to de-
termine whether that client is back to experiencing normal
RTTs, is calculated as the mean of a window of RTTs.
to pre-attack levels for different learning methods, at-
tacks, and experiment types.
Per-client False Positive Rate. Table 7 depicts false
positive rates computed on a per-client level and re-
veals that models generally have low false positive
rates. The most-performant model classifies under
5% of benign clients as attacks for a short period of
time (on average 4 seconds). Considering the duration
of these clients in our experiments, they thus spend
less than 0.1% of the time erroneously mitigated.
Moreover, during normal SUT operation where no at-
tack is degrading server performance, model classifi-
cations are ignored and yield no impact to the user.
Only when the SUT is being impacted by an attack
does the mitigation engine block clients.
4.2.4 Visualizing the Mitigative Effect of Canopy
To show the impact of Canopy on the benign clients of
a SUT, we visualize the following two aspects of user
experience: the distribution of TCP states, as well as
client RTT. We will do so for the following three sce-
narios: no attack campaign present, attack campaign
present with no defense, and attack campaign present
with Canopy active.
No Attack Campaign Present. First, we observe a
run of our experimental system without an active at-
tack campaign to establish a baseline of performance
characteristics under normal operation. As seen in
Figure 4, our test run with only benign connections in-
cludes sessions that transition normally through TCP
states and end in TIME WAIT. This is expected, as old
client connections are aged out after completed ser-
vice requests (page-loads of the WordPress site). Fig-
ure 5 also shows that, after a short start-up, the RTT
is steady for the duration of the run.
Attack Campaign Present, No Defense. Let us next
observe the effect of Apache Killer on the SUT with-
out Canopy active. In this scenario, the attack begins
50 seconds into the test run with a duration of 70 sec-
onds.
Without mitigation enabled, the attack impacts
service availability dramatically. The TCP state tran-
sition (Figure 6) and RTT graphs (Figure 7) show a
taxed server with behavior that diverges significantly
Table 6: Time to mitigate Apache Killer (seconds).
X% of Clients’ RTT Restored
Experiment 25% 50% 75% 90%
Global DT 5.54 5.54 5.76 5.76
Global Ensemble 5.92 5.98 6.14 6.24
Global TCN 6.57 6.63 6.78 7.11
N-1 DT 6.28 6.39 6.39 6.81
N-1 Ensemble 6.02 6.02 6.09 6.42
N-1 TCN 6.88 6.96 7.23 7.23
Canopy: A Learning-based Approach for Automatic Low-and-Slow DDoS Mitigation
363

from our expectations under non-attack conditions. In
Figure 6, we see the manifestation of Apache Killer
clearly in the TCP state data; as expected, there is
a saturation of TCP states like ESTABLISHED during
the attack. Figure 7 shows that the average RTT in-
creases from an approximate 250 millisecond base-
line to about five seconds during the lifetime of the
attack.
Attack Campaign Present, Canopy Active. Now, we
demonstrate how Canopy affects benign clients when
mitigation is enabled. We insert the global ensemble
model into our mitigation engine since Table 5 indi-
cates that this model achieves the fastest time to de-
tect.
Figure 8 and Figure 9 illustrate the TCP states of
open connections and RTTs during an attack cam-
paign with mitigation enabled, respectively. The TCP
and RTT trends for the run leading up to the start of
the attack campaign mirror that of a scenario with
Canopy disabled until the attack campaign is miti-
gated by the Canopy (at approximately t=57 in our
example). At this time, attack connections are filtered
out by the mitigation engine, allowing service avail-
ability to return to pre-attack levels. From this point
forward, the TCP state transitions and RTTs resemble
a scenario with no attack present.
It is critical to note that only a small percentage of
connections are affected by the attack when Canopy is
active. This can be observed in Figure 9: the 90th and
75th percentiles of average client RTTs spike while
the lower percentiles remain consistent near baseline
RTT for the duration of the experiment. The mod-
els and attacks tested all exhibit similar TCP and RTT
trends; the critical difference is that faster attack de-
tection and mitigation lead to quicker recoveries for
benign client performance.
Our mitigation results also show that Canopy
is effective at generalizing to new or unknown at-
tacks; Canopy detects attack campaigns even when
not trained on the particular type of attack. Though
the detection (and the subsequent mitigation) of an
attack when utilizing N-1 models is slightly delayed,
the SUT still recovers in a timely fashion. Detec-
tion time increases to 750 milliseconds when Apache
Table 7: Per-client false positive rate during Apache Killer
attack.
Experiment % of Benign Clients Mitigated
At Least Once During Test Run
Global DT 3.13
Global Ensemble 4.38
Global TCN 3.75
N-1 DT 2.50
N-1 Ensemble 2.35
N-1 TCN 6.88
Killer is held out from the training data, versus 650
milliseconds with a model trained with Apache Killer.
Recovery times for N-1 also increase by around one
second in comparison to global models.
5 DISCUSSION
In the previous section, we looked at the concrete re-
sults from our experimentation with Canopy. In this
section, we discuss these results in context, noting
some perhaps unexpected results, and examining the
potential impactfulness and practicality of Canopy in
the real world.
5.1 Comparing Performance of
Learning Methods
The detection and mitigation results presented in Sec-
tion 4 indicate that, overall, the ensemble method
achieves the best performance. In spite of their po-
tential to capture rich complexities and their specific
applicability to temporal data, TCNs are consistently
outperformed by ensemble and decision tree models
when inserted into our mitigation engine and eval-
uated for practical performance (i.e. our mitigation
metrics), as they can be susceptible to false posi-
tives and take significantly longer to mitigate attacks.
The efficacy of simpler machine learning methods is
a testament to the richness of the features extracted
through the TCP state data featurization process dis-
cussed in Section 3.2.
5.2 Generalizing to Never-Before-Seen
Attacks
The N-1 and N-2 results shown in Tables 2 and 3 re-
spectively indicate that Canopy is able to generalize
to never-before-seen attacks with minimal dropoff in
performance. This observation is further supported by
the minimal increase in the time to detect and mitigate
Apache Killer when using an N-1 model for mitiga-
tion, shown in Tables 5 and 6 respectively.
While the recall in the N-2 experiments decreases
to 0.86, the ensemble model maintains a precision of
0.99. This drop in recall doesn’t necessarily have an
adverse effect on practical performance, given that
Canopy need not correctly identify all examples from
an attacker to trigger mitigative action.
5.3 Comparison with Other Work
The comparison between Canopy and related work is
largely complicated by differences in datasets and ex-
ICISSP 2021 - 7th International Conference on Information Systems Security and Privacy
364
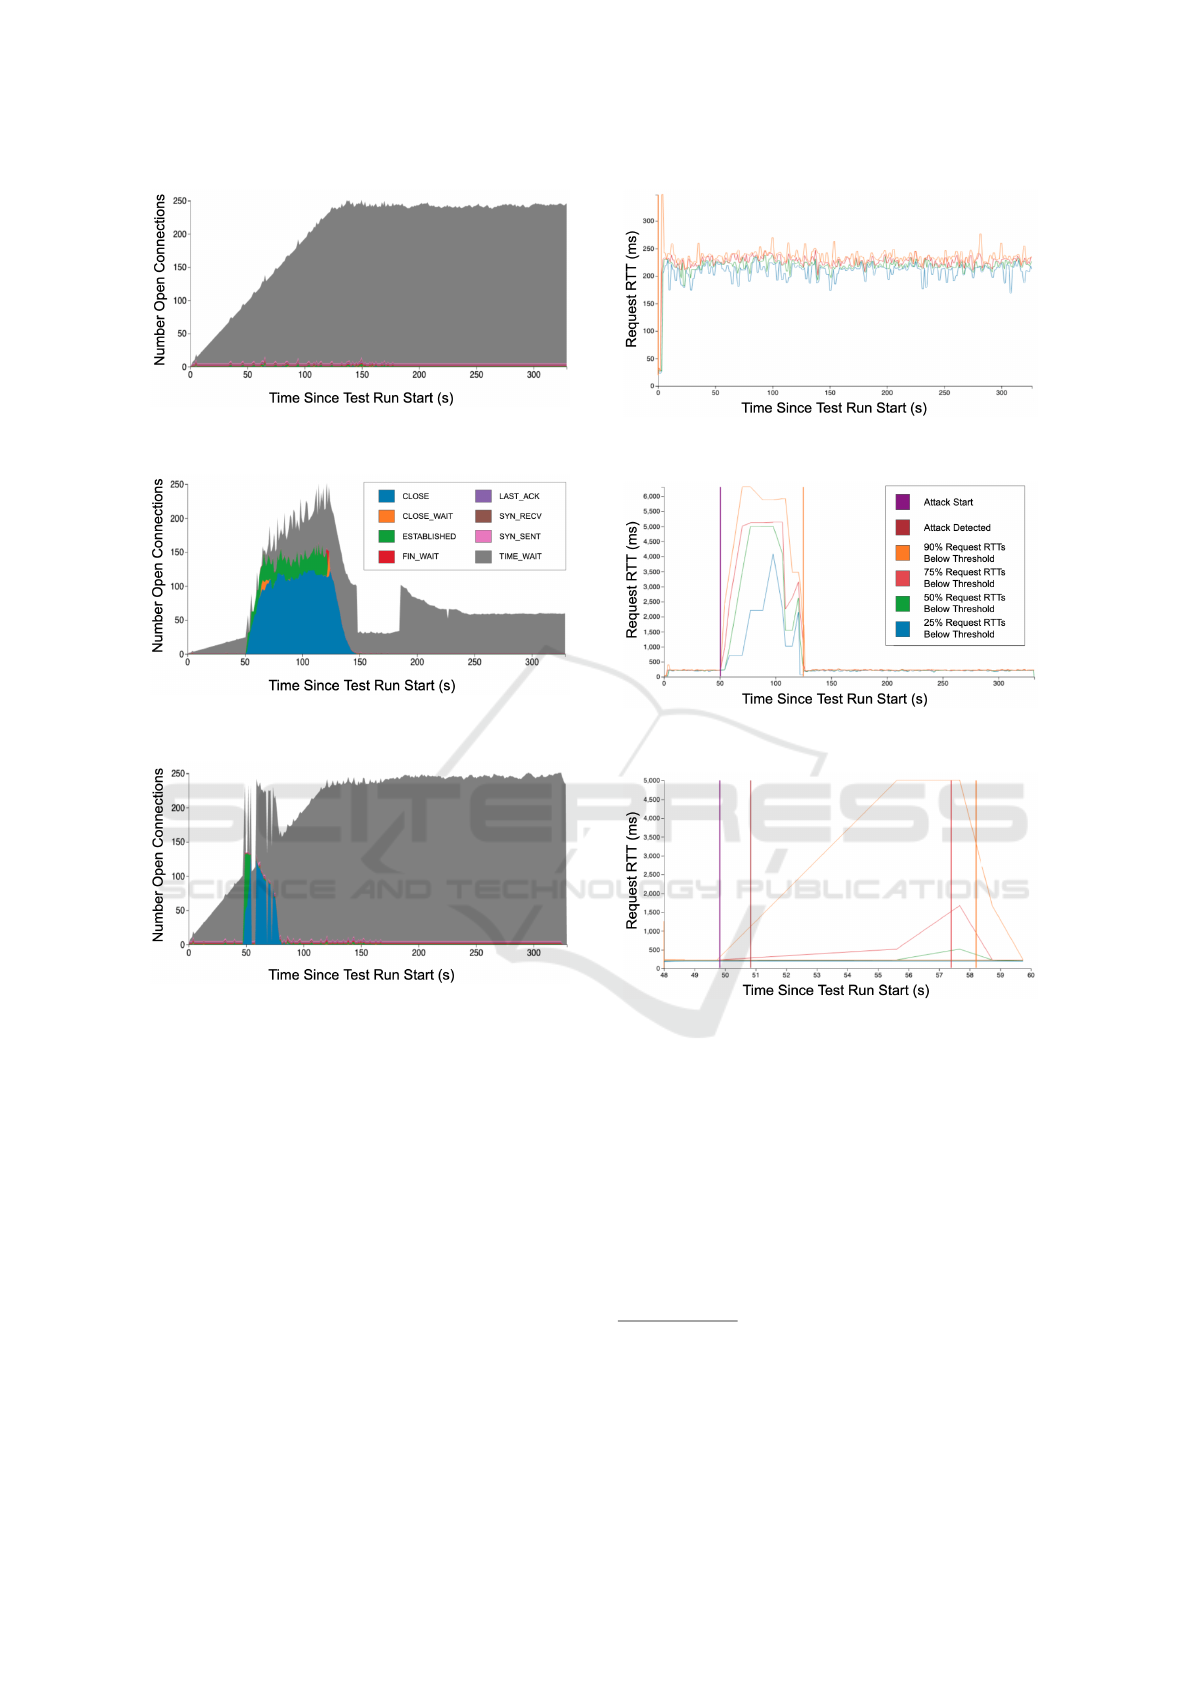
Figure 4: TCP states with no attack campaign (see legend
in Figure 6).
Figure 6: TCP states with an Apache Killer campaign and
no defense.
Figure 8: TCP states with an Apache Killer campaign and
Canopy active (see legend in Figure 6).
perimental context (e.g. offline vs real-time feature
extraction, testing on never-before-seen attacks, etc.).
We attempt to provide this comparison, with appro-
priate caveats, in Table 8. We are unable to compare
the practical performance of Canopy with these solu-
tions, however, since most do not operate in real-time
or perform mitigation.
As can be seen, all the examples in this compar-
ison report metrics (accuracy, precision, recall) be-
tween 95% and 100%. In multiple cases (Lima Filho
et al., 2019; Sharafaldin et al., 2018), the results
pertaining specifically to LSDDoS are inconclusive
because the datasets used predominately comprise
high-volume traffic. The lone real-time solution,
FINELAME, reports 100% accuracy in detecting
Slowloris, although this is the only LSDDoS attack
employed in the study. It is also worth noting that the
Figure 5: Request RTT with no attack campaign (see legend
in Figure 7).
Figure 7: Request RTT with an Apache Killer campaign
and no defense.
Figure 9: Request RTT with an Apache Killer campaign
and Canopy active. Timeline shortened to the duration of
the attack leading up to and shortly after mitigation. (See
legend in Figure 7.)
supervised approaches, all except FINELAME which
performs anomaly detection, do not mention evaluat-
ing on never-before-seen attacks.
In an attempt to further validate our approach, we
investigated evaluating our model on the LSDDoS
traffic in the publicly available CICIDS2017 dataset
employed by Sharafaldin et al. However, the absence
of distinct external client IPs prevents the use of our
IP-based data featurization process.
6
6
The CICIDS2017 test network includes a NAT on the
border router that obscures source IP addresses of traffic
to the victim server. Since the packet capture appears to
have been recorded from a network interface internal to the
victim’s network, all external traffic appears to be coming
from the router itself.
Canopy: A Learning-based Approach for Automatic Low-and-Slow DDoS Mitigation
365

Table 8: Comparison of results to related work.
Work Acc Prec Rec Dataset Real-
Time?
Mitigation? App-
agnostic?
Never-
Before-
Seen
Attacks?
(Lima Filho et al., 2019) N/A 0.99 0.97 mostly flood attacks;
<1% slow HTTP
N N Y N
FINELAME (Demoulin
et al., 2019)
1.00 1.00 1.00 Slowloris Y N N Y
(Siracusano et al., 2018) 0.99 N/A N/A Slowloris, Slowread,
Slowpost
N N Y N
(Sharafaldin et al., 2018) N/A 0.98 0.97 mostly high-volume;
Slowloris
N N Y N
Canopy (global experiments) N/A 0.99 0.95 Slowloris, R.U.D.Y.,
ApacheKiller,
Slowread, Sockstress
Y Y Y N
Canopy (N-1 experiments) N/A 0.99 0.89 ” ” Y Y Y Y
While related work in the field of DDoS preven-
tion has sought to use aspects of TCP state data to de-
tect attacks, our work presents a new approach for en-
capsulating TCP state data in a form that lends itself
well towards accurate, rapid prediction of malicious
behavior.
5.4 Limitations and Future Work
We have shown Canopy to be highly effective in de-
tecting and mitigating LSDDoS attacks. However,
during attack mitigation, Canopy erroneously blocks
roughly 5% of benign clients for 4 seconds each, on
average. Here, we discuss potential avenues to im-
prove Canopy’s performance.
Windowing Parameters. As described in Section 3.2,
TCP state data is aggregated in 100 millisecond time
windows for each IP. Given that TCP state changes of-
ten occur far more quickly, it may be useful to shrink
the size of this window. This increased granularity
could improve detection performance.
Input Resolution. Also mentioned in Section 3.2 is
the fact that each data example is composed of 10
time windows. While this number needs to be kept
reasonably small in order to maintain adequately fast
mitigation metrics as described in Section 4.2, short-
ening the duration of each window would enable the
resolution (or number of windows that make up an ex-
ample) to be increased without increasing the amount
of real time that an example spans. For example, 40
time windows of 25 milliseconds span the same dura-
tion of time as 10 windows of 100 milliseconds.
Increased Client Activity and Attack Variety. The
presented results are based on LSDDoS attacks and
clients listed in the paper. While we strive to choose
attackers and clients that were representative of what
Canopy would see in the wild, these sets can always
be improved. To increase the viability of the system,
more complex client user patterns, new LSDDoS at-
tacks, and a larger variety of SUTs could be added to
the training datasets.
5.5 Performance
While Canopy has a relatively small footprint, re-
source efficiency is not the primary goal for this pa-
per. We find that the overhead of running our sensor
on the SUT is minimal
7
during periods without attack.
During such periods, CPU usage hovers around 5% of
a single core to track TCP states. During periods of
attack, resource usage increases: Canopy will utilize
an entire CPU core until the attack is mitigated. The
inference engine uses about half a core to make classi-
fication decisions, regardless of the presence or inten-
sity of an attack. We also reserve four CPU cores for
Kafka. While four cores is significant with respect to
the resources of our small experimental testbed, this
aspect of the infrastructure scales well and would re-
main this size for a large real-world deployment.
6 CONCLUSION
With this paper, we proposed Canopy, a novel ap-
proach for identifying LSDDoS attacks by applying
machine learning techniques to extract meaning from
observed patterns of TCP state transitions. Our tests
showed that Canopy was able to detect and mitigate
these low-and-slow attacks accurately and quickly:
attacks were detected during 100% of test runs within
650 milliseconds, with clients’ experience restored to
normal within 7.5 seconds. Our tests also showed that
7
Future work may include replacing the inefficient
conntrack userspace application with a custom TCP mon-
itoring kernel module of our own.
ICISSP 2021 - 7th International Conference on Information Systems Security and Privacy
366

Canopy exhibits minimal erroneous mitigation of be-
nign clients, achieving a precision of 99%. Finally,
we showed that Canopy’s capabilities generalize well
to LSDDoS attacks not included in its training dataset,
identifying never-before-seen attacks within 750 mil-
liseconds.
ACKNOWLEDGEMENTS
This research was developed with funding from
the Defense Advanced Research Projects Agency
(DARPA) under Contract No. HR0011-16-C-0060.
This document was cleared for release under Distri-
bution Statement ”A” (Approved for Public Release,
Distribution Unlimited). The views, opinions, and/or
findings expressed are those of the authors and should
not be interpreted as representing the official views
or policies of the Department of Defense of the U.S.
Government. In alphabetical order, we would like to
thank Patrick Dwyer, Robert Gove, Heather Hardway,
Bryan Hoyle, Melissa Kilby, Alex Lim, Sean Morgan,
David Slater, and Scott Wimer, for their contributions
to the project.
REFERENCES
Bai, S., Kolter, J. Z., and Koltun, V. (2018). An em-
pirical evaluation of generic convolutional and recur-
rent networks for sequence modeling. arXiv preprint
arXiv:1803.01271.
Bystr
¨
om, C., Heyman, J., Hamr
´
en, J., and Heyman, H.
(2019). Locust. https://github.com/locustio/locust.
Demoulin, H. M., Pedisich, I., Phan, L. T. X., and Loo,
B. T. (2018). Automated detection and mitigation of
application-level asymmetric dos attacks. In Proceed-
ings of the Afternoon Workshop on Self-Driving Net-
works, pages 36–42.
Demoulin, H. M., Pedisich, I., Vasilakis, N., Liu, V., Loo,
B. T., and Phan, L. T. X. (2019). Detecting asymmet-
ric application-layer denial-of-service attacks in-flight
with finelame. In 2019 {USENIX} Annual Technical
Conference ({USENIX}{ATC} 19), pages 693–708.
Fayaz, S. K., Tobioka, Y., Sekar, V., and Bailey, M. (2015).
Bohatei: Flexible and elastic ddos defense. In 24th
USENIX Security Symposium (USENIX Security 15),
pages 817–832, Washington, D.C. USENIX Associa-
tion.
Hornby, T. (2012). Sockstress. https://github.com/defuse/
sockstress.
Hury, I. (2019). Noisy. https://github.com/1tayH/noisy.
Krebs, B. (2016). Krebsonsecurity hit with record ddos.
Kuzmanovic, A. and Knightly, E. W. (2003). Low-rate tcp-
targeted denial of service attacks: the shrew vs. the
mice and elephants. In Proceedings of the 2003 con-
ference on Applications, technologies, architectures,
and protocols for computer communications, pages
75–86.
Lima Filho, F. S. d., Silveira, F. A., de Medeiros Brito Ju-
nior, A., Vargas-Solar, G., and Silveira, L. F. (2019).
Smart detection: an online approach for dos/ddos at-
tack detection using machine learning. Security and
Communication Networks, 2019.
Makrushin, D. (2013). The cost of launching a ddos attack.
Markoff, J. (2008). Before the gunfire, cyberattacks.
Modi, H. (2018). Introducing netscout’s threat intelligence
report.
Moore, D., Shannon, C., J. Brown, D., M. Voelker, G., and
Savage, S. (2006). Inferring internet denial-of-service
activity. ACM Trans. Comput. Syst., 24:115–139.
Plante, C. (2015). Valve’s $18 million dota 2 tournament
delayed by ddos attack.
Ranjan, S., Swaminathan, R., Uysal, M., Nucci, A.,
and Knightly, E. (2008). Ddos-shield: Ddos-
resilient scheduling to counter application layer at-
tacks. IEEE/ACM Transactions on networking,
17(1):26–39.
Saied, A., Overill, R. E., and Radzik, T. (2016). Detection
of known and unknown ddos attacks using artificial
neural networks. Neurocomputing, 172:385–393.
Sharafaldin, I., Lashkari, A. H., and Ghorbani, A. A.
(2018). Toward generating a new intrusion detec-
tion dataset and intrusion traffic characterization. In
ICISSP, pages 108–116.
Shekyan, S. (2011). Slowhttptest. https://github.com/
shekyan/slowhttptest.
Siracusano, M., Shiaeles, S., and Ghita, B. (2018). Detec-
tion of lddos attacks based on tcp connection param-
eters. In 2018 Global Information Infrastructure and
Networking Symposium (GIIS), pages 1–6. IEEE.
Specht, S. and Lee, R. (2003). Taxonomies of Dis-
tributed Denial of ServiceNetworks, Attacks, Tools,
and Countermeasures. Technical report, Princeton Ar-
chitecture Laboratory for Multimedia and Security.
Stampar, M. (2011). Killapachepy. https://github.com/
tkisason/KillApachePy/.
Tripathi, N. and Mehtre, B. (2013). Dos and ddos attacks:
Impact, analysis and countermeasures. pages 1–6.
Valialkin, A. (2014). Goloris. https://github.com/valyala/
goloris.
Wang, C., Miu, T. T., Luo, X., and Wang, J. (2017).
Skyshield: A sketch-based defense system against ap-
plication layer ddos attacks. IEEE Transactions on
Information Forensics and Security, 13(3):559–573.
Zhang, C., Cai, Z., Chen, W., Luo, X., and Yin, J. (2012).
Flow level detection and filtering of low-rate ddos.
Computer Networks, 56(15):3417–3431.
Zhou, L., Liao, M., Yuan, C., and Zhang, H. (2017). Low-
rate ddos attack detection using expectation of packet
size. Security and Communication Networks, 2017.
Canopy: A Learning-based Approach for Automatic Low-and-Slow DDoS Mitigation
367
