
Image-based Road Marking Classification and Vector Data Derivation
from Mobile Mapping 3D Point Clouds
Johannes Wolf, Tobias Pietz, Rico Richter, S
¨
oren Discher and J
¨
urgen D
¨
ollner
Hasso Plattner Institute, Faculty of Digital Engineering, University of Potsdam, Germany
Keywords:
GIS, LiDAR, Point Cloud Rendering, Digital Image Analysis.
Abstract:
Capturing urban areas and infrastructure for automated analysis processes becomes ever more important.
Laserscanning and photogrammetry are used for scanning the environment in highly detailed resolution. In
this work, we present techniques for the semantic classification of 3D point clouds from mobile mapping
scans of road environments and the detection of road markings. The approach renders 3D point cloud input
data into images for which U-Net as an established image recognition convolutional neural network is used
for the semantic classification. The results of the classification are projected back into the 3D point cloud. An
automated extraction of vector data is applied for detected road markings, generating detailed road marking
maps. Different approaches for the vector data generation are used depending on the type of road markings,
such as arrows or dashed lines. The automatically generated shape files created by the presented process can
be further used in various GIS applications. Our results of the implemented out-of-core techniques show that
the approach can efficiently be applied on large datasets of entire cities.
1 INTRODUCTION
In recent years, 3D point clouds have established
themselves as a common data format for acquired
geospatial data. They offer the possibility of easy and
direct data acquisition and can contain very detailed
information about the scanned environment (Vossel-
man et al., 2004). They are a discrete representa-
tion of the real world and can be used for any envi-
ronment without the need for specific configuration
(Haala et al., 2008). 3D point clouds can be up-
dated with low effort and are well-suited for an au-
tomated analysis. Individual points are stored with-
out semantic order and can be provided with any at-
tributes in addition to their three-dimensional coor-
dinates. For example, LiDAR scans contain addi-
tional intensity values (Richter et al., 2013). Due to
the lack of order and structure, measuring points only
offer added value when they are viewed together in
semantic units. Therefore, a semantic classification
is usually performed before further use of the data
(Niemeyer et al., 2012). Semantic classification de-
scribes the process of assigning individual points a
semantic class that describes to which type of object
the point belongs, for example “Roadway”, “Traffic
sign”, or “Vehicle”. Once semantic information is
available, further analyses can be performed on the
3D point clouds. For example, they can be used to
create or update street cadastres (Caroti et al., 2005)
or to check that light spaces are kept free (Mikrut
et al., 2016). The basis for semantic classification is
usually a differentiation between basic classes such
as ground, vegetation, and buildings, but the analysis
can be as detailed as required and, depending on the
application, include classes such as curbs, road mark-
ings, or traffic signs (Pu et al., 2011).
Current information about the condition of traf-
fic infrastructure is of great interest to municipalities
and traffic offices. Road markings are essential for the
regulation of traffic flow, especially in crossing sit-
uations. When planning construction sites and after
the recreation of the previous state after road works,
road construction offices require detailed information
about the location of road markings. In everyday
applications, navigation systems use a map with in-
formation about the number of lanes and which lane
must be used to turn into a certain direction (B
´
etaille
and Toledo-Moreo, 2010). For autonomous driving,
cars need to continuously detect road markings to
keep the car in its lane and use a base map with lane
information for anticipating the course (Maurer et al.,
2016).
Thus, there is a need for efficiently capturing in-
formation about road markings and the automated
Wolf, J., Pietz, T., Richter, R., Discher, S. and Döllner, J.
Image-based Road Marking Classification and Vector Data Derivation from Mobile Mapping 3D Point Clouds.
DOI: 10.5220/0010190602270234
In Proceedings of the 16th International Joint Conference on Computer Vision, Imaging and Computer Graphics Theory and Applications (VISIGRAPP 2021) - Volume 4: VISAPP, pages
227-234
ISBN: 978-989-758-488-6
Copyright
c
2021 by SCITEPRESS – Science and Technology Publications, Lda. All rights reserved
227

creation of detailed road maps. Mobile mapping
scans are an established data source for the required
information, 3D point clouds being measured via Li-
DAR include valuable intensity data for the localiza-
tion of road markings and they can easily be cap-
tured in urban regions. The intensity value represents
the strength of the reflection of the scanning laser,
enabling conclusions about the structure of the sur-
face or its material. As shown in Figures 2 and 4,
road markings by design have a much higher inten-
sity value than the surrounding pavement.
In this work, we focus on a semantic classification
of road markings using convolutional neural networks
(CNNs) for visual recognition in images. Convolu-
tional neural networks are a class of networks used in
machine learning that were inspired by biological pro-
cesses and find use especially in the automated anal-
ysis of image data (LeCun et al., 2010).
Automated image analysis has been an active field
of research for many years and popular frameworks
have been developed that can be used for own use
cases (Pulli et al., 2012). Some objects in 3D point
clouds are particularly suitable for a classification
based on image analysis as we have shown before
(Wolf et al., 2019a). Here we present a complete
process for the analysis and vector data derivation of
road markings in 3D point clouds for which these ap-
proaches can be used if the input data are processed
and rendered in a suitable way.
2 RELATED WORK
3D point clouds commonly serve as base data to
automatically derive 3D city models and landscape
models (Schwalbe et al., 2005) for many different
use cases in urban planning for local authorities,
companies, or individuals (Vosselman et al., 2001).
As showcased by several existing tools, cadastral
data can be visualized in combination with 3D point
clouds to provide additional context and further facil-
itate the visual analysis and task-oriented exploration
of captured data sets (Aringer and Roschlaub, 2014).
High density point information can be analyzed and
creating large models gets possible, requiring only
minimal manual effort (Richter and D
¨
ollner, 2013).
Besides aerial captures of 3D point clouds, mobile
mapping techniques are widely used (Li, 1997). Mo-
bile mapping scans can be used to, e. g., automati-
cally extract road networks, or to analyze road sur-
faces (Jaakkola et al., 2008), as well as for the recon-
struction of building facades.
For many use cases the automated semantic anal-
ysis of 3D point clouds is a mandatory prepara-
tion. Examples include ground detection, tree anal-
ysis, change detection between multiple scans, cadas-
tre comparison, or automated 3D model generation.
Semantic classification can be performed by two fun-
damentally different approaches: Semantic per-point
surface category information can be derived by ana-
lyzing a 3D point cloud’s topology (Chen et al., 2017)
or by applying deep learning concepts (Boulch et al.,
2017).
In a more traditional approach, geometric at-
tributes are evaluated to determine the respective class
of individual points and of point groups (Grilli et al.,
2017). 3D point clouds can be divided into local
groups, so-called segments, for example by group-
ing points with similar surface orientation (Rabbani
et al., 2006). The resulting segments can then be an-
alyzed individually. The size and orientation of the
included surfaces are considered. Thus, large ver-
tical surfaces can usually be recognized as building
facades, whereas point groups with strongly varying
surface normals typically indicate vegetation (Wolf
et al., 2019b).
In recent years procedures have been established
as an alternative that practice classification by means
of machine learning (Zhou and Tuzel, 2018). For this
purpose, artificial neural networks are trained using
already classified data to be able to make statements
about the probable semantic class of points in un-
known 3D point clouds. It also became popular to use
the internal structures of the 3D point cloud itself for
prediction, as in the case of PointNet and similar net-
works (Qi et al., 2017). However, these approaches
often use small data sets of individual objects and re-
quire comprehensive training data.
Detecting objects in image data is a relevant re-
search field for many applications, such as face recog-
nition, license plate identification, or medical imagery
analysis. Viola et al. (2001) present an image object
detection algorithm which can be used to detect, e. g.,
faces in images.
U-Net, which was originally developed for the
medical sector, is now widely used in image segmen-
tation (Ronneberger et al., 2015). With the help of this
network, specific areas in images can be recognized,
such as cancer cells but also streets in aerial images
(Zhang et al., 2018).
The extraction of road marking information from
images taken from a car is discussed by Vacek et al.
(2007), who detect lanes and arrow markings. Veit
et al. (2008) present an approach to evaluate the per-
formance of algorithms for the road marking detec-
tion in images in general.
Yang et al. (2012) use the reflective properties of
road markings to extract them from LiDAR 3D point
VISAPP 2021 - 16th International Conference on Computer Vision Theory and Applications
228
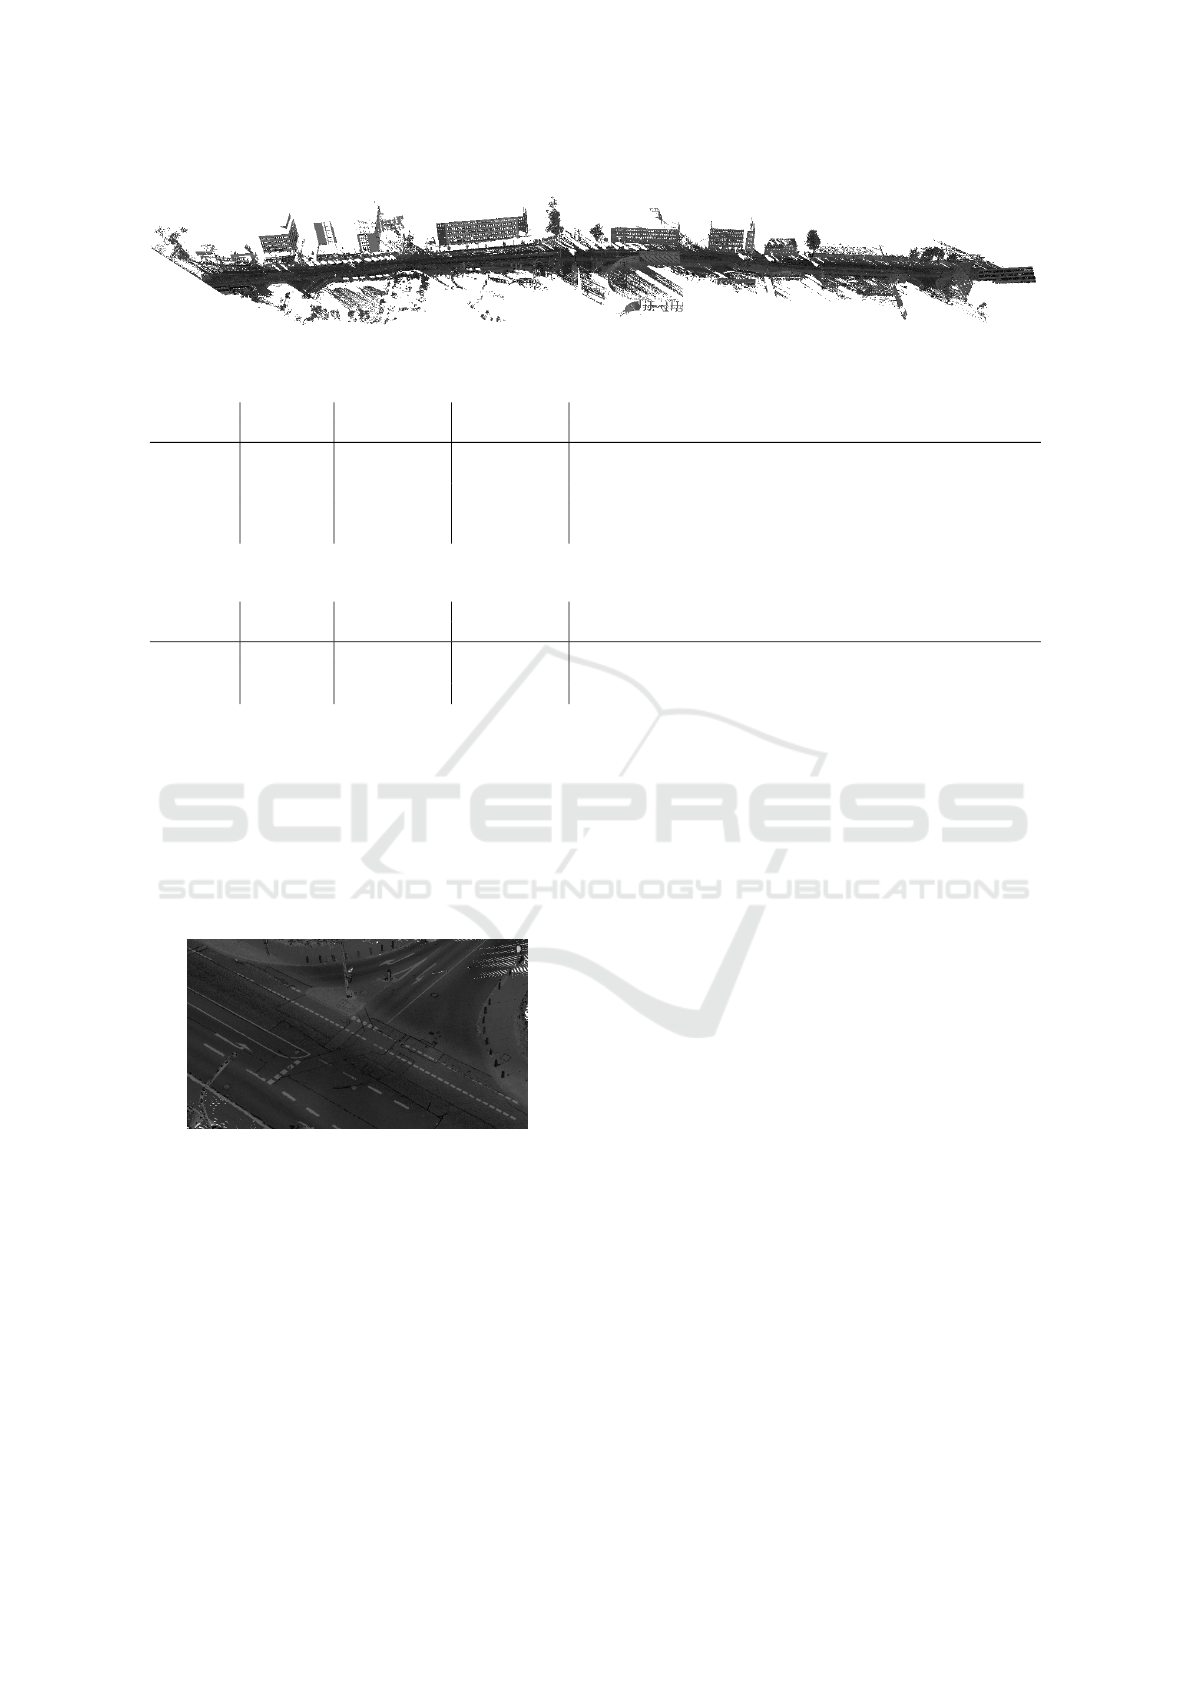
Figure 1: 3D point cloud of a street used as input for the road marking detection.
Table 1: Data used for training.
Approx. area No. rendered
City No. scans covered images Details
Essen 2 4 720 m
2
233 A straight road with 62 road markings and a crossing with 351
road markings.
Hamburg 2 7 610 m
2
376 Two large crossings with 1537 road markings in total.
Potsdam 0 — — No ground truth data was available, so this dataset was not used
for training.
Table 2: Data used for manual evaluation.
Approx. area No. rendered
City No. scans covered images Details
Essen 1 2 980 m
2
147 Straight road with T-junction at the end.
Hamburg 1 5 510 m
2
272 Large crossing with multiple lanes (shown in Figure 7).
Potsdam 1 2 150 m
2
106 Small 4-way crossing.
clouds. Similarly, Guan et al. (2014) present how mo-
bile laser scanning data can be used for an extraction
of road markings. They perform a curb-based road
extraction, followed by rendering intensity images of
the 3D point cloud and a final extraction step, seg-
menting the areas containing road markings. Yu et al.
(2014) take this approach one step further by distin-
guishing seven specific types of road markings by five
classification methods.
Figure 2: 3D point cloud of a crossing with road markings.
Detail of the 3D point cloud shown in Figure 1. Inten-
sity values are represented in grayscale, lighter colors have
higher intensity values.
3 DATASETS
The datasets used in this work are mobile mapping
scans from three different cities in Germany. They
vary with respect to point densities and the number of
cars, pedestrians, and other objects blocking the view.
However, the trained network can detect road mark-
ings in all datasets with similar accuracy. Different
areas of the datasets were used for training and eval-
uation, as presented in Table 1 and Table 2. A typical
street from a dataset is shown in Figure 1 and in more
detail in Figure 2. The 3D point cloud shown consists
of 29 million points and covers about 670 meters road
with several crossings.
To create a training set for a U-Net-based neural
network that is able to detect road markings, more
than one thousand road markings in about 600 im-
ages have been marked using existing manually cre-
ated shape files as ground truth data.
4 CONCEPT AND
IMPLEMENTATION
Our approach uses the abilities of image object detec-
tion algorithms to automatically classify road mark-
ings in 3D point clouds. The road markings are
clearly visible in a top-down view of the 3D point
cloud data. In Figure 3 the detected markings are
highlighted.
The software described in this paper uses a
pipeline concept for the automated processing of large
data sets. First, images are rendered in which road
markings are then recognized and the results of the
recognition are finally transferred back to the original
3D point cloud.
Afterwards, shapes are created for individual
markings. The resulting shape file can be used for
Image-based Road Marking Classification and Vector Data Derivation from Mobile Mapping 3D Point Clouds
229
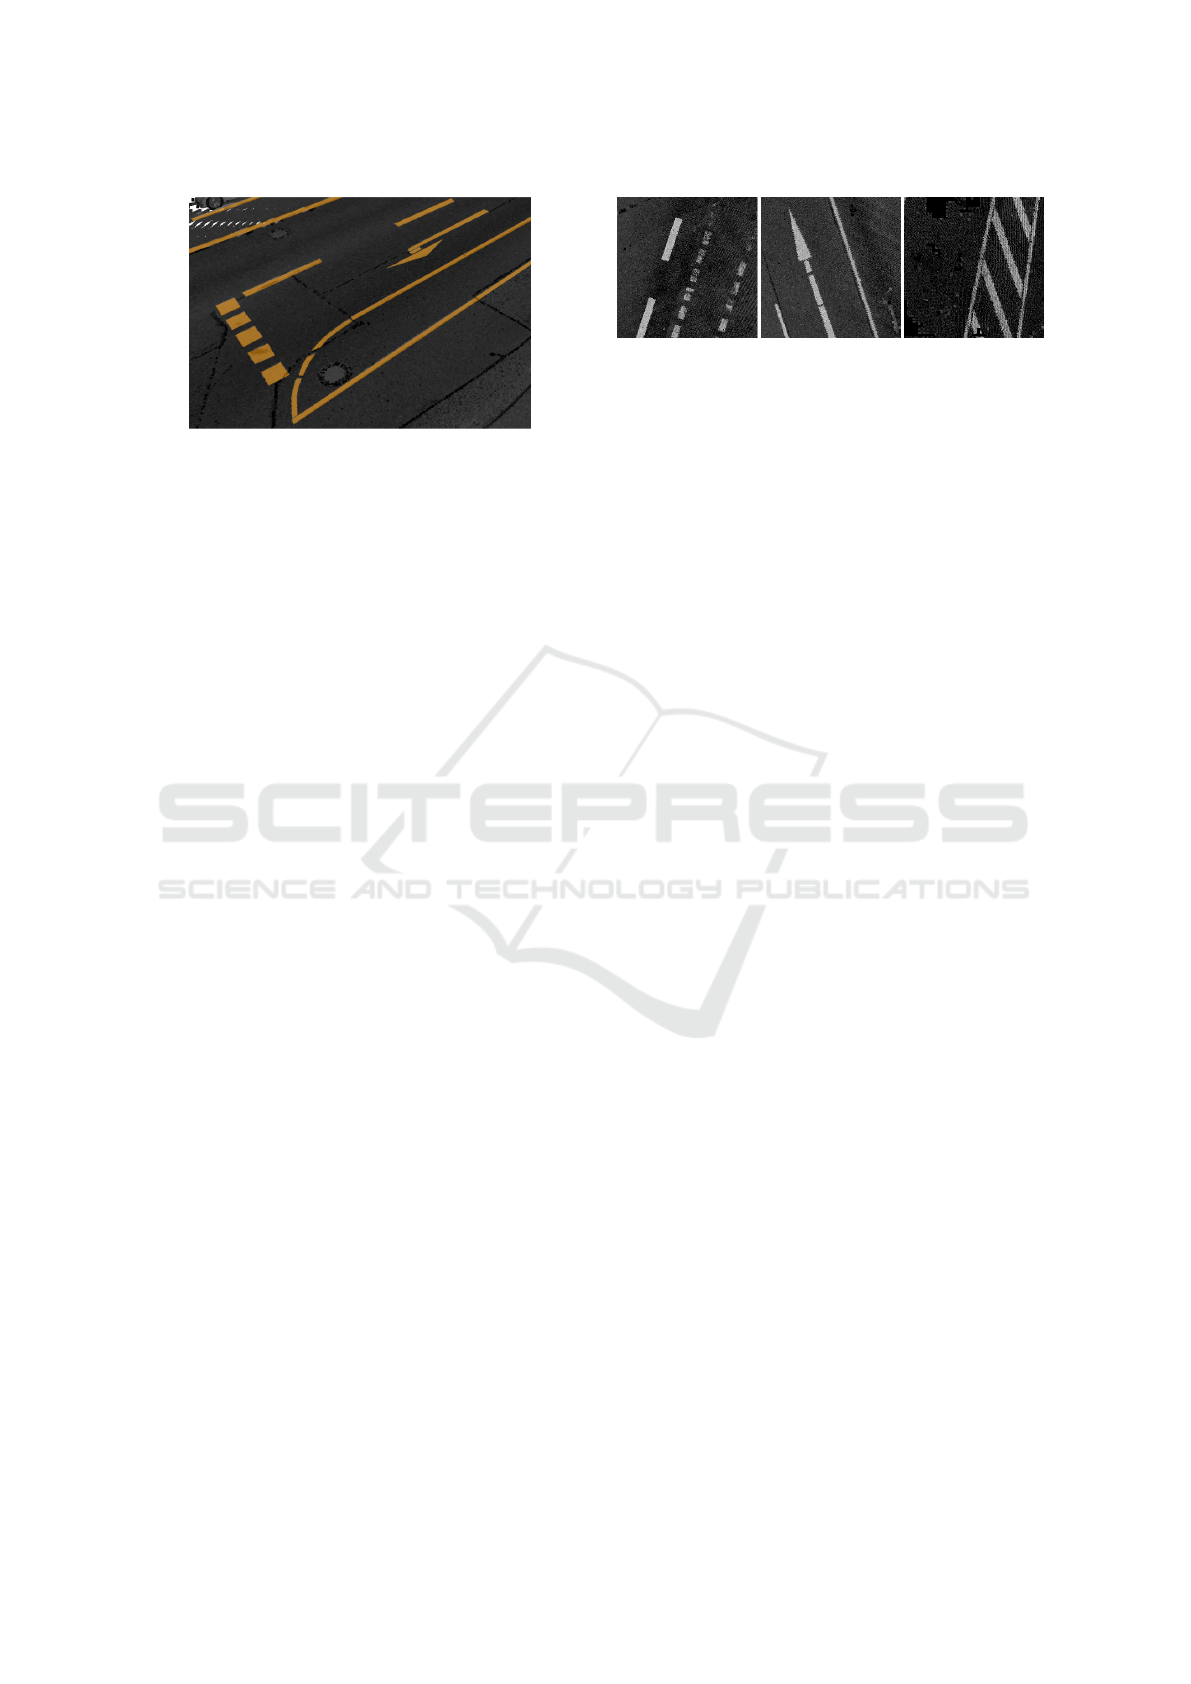
Figure 3: 3D point cloud with detected road markings rep-
resented as orange shapes rendered on top of the 3D point
cloud.
further processing in GIS applications.
First, all input 3D point clouds are filtered as de-
scribed in Section 4.1. Second, a renderer creates
square images of these filtered 3D point clouds as de-
scribed in Section 4.2.
Third, the rendered images are classified using the
previously trained neural networks and the results are
mapped back into the 3D point cloud, which is de-
scribed in Section 4.3. Finally, Section 5 describes the
creation of vector data for the individual markings.
4.1 3D Point Cloud Preprocessing
The recognition of road markings should be possi-
ble for large data sets of entire cities with billions of
points. For this reason, it is important to apply ap-
propriate data reduction. This includes first of all that
only points of the street region have to be analyzed.
During the acquisition of 3D point clouds, a trajec-
tory is often captured that indicates the traveled mea-
surement path. The resulting 3D point cloud can be
clipped along this trajectory, for example, only 10 me-
ters to the left and right along the trajectory are con-
sidered. If there is no trajectory, it can be determined
approximately from the local point density, because a
higher point density is recorded in areas in the imme-
diate vicinity of the scan vehicle than in areas further
away.
In the remaining data, outliers are removed by out-
lier filtering techniques. This is done to remove noise
within the data that might affect the top-down render-
ing of the 3D point cloud. All points with less than,
e. g., five neighboring points within a proximity of
0.5 meters can be marked as outliers. The approach
can be sped up by using a heuristic search based on
a spatial data structure such as a three-dimensional
grid in which all points are placed. All points in cells
which hold less than a certain number of points can
be marked as outliers. For the specific use case of this
work such a heuristic approach is sufficient because
Figure 4: Examples of rendered images from a 3D point
cloud, showing different types of road markings. Inten-
sity values are represented in grayscale, lighter colors have
higher intensity values.
the objects of interest are all located in dense areas of
the 3D point cloud.
To remove points that are too high above the road
to be considered, a ground detection according to the
method of Meng et al. (2009) is performed. High ly-
ing points, e. g., from surrounding buildings, or vege-
tation, can be removed afterwards.
The algorithm divides the area that is to be an-
alyzed into a regular two-dimensional grid. For each
grid cell, the lowest of all z-values of the points falling
into this cell, is stored. This represents a simplified
terrain model. After the grid has been initialized, scan
lines are used to find all ground points of the 3D point
cloud. These scan lines move axis-aligned in positive
and negative direction as well as diagonally through
the grid. The algorithm considers, which slope is
determined in the different scanning directions and
how the elevation differs between points and the min-
imum elevation in their local neighborhood. For each
scan line, potential ground points are determined sep-
arately. Following that, a majority voting is used to
classify points as ground.
The remaining 3D point cloud only consists of
ground points along the measuring vehicle’s trajec-
tory without outliers. Following this preprocessing
step, 3D point clouds of our test dataset have on aver-
age about 60 % of their original points left.
4.2 Image Rendering
After the preprocessing, images are rendered for the
image analysis. Top-down views of the 3D point
cloud are generated, which are processed one after the
other.
The renderer receives a 3D point cloud as input
and generates images of 128 by 128 pixels in orthogo-
nal projection, as shown in Figure 4. Each image rep-
resents about 4.5 by 4.5 meters of road surface. The
images are generated slightly overlapping and cover
the entire area to be analyzed. By removing higher
points in the preprocessing step, overhanging vege-
tation is removed and the road surface can be com-
pletely displayed.
VISAPP 2021 - 16th International Conference on Computer Vision Theory and Applications
230
Each image contains a channel with the intensity
value at the respective position and a channel contain-
ing the ID of the top-most point rendered at this pixel.
With this information the classification result can be
transferred back to the 3D point cloud after analysis.
For best results, the points from the 3D point cloud
are rendered using a rendering technique that fills
holes between neighboring points (e. g., paraboloids)
(Sch
¨
utz and Wimmer, 2015). Rendering with dif-
ferent point primitives is shown in Figure 5. Using
paraboloids will fill more pixels in areas with lower
density to avoid holes in the resulting image, while
preserving sharp edges of individual structures, as
shown in Figure 5c.
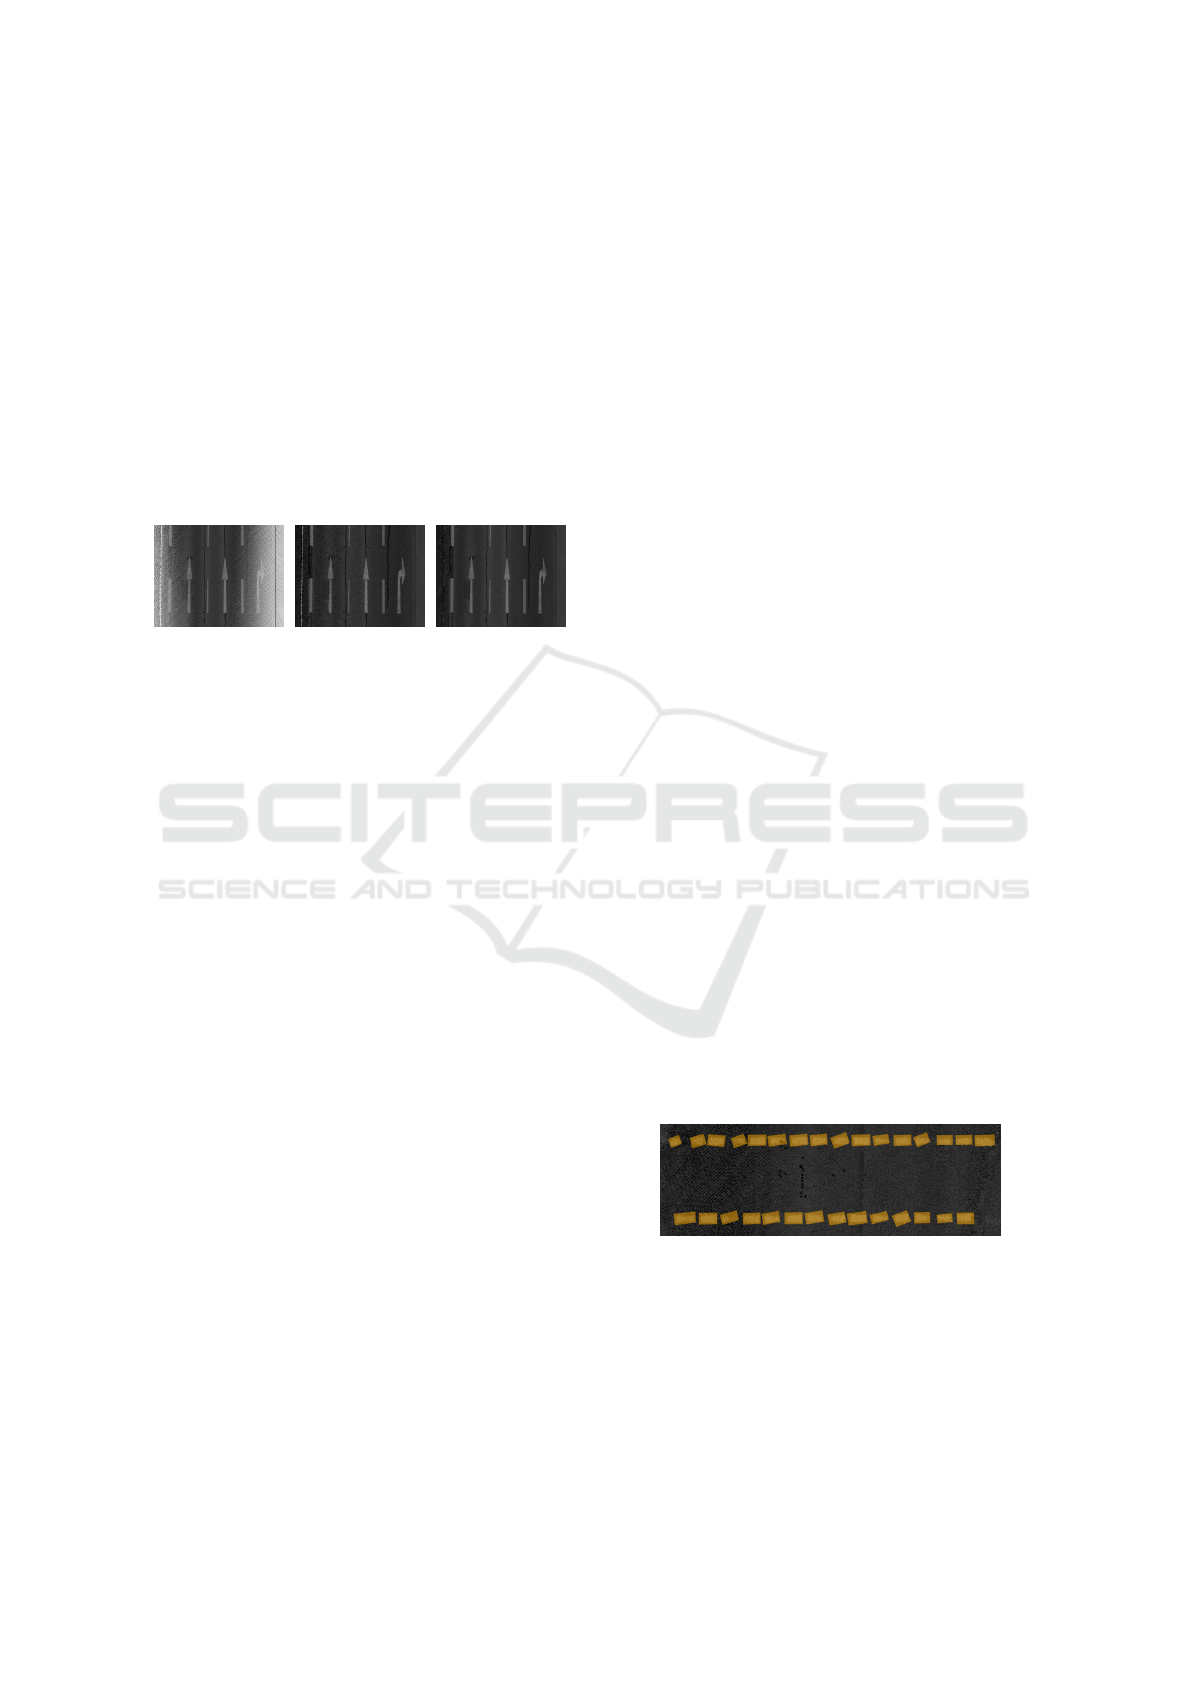
(a) Small points. (b) Large points. (c) Paraboloids.
Figure 5: 3D point cloud rendered with different primitives.
4.3 Classification
The rendered images are used as input for the previ-
ously trained neural network, working similar to the
one described by Wen et al. (2019). The result is an
output mask for each input image in which a seman-
tic ID describes for each pixel, whether it represents
background (road) or a certain type of road marking.
After the semantic classification of road markings
by U-Net, the information about the semantic class
of individual pixels can be transferred back to the 3D
point cloud through the point ID channel. The point
within the 3D point cloud whose ID matches that in
this channel of the image is assigned the recognized
semantic class as an additional attribute. The point
density is generally higher than the resolution of the
rendered images. Therefore, several points are cov-
ered by one pixel, so that all points in the immediate
neighborhood of the point just classified also receive
its semantic class, without having been noted in the
ID channel itself.
5 VECTOR DATA GENERATION
Shape files are used to describe vector-based geospa-
tial data. They can contain different types of shapes,
such as points (positional data) and polygons (areal
data) (ESRI, 1998). Each shape can have arbitrary
attribute-value pairs, describing additional informa-
tion available for this specific shape.
The presented approach creates polygonal shapes
for all detected road markings, showing their precise
location, size, and orientation. Each shape gets an
additional attribute describing the semantic class of
the road marking in this position, which can then be
used for, e. g., coloring all road marking types with
different colors.
Each group of adjacent points of the same seman-
tic class will be sorted into a cluster of points to cre-
ate a shape that represents the area covered by these
points, resulting in shapes for road markings as shown
in Figure 3. Depending of the type of road marking,
different approaches for the shape creation are used,
as explained below.
The resulting files can be used in various GIS ap-
plications for subsequent tasks. Figure 7 shows the
rendering of an automatically created shape file.
5.1 Rectangular Lines
When creating convex hulls for rectangular road
markings, these often have rough edges, resulting in
a noisy visualization. A better approach is therefore
the representation via oriented rectangles, concerning
width, height, and orientation of the road marking.
The orientation of a line is calculated by a prin-
cipal component analysis (PCA) on all points of the
line, resulting in a vector describing the main direc-
tion of the points in the cluster of this line.
For each of the generated rectangles, an error
value is calculated, describing which percentage of
the area covered by this rectangle is not actually lo-
cated on top of detected points of the road marking.
Should this value get too high, the rectangle does not
fit, which might occur if parts of the marking are miss-
ing or several lines are merging. In this case, an out-
line will be computed as described in Section 5.3.
Figure 6 shows that the orientation of the lines can
be hard to determine, especially in situations where
lines are not fully visible due to, e. g., abrasion.
Figure 6: Example for generated polygons (orange) using
individually oriented rectangles for line markings placed on
top of the 3D point cloud.
To create shapes for lines consisting of individ-
ual parts, where neighboring line segments should
have the same orientation, larger clusters are created.
Lines from the same type are collected into a com-
bined cluster, if the distance to the next neighboring
Image-based Road Marking Classification and Vector Data Derivation from Mobile Mapping 3D Point Clouds
231

line is smaller than a given threshold and the orienta-
tion does only differ by a small amount. This prevents
taking lines at corners which are oriented perpendic-
ular to each other into the same cluster. For each of
these larger clusters, the orientation can now be de-
termined with another PCA on the points of all road
markings that are part of this cluster. All the rectan-
gles in the cluster will then be oriented in the calcu-
lated direction.
5.2 Arrows
Arrows on the road are used to show which lane must
be used for which direction at a crossing. There is
only a relatively small number of arrows that are used
in almost all situations, namely those pointing left,
straight, right, and any combination of those. For
this reason, templates of arrow shapes can be used.
These templates are placed on the position where an
arrow marking was found. The orientation is deter-
mined as best-fit in a way that they are covering the
largest number of points of the detected road marking.
Using templates results in clearly shaped arrows
in the result.
5.3 Other Markings
For other markings, such as barred areas and inter-
secting lines, the shapes have to be constructed in a
different way. When the rectangle fitting described in
Section 5.1 does not fit a marking or if the semantic
type of the marking cannot be represented by rect-
angles or arrows, the following approach is used to
generate a fitting shape.
A two-dimensional grid with squared cells with a
side length of about 5 cm is created. The points of
the respective marking are then placed into this grid.
After all points have been added, each cell either con-
tains points or not. Those cells containing points de-
fine the area that should be spanned by the created
shape. The outline is generated by iterating over all
outer cells at the border of the marking. For each cell,
the outermost point will be used as a vertex for the
generated polygon, resulting in a shape fitting closely
to the detected road marking. The Douglas-Peucker
algorithm (Douglas and Peucker, 1973) is used for
shape simplification. Figure 7 shows some barred ar-
eas and crossing lines for which this approach was
used.
Figure 7: Automatically created shape file with shapes for
individual road markings. Different colors represent differ-
ent semantic classes.
6 EVALUATION
For the evaluation of the presented approach we used
3D point clouds which were recorded with the same
hardware as the training data. They partly originate
from the same cities as the training data and an ad-
ditional city. Table 2 gives an overview of the data
used. The artificial neural network was trained for
5 hours on a Nvidia GeForce 1080 Ti. In the manual
evaluation 93.9 % of the road markings were correctly
recognized, as shown in Table 3. The throughput was
7.5 million points per minute, which corresponds to
about 300 meters of captured road per minute. The
bottleneck in the analysis is the file operations during
rendering, because a lot of data has to be written to
disk. This could be avoided with an in-memory im-
plementation.
Errors in the classification are mostly undetected
road markings in areas of overall high intensity in wet
regions of the road and wrongly assigned semantic
classes like an incorrect type of line.
Table 3: Road marking accuracy values.
Marking Prec. Recall F
1
-score
Arrows (48) 93.5 % 89.6 % 91.5 %
Lane dividers (230) 96.6 % 98.7 % 97.7 %
Stop lines (39) 84.8 % 100.0 % 91.8 %
Ped. crossing (228) 91.2 % 97.0 % 94.0 %
Cycle tr. lines (270) 91.2 % 87.7 % 89.4 %
Barred areas (3) 100.0 % 100.0 % 100.0 %
Weighted average 92.5 % 93.9 % 93.1 %
The approach presented here achieves in our im-
plementation comparable and partly even better re-
sults than the underlying procedure of Wen et al.
VISAPP 2021 - 16th International Conference on Computer Vision Theory and Applications
232

(2019) and the recently published capsule network-
based approach of Ma et al. (2020). A full compara-
tive evaluation with a larger dataset will be reflected
in future work.
7 CONCLUSION AND FUTURE
WORK
State-of-the-art 3D scanning technology allows to
capture large-scale infrastructure networks (e. g.,
roads, railways) in unprecedented detail and preci-
sion. Due to their inherent quality these mobile map-
ping scans contain invaluable information for geospa-
tial applications in areas such as urban planning and
development, infrastructure management, predictive
maintenance, and disaster management. As shown
earlier, one such application is the automated identifi-
cation and extraction of road markings, which allows
for example to (1) improve and update pre-existing
cadastre data and (2) check for erroneous or missing
instances in an area. However, precisely identifying
assets such as road markings in large-scale mobile
mapping scans can be difficult and time-consuming.
We have shown that established artificial neural
networks for image segmentation can be used to clas-
sify road markings in such 3D point cloud data sets
efficiently and with great precision.
By choosing an appropriate rendering technique,
detailed images of the captured ground are created,
which can then be used as input for a neural network.
It is possible to map the identified objects back into
the 3D point cloud as well as to create shape files
with the vector data which can be used in GIS appli-
cations. Depending on the type of road marking, dif-
ferent shape generation approaches are used for best
results.
Besides road markings, the implementation can
also be used to identify manhole covers and similar
structures on the road, if labeled data sets with train-
ing data for the neural network are available. Sim-
ilarly, our approach may be applied to railroad net-
works as a different mobile mapping area, allow-
ing for the automated identification of rails, ties, and
balises, as well as the extraction of generalized rail
network plans which are essential for the maintenance
and surveillance of such infrastructure.
In the future, we envision the ever increasing af-
fordability of 3D scanning technology to result in
scans being conducted more and more regular and by
a larger variety of sensor systems, eventually leading
to data sets that get updated every few minutes. The
size of those data sets would dwarf that of today’s
scans, thus further necessitating the use of efficient
classification approaches like the one detailed in this
work.
ACKNOWLEDGMENTS
We thank the “Amt f
¨
ur Geoinformation, Vermessung
und Kataster” of the city of Essen, Germany for pro-
vided data and insights into the requirements of road
information analysis. Additionally we thank Ole We-
gen for his contributions to this topic.
REFERENCES
Aringer, K. and Roschlaub, R. (2014). Bavarian 3d build-
ing model and update concept based on lidar, im-
age matching and cadastre information. In Innova-
tions in 3D Geo-Information Sciences, pages 143–
157. Springer.
B
´
etaille, D. and Toledo-Moreo, R. (2010). Creating en-
hanced maps for lane-level vehicle navigation. IEEE
Transactions on Intelligent Transportation Systems,
11(4):786–798.
Boulch, A., Saux, B. L., and Audebert, N. (2017). Unstruc-
tured point cloud semantic labeling using deep seg-
mentation networks. In Proceedings of 3DOR, vol-
ume 2, page 1.
Caroti, G., Piemonte, A., and Pucci, B. (2005). Terrestrial
laser scanning as road’s cadastre revision and integra-
tion support. In ISPRS Workshop Italy-Canada 2005
3D Digital Imaging and Modeling: Applications of
Heritage, Industry, volume 1, pages 1–3. CIRGEO.
Chen, D., Wang, R., and Peethambaran, J. (2017). Topo-
logically aware building rooftop reconstruction from
airborne laser scanning point clouds. IEEE TGRS,
55(12):7032–7052.
Douglas, D. H. and Peucker, T. K. (1973). Algorithms for
the reduction of the number of points required to rep-
resent a digitized line or its caricature. Cartographica:
the international journal for geographic information
and geovisualization, 10(2):112–122.
ESRI (1998). Esri shapefile technical description. https://
www.esri.com/library/whitepapers/pdfs/shapefile.pdf.
Accessed: 2020-02-21.
Grilli, E., Menna, F., and Remondino, F. (2017). A review
of point clouds segmentation and classification algo-
rithms. The International Archives of Photogramme-
try, Remote Sensing and Spatial Information Sciences,
42:339.
Guan, H., Li, J., Yu, Y., Wang, C., Chapman, M., and Yang,
B. (2014). Using mobile laser scanning data for auto-
mated extraction of road markings. ISPRS Journal of
Photogrammetry and Remote Sensing, 87:93–107.
Haala, N., Peter, M., Kremer, J., and Hunter, G. (2008).
Mobile lidar mapping for 3d point cloud collection
in urban areas—a performance test. Int. Arch. Pho-
togramm. Remote Sens. Spat. Inf. Sci, 37:1119–1127.
Image-based Road Marking Classification and Vector Data Derivation from Mobile Mapping 3D Point Clouds
233

Jaakkola, A., Hyypp
¨
a, J., Hyypp
¨
a, H., and Kukko, A.
(2008). Retrieval algorithms for road surface mod-
elling using laser-based mobile mapping. Sensors,
8:5238–5249.
LeCun, Y., Kavukcuoglu, K., and Farabet, C. (2010). Con-
volutional networks and applications in vision. In Pro-
ceedings of 2010 IEEE international symposium on
circuits and systems, pages 253–256. IEEE.
Li, R. (1997). Mobile mapping: An emerging technology
for spatial data acquisition. Photogrammetric Engi-
neering and Remote Sensing, 63(9):1085–1092.
Ma, L., Li, Y., Li, J., Yu, Y., Junior, J. M., Gonc¸alves, W.,
and Chapman, M. (2020). Capsule-based networks for
road marking extraction and classification from mo-
bile lidar point clouds. IEEE Transactions on Intelli-
gent Transportation Systems, pages 1–15.
Maurer, M., Gerdes, J. C., Lenz, B., Winner, H., et al.
(2016). Autonomous driving. Springer, Berlin.
Meng, X., Wang, L., Silv
´
an-C
´
ardenas, J. L., and Currit, N.
(2009). A multi-directional ground filtering algorithm
for airborne lidar. ISPRS Journal of Photogrammetry
and Remote Sensing, 64(1):117–124.
Mikrut, S., Kohut, P., Pyka, K., Tokarczyk, R., Barszcz, T.,
and Uhl, T. (2016). Mobile laser scanning systems for
measuring the clearance gauge of railways: State of
play, testing and outlook. Sensors, 16(5):683.
Niemeyer, J., Rottensteiner, F., and Soergel, U. (2012).
Conditional random fields for lidar point cloud classi-
fication in complex urban areas. ISPRS annals of the
photogrammetry, remote sensing and spatial informa-
tion sciences, 1(3):263–268.
Pu, S., Rutzinger, M., Vosselman, G., and Elberink, S. O.
(2011). Recognizing basic structures from mobile
laser scanning data for road inventory studies. IS-
PRS Journal of Photogrammetry and Remote Sensing,
66(6):28–39.
Pulli, K., Baksheev, A., Kornyakov, K., and Eruhimov, V.
(2012). Real-time computer vision with opencv. Com-
munications of the ACM, 55(6):61–69.
Qi, C. R., Su, H., Mo, K., and Guibas, L. J. (2017). Pointnet:
Deep learning on point sets for 3d classification and
segmentation. In Proceedings of the IEEE Conference
on Computer Vision and Pattern Recognition, pages
652–660.
Rabbani, T., Van Den Heuvel, F., and Vosselman, G. (2006).
Segmentation of point clouds using smoothness con-
straint. International Archives of Photogrammetry,
Remote Sensing and Spatial Information Sciences,
36(5):248–253.
Richter, R., Behrens, M., and D
¨
ollner, J. (2013). Object
class segmentation of massive 3d point clouds of ur-
ban areas using point cloud topology. International
Journal of Remote Sensing, 34(23):8408–8424.
Richter, R. and D
¨
ollner, J. (2013). Concepts and techniques
for integration, analysis and visualization of massive
3D point clouds. Computers, Environment and Urban
Systems, 45:114–124.
Ronneberger, O., Fischer, P., and Brox, T. (2015). U-net:
Convolutional networks for biomedical image seg-
mentation. In International Conference on Medical
image computing and computer-assisted intervention,
pages 234–241. Springer.
Sch
¨
utz, M. and Wimmer, M. (2015). High-quality point-
based rendering using fast single-pass interpolation.
In 2015 Digital Heritage, volume 1, pages 369–372.
IEEE.
Schwalbe, E., Maas, H.-G., and Seidel, F. (2005). 3d build-
ing model generation from airborne laser scanner data
using 2d gis data and orthogonal point cloud projec-
tions. Proceedings of ISPRS WG III/3, III/4, 3:12–14.
Vacek, S., Schimmel, C., and Dillmann, R. (2007). Road-
marking analysis for autonomous vehicle guidance. In
EMCR, pages 1–6.
Veit, T., Tarel, J.-P., Nicolle, P., and Charbonnier, P. (2008).
Evaluation of road marking feature extraction. In
2008 11th International IEEE Conference on Intelli-
gent Transportation Systems, pages 174–181. IEEE.
Viola, P., Jones, M., et al. (2001). Rapid object detection
using a boosted cascade of simple features. CVPR (1),
1(511-518):3.
Vosselman, G., Dijkman, E., Reconstruction, K. W. B., Al-
timetry, L., and Transform, H. (2001). 3d building
model reconstruction from point clouds and ground
plans. Int. Arch. of Photogrammetry and Remote Sens-
ing, XXXIV, Part 3/W4:37–43.
Vosselman, G., Gorte, B. G., Sithole, G., and Rabbani,
T. (2004). Recognising structure in laser scanner
point clouds. International archives of photogramme-
try, remote sensing and spatial information sciences,
46(8):33–38.
Wen, C., Sun, X., Li, J., Wang, C., Guo, Y., and Habib, A.
(2019). A deep learning framework for road marking
extraction, classification and completion from mobile
laser scanning point clouds. ISPRS journal of pho-
togrammetry and remote sensing, 147:178–192.
Wolf, J., Richter, R., Discher, S., and D
¨
ollner, J. (2019a).
Applicability of neural networks for image classifica-
tion on object detection in mobile mapping 3d point
clouds. International Archives of the Photogramme-
try, Remote Sensing & Spatial Information Sciences,
42(4/W15):111–115.
Wolf, J., Richter, R., and D
¨
ollner, J. (2019b). Techniques
for automated classification and segregation of mobile
mapping 3d point clouds. In Proceedings of the 14th
International Joint Conference on Computer Vision,
Imaging and Computer Graphics Theory and Appli-
cations, pages 201–208.
Yang, B., Fang, L., Li, Q., and Li, J. (2012). Auto-
mated extraction of road markings from mobile lidar
point clouds. Photogrammetric Engineering & Re-
mote Sensing, 78(4):331–338.
Yu, Y., Li, J., Guan, H., Jia, F., and Wang, C. (2014). Learn-
ing hierarchical features for automated extraction of
road markings from 3-d mobile lidar point clouds.
IEEE Journal of Selected Topics in Applied Earth Ob-
servations and Remote Sensing, 8(2):709–726.
Zhang, Z., Liu, Q., and Wang, Y. (2018). Road extraction
by deep residual u-net. IEEE Geoscience and Remote
Sensing Letters, 15(5):749–753.
Zhou, Y. and Tuzel, O. (2018). Voxelnet: End-to-end learn-
ing for point cloud based 3d object detection. In Pro-
ceedings of the IEEE Conference on Computer Vision
and Pattern Recognition, pages 4490–4499.
VISAPP 2021 - 16th International Conference on Computer Vision Theory and Applications
234
