
Applying User Centred Design to Improve the Design of Genomic User
Interfaces
Alberto Garc
´
ıa S.
1 a
, Carlos I
˜
niguez-Jarr
´
ın
2 b
, Oscar Pastor Lopez
1 c
, Daniel Gonzalez-Ibea
3
,
Estela P
´
erez-Rom
´
an
3
, Carles Borred
`
a
3
, Javier Terol
3
, Victoria Ibanez
3
and Manuel Tal
´
on
3
1
PROS Research Center, Universitat Polit
`
ecnica de Val
`
encia, Val
`
encia, Spain
2
Escuela Polit
´
ecnica Nacional, Quito, Ecuador
3
Centro de Gen
´
omica, Instituto Valenciano de Investigaciones Agrarias (IVIA), Moncada, Valencia, Spain
Keywords:
Genomics, User-centred Design, User Interface, GenomIUm.
Abstract:
The genomic domain is a complex data environment that has grown exponentially. Several tools have been
developed to extract knowledge from this immense amount of data. Knowledge extraction processes depend to
a large extent on how easy and intuitive are the user interfaces of the tools that are used by bioinformaticians.
However, genomic tools have frequently ignored the design process of their User Interfaces. Consequently,
they have important usability problems that complicates knowledge extraction. User Centered Design (UCD)
is a design approach that can be used to improve the usability of genomic tools. It consists on putting the
user and its real needs at the center of the design process. Improving the usability of these tools will facilitate
knowledge extraction. This paper reports the application of the UCD approach to design a tool that improves
knowledge extraction processes in a real world-use case. From a general perspective, UCD consists of “user
research” and “design solutions”. The first one was carried out by conducting UCD techniques, including
user interviews and task analysis. The second one was carried out by applying GenomIUm, a pattern-based
method that guides the design process of genomic user interfaces. As a fundamental part in the UCD approach,
the generated user interfaces were validated by expert bioinformaticians who reported that the complexity of
extracting knowledge from genomic data was reduced. We conclude that UCD techniques together with
GenomIUm can be a useful strategy to design more usable user interfaces in the genomic domain.
1 INTRODUCTION
Amongst one of the biggest challenges of the century
is to get a deep understanding of genomics (Stephens
et al., 2015). A so complex domain, containing hun-
dreds of dynamic variables, requires immense efforts
to study it. The amount of genomic data that is pub-
licly available has increased considerably over the last
decades (Galperin, 2008). This is mainly explained
by the reduction in the costs of sequencing genome
data (Mardis, 2011) and the increase in the speed
of sequencing thanks to Next Generation Sequencing
(NGS) technologies (Goodwin et al., 2016). How-
ever, being able to generate such amount of data has
originated a series of issues that require special at-
a
https://orcid.org/0000-0001-5910-4363
b
https://orcid.org/0000-0003-1338-7542
c
https://orcid.org/0000-0002-1320-8471
tention. The result of these issues is that extracting
knowledge in the genomic domain is complex, te-
dious, slow, and prone to error.
User-centred design (UCD) can be a convenient
solution to improve knowledge extraction in the ge-
nomic domain. UCD is a product design approach
that grounds its design process in information about
who will use the product. It is widely recognized
that bioinformatics resources suffer from important
usability problems (Javahery et al., 2004). Applying
UCD can significantly improve the usability of bioin-
formatics tools, making knowledge extraction more
efficient and effective. Although successfully applied
in other domains, UCD has been little used in the ge-
nomic domain because of its specific particularities.
Applying UCD in this domain is complex and re-
quires to overcome a number of additional challenges.
This paper describes our experience applying
UCD techniques to develop a bioinformatics tool that
S., A., Iñiguez-Jarrín, C., Lopez, O., Gonzalez-Ibea, D., Pérez-Román, E., Borredà, C., Terol, J., Ibanez, V. and Talón, M.
Applying User Centred Design to Improve the Design of Genomic User Interfaces.
DOI: 10.5220/0010187800250035
In Proceedings of the 16th International Conference on Evaluation of Novel Approaches to Software Engineering (ENASE 2021), pages 25-35
ISBN: 978-989-758-508-1
Copyright
c
2021 by SCITEPRESS – Science and Technology Publications, Lda. All rights reserved
25

improves domain knowledge extraction processes.
The tool has been developed in a real world-use case
along with the collaboration of the Instituto Valen-
ciano de Investigaciones Agrarias (IVIA) (Wu et al.,
2014; Wu et al., 2018), an agri-food research insti-
tute whose work focuses on improving the productiv-
ity and sustainability of the citrus agricultural activity.
We focused on identifying their key tasks and how to
improve them by defining the most convenient User
Interfaces (UIs) in terms of usability. To do so, the
tool has been developed using GenomIUm (I
˜
niguez-
Jarrin, 2019), a UCD-based framework that provides
i) a method to design and implement big data UIs and
ii) a catalog of User Interface design patterns to sup-
port the process.
To illustrate our work, the paper is structured as
follows: Section 2 discusses the state of the art re-
garding the use of UCD in the genomic domain. Sec-
tion 3 studies the use case to be improved by identi-
fying the problems to be addressed: the lack of au-
tomating and how to visualize the data. Section 4
presents how these problems are addressed by apply-
ing GenomIUm to generate the needed bioinformatics
tool. Section 5 validates our proposed solution with
an evaluation based on user observation. Firstly, we
observed how IVIA domain experts interact with the
proposed solution to solve a specific genomic analy-
sis exercise they are familiar with. Secondly, we in-
terviewed them to gather valuable feedback. Lastly,
Section 6 discusses conclusions and proposes future
work.
2 STATE OF THE ART
The ultimate goal of UI design is to produce usable
UIs that are easy to use and learn and allow users to
efficiently perform their tasks and achieve their goals
(Rimmer, 2004). However, in complex domains such
as bioinformatics, this goal is poorly addressed and
there is a growing concern that current approaches are
inadequate for this kind of domains (Chilana et al.,
2010). Javahery et al. highlight that the complexity
of the UIs of bioinformatics resources is higher when
they are compared to the interfaces of web sites that
people use daily (Javahery et al., 2004). In line with
that, Carpenter et. al. suggest that usability should be
a more highly valued goal to increase the adoption of
bioinformatics tools (Carpenter et al., 2012).
Understanding how users work becomes vital to
provide useful UIs in such a complex domain. Under-
standing what tasks they perform and what workflows
they follow allows to better adapt the tools to their
specific needs. Svanæs et. al. state that genomics tool
UIs should take into account not only the user’s needs
but also its particular context as a manner of providing
more usable solutions (Svanæs et al., 2008). Stevens
et. al. conducted a set of surveys of bioinformatics
tasks resulting in a task classification to assess the
quality of query systems (Stevens et al., 2001). Tran
et. al. performed a cross-sectional study of bioinfor-
matics tasks that were documented and proposed as
potentially desirable system features in bioinformat-
ics tools (Tran et al., 2004). Rutherford et. al. ex-
amined how large DNA sequences are examined and
navigated by users to improve the usability of DNA-
sequencing navigating tools (Rutherford et al., 2010).
All these works provided a better understanding of the
unmet needs of genomic domain users.
There has been an explosion in the number of
available bioinformatics tools in the last decades. A
good example is OMICtools, that provides a cata-
log of more than 20.000 web-accessible bioinformat-
ics tools (Cl
´
ement et al., 2018). A common point
found among those tools is that their developers tend
not to focus on their interfaces or usability aspects
(Pavelin et al., 2012). The designed UIs do not con-
sider user’s perspective and requirements as the start-
ing point of the design process (Al-Ageel et al., 2015).
Consequently, most of the users of these tools find
difficult to access the information and too frequently
they struggle to find valuable information for their re-
search. They accept tools with poor usability because
they use them freely, though these tools do not always
provide what they need (Pavelin et al., 2012). A us-
ability testing of bioinformatics tools conducted by
Bolchini et al. (Bolchini et al., 2009) reported that
usability issues affect the efficiency and effectiveness
of bioinformatics work. Several reasons seem to be
the underlying cause of not focusing on bioinformat-
ics tool UIs and their usability aspects (Pavelin et al.,
2012; de Matos et al., 2013; Chilana et al., 2010):
• Bioinformatics has historically relied on
command-line tools and using UCD requires
a “cultural shift”.
• Bioinformatics data that have to be presented are
complex and highly interconnected. Additional
technical and scalability constraints have to be
considered. Besides, it is a constantly evolving
subject whose rules usually have plenty of excep-
tions.
• Using UCD techniques generates an initial de-
lay in the design process and measuring the im-
pact of applying these techniques is too difficult.
UCD techniques improve scientific discovery pro-
cesses, but “discovery” is an intangible metric and
therefore difficult to measure.
ENASE 2021 - 16th International Conference on Evaluation of Novel Approaches to Software Engineering
26

• The prior knowledge that is needed to adequately
carry out UCD techniques in this domain (human-
computer interaction, bioinformatics and comput-
ing) creates a gap between domain users and de-
velopers.
• The usability validation, crucial to provide suc-
cessful solutions (Jaspers, 2009), needs to be car-
ried out by skilled UI designers, which is not al-
ways possible.
These reasons make the design process of user-
friendly UI difficult. Apart from that, authors tend
to give more importance to the novelty of the devel-
oped tool lessening down usability and UI aspects.
Indeed, it is the novelty of the tool its most valued
aspect rather than its associated UCD work(Pavelin
et al., 2012). In summary, usability and UI aspects
have been frequently ignored historically.
However, more recent bioinformatics projects are
considering UCD when designing and developing
their UIs. A scenario-based visualisation tool to
support epidemiological research called ADVISES
was developed using UCD methods (Sutcliffe et al.,
2010). They used prototyping and storyboarding
techniques to analyze user tasks and their domain
mental model. The EB-eye search service was re-
designed following UCD principles (Valentin et al.,
2010). Several user interviews were conducted to
gather the initial information and requirements before
developing the search service. After developing it,
one-to-one usability testing sessions were performed
to collect user feedback. The Enzyme Portal was de-
veloped after performing a series of user workshops
and interviews to identify user needs (de Matos et al.,
2013). Afterwards, they tested multiple prototypes
until finding an optimal design in terms of navigation
and functionality.
In conclusion, having the user as the primary
source of information of the UI design and develop-
ment processes results in multiple benefits (Pavelin
et al., 2012). The users will be more likely to use a
tool if they guide the design process; having greater
access to the data will increase users scientific dis-
coveries. Overall, UCD helps to develop high-quality
bioinformatics resources that ease users work and bet-
ter adapt to their specific needs.
3 PROBLEM STATEMENT
The reported use case consists of applying UCD tech-
niques to develop a bioinformatics tool to aid per-
forming a specific analysis process in the field of ge-
nomic citrus plant (variety) improvement. This anal-
ysis consists of establishing genotype-phenotype re-
lationships, that is to say, the observable traits in the
varieties (phenotype) that are caused by the genetic
code (genotype). For instance, the variations in the
genetic code that make a variety to be drought resis-
tant. Consequently, it is crucial to properly prioritize
(i.e. identify and select) those variations that have an
impact in the phenotype. We focus on the prioritiza-
tion of genetic variations that might have a notorious
impact on plant phenotypes. This analysis is a prob-
lematic and inefficient process that involves several
manual tasks that are difficult, slow to perform, and
prone to human failures. These tasks can be grouped
into:
Task 1: Select Variety Groups. There are tens of se-
quenced citrus varieties and it is difficult to work with
multiple of them because of the huge amount of data
contained on each of them. In order to work with the
varieties, bioinformaticians have to select and group
them based on specific phenotypes. Two groups are
created, one containing varieties that highly express
a phenotype of interest and the other one containing
varieties that do not express it. For instance, a pheno-
type of interest is the sweetness of the fruits that a set
of sequenced varieties produce.
Task 2: Compare Groups. There are a plethora of
variables to consider when filtering the data. Domain
experts have to reduce the amount of genomic data by
applying several conditions as a previous step before
comparing the variety groups. For instance, establish-
ing a quality data threshold or selecting a specific ge-
nomic region. They also need a report of the applied
filters to manage them easily. Considering the filter
conditions, the variety groups have to be compared to
extract their differences at a genotype level, i.e. ge-
netic variations. Although applying a single filter or
performing simple set operations (e.g. data intersec-
tion or subtraction) are challenging but feasible tasks,
chaining multiple filters or performing more complex
operations are not possible. As the number of vari-
eties involved increases, the complexity and cost of
the data filtering task increase dramatically.
Task 3: Visualize. The amount of data obtained af-
ter performing Task 2 can become unmanageable and
the bioinformaticians require to fluidly examine them
to identify potential genetic variations of interest. By
“examine” we mean to i) show how the data are dis-
tributed based on specific criteria and ii) interact with
the data by showing or hiding data columns and per-
forming data.
The generated knowledge is highly valuable be-
cause it allows modifying citrus varieties so that they
can potentially increase or decrease the level of ex-
pression of phenotypes of interest. However, as a
Applying User Centred Design to Improve the Design of Genomic User Interfaces
27

consequence of the complexity of the prioritization
of genetic variations process reported above, extract-
ing knowledge is complex and requires a consider-
able effort. The UI design process focused on au-
tomating the process and decreasing its complexity so
that bioinformaticians can more easily extract knowl-
edge. To accomplish this goal, the three main identi-
fied tasks become an entry-point to apply our UCD-
oriented solution.
4 PROPOSED SOLUTION
Our proposed solution consists of developing a bioin-
formatics tool, whose UIs have been designed fol-
lowing a UCD approach. UCD puts the user in the
center of the design process to ensure that the re-
sulting UI meets their real needs and interactions.
From a general perspective, UCD can be summarized
into two main activities: user research and solution
production. In the first activity, we have researched
our domain expert users by applying UCD techniques
such as user observation and task analysis. Observ-
ing them while performing the prioritization of ge-
netic variations process is a crucial activity to iden-
tify problems related to the data manipulation, detail
the high-level tasks identified in the problem state-
ment and determine which UIs should be designed.
In the second activity, we have designed the UIs by
using the UI design patterns that better address the
data manipulation-related problems identified in the
previous activity.
4.1 User Research
Domain users have been characterized through sev-
eral interviews and observing how they work. Iden-
tifying and analyzing the tasks involved in the pri-
oritization of genetic variations allowed us to under-
stand both the user mental model (i.e. how they think
the variation prioritization process works) and the do-
main under study. The gathered information has been
consolidated in a task model of the envisioned sys-
tem defined by using Concur Task Trees (CTT) nota-
tion (Patern
`
o, 2003) as shown in Figure 1. CTT no-
tation allows to represent the tasks with a chronolog-
ical and hierarchical structure. Figure 1.1 is the main
CTT whilst the “Define filters” and “Examine varia-
tion distribution” tasks are detailed in Figures 1.2 and
1.3 respectively for reasons of space. The task model
contains the three high-level tasks defined in Section
3 (i.e. select variety groups, compare groups and vi-
sualize) decomposed in lower-level tasks.
The first task, select variety groups task, consists
of defining the two groups of varieties to be com-
pared. Each citrus variety has a set of genetic vari-
ations from which some of them are unique and some
are shared with other varieties. The system shows the
list of available sequenced citrus varieties. Then, the
user selects the varieties of interest and adds them to
the groups.
The second task, compare groups task, consists
of two lower-level tasks: define filters and perform
comparison. In the first one, the conditions to filter
the genetic variations are defined (Figure 1.2). Up to
eight filters can be defined from which six are manda-
tory:
1. Variation type (mandatory, unique): Two types of
genetic variations can be compared, namely, Sin-
gle Nucleotide Polymorphism (SNP) and inser-
tion/deletion (indel). On the one hand, SNPs are
changes in the genetic code that only affect one
nitrogenous base (A, C, G or T). For example, a
variation that changes a C for a T at a given po-
sition. On the other hand, indels are genetic vari-
ations where the length of the genetic code is al-
tered, either by addition, deletion or both.
2. Set flexibility criteria (mandatory, unique): This
filter refers to how restrictive is to accept a varia-
tion based on its frequency of appearance among
the varieties of a group. By default, only ge-
netic variations that appear in every variety of a
group are accepted. However, in some cases this
might be too restrictive. The “flexibility” has to
do with the ability to filter genetic variations that
exist in a subset of the varieties of a group. Such
subset is defined by indicating a minimum and
maximum threshold of varieties to be considered.
There are multiple reasons to do that: working
with large groups of varieties, genetic variations
wrongly identified in the sequencing process, va-
rieties exhibiting a common phenotype caused by
different genetic variations, etc.
3. Quality (mandatory, unique): Because of techno-
logical limitations in the sequencing process, ge-
netic variations are complemented with a set of
quality indicators that show how reliable they are.
This filter allows specifying the quality threshold
to accept genetic variations.
4. Annotation impact (mandatory, multiple): Ge-
netic variations are annotated with software to
predict their effect and impact at a genomic level
(Cingolani et al., 2012). This filter allows specify-
ing the impact and effect under which a variation
is accepted. Genetic variations are classified by
how significant they are. A variation will be much
more relevant if it is predicted to alter a protein’s
ENASE 2021 - 16th International Conference on Evaluation of Novel Approaches to Software Engineering
28
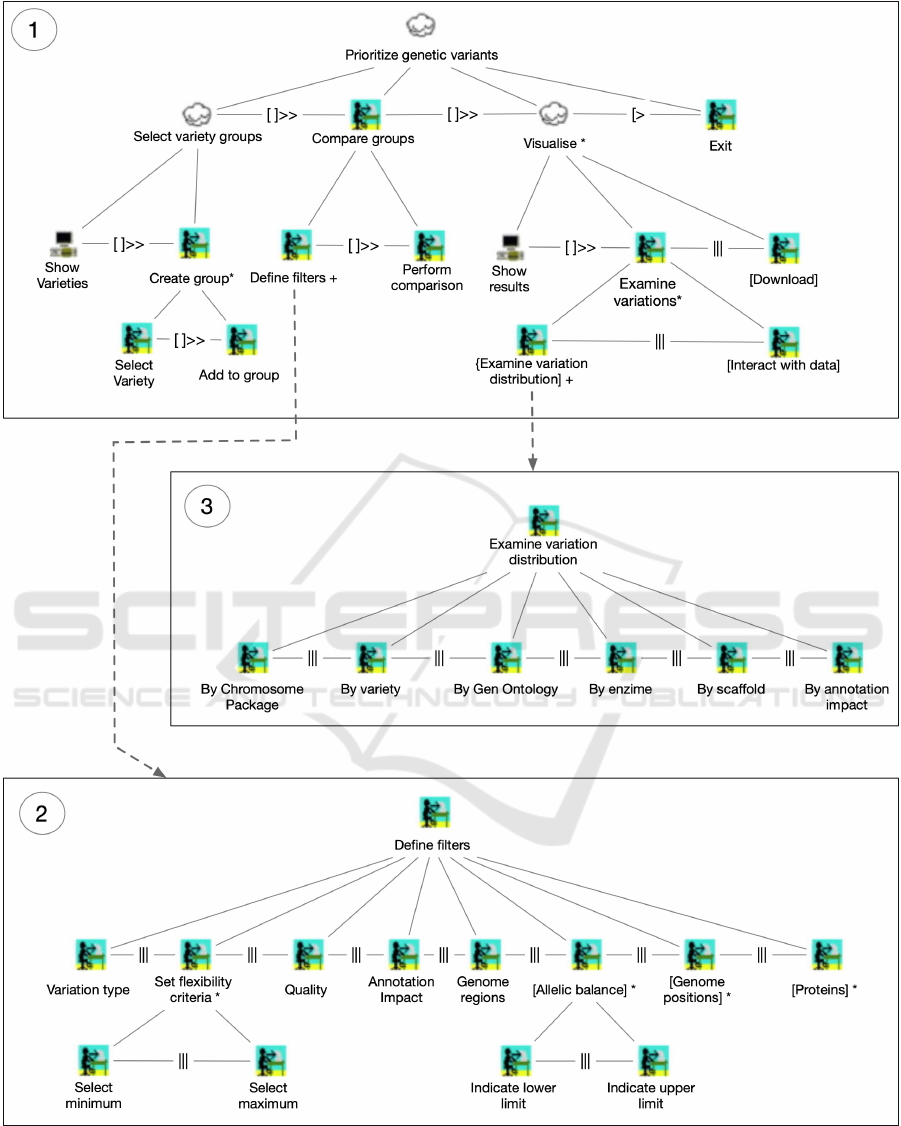
Figure 1: Task analysis.
functionality in a disruptive way (high impact).
5. Genome regions (mandatory): Genetic variations
can be located in specific types of regions (in-
tergenic regions, genes, exons, introns, etc) with
unique functionality. This filter allows specifying
the genomic regions where genetic variations have
Applying User Centred Design to Improve the Design of Genomic User Interfaces
29

to be located to be accepted.
6. Allelic balance (optional, multiple): The analyzed
citrus plants are diploid (i.e. their cells has paired
chromosomes
1
) so they have two copies of the
DNA sequence. When a variation is identified,
it can appear in one of these copies or in both.
The allele is the sequence, in one of the copies, in
the specific position where the variation has been
identified. The allelic balance is defined as the
ratio of appearance of possible alleles of a varia-
tion in the copies of the DNA sequence of a citrus
plant. This ratio can range from zero to one. This
filter allows specifying multiple lower and upper
limit pair values of allelic balance. Only those ge-
netic variations with an allele balance value inside
one of the defined ranges will be accepted.
7. Genome positions (optional, multiple): Genetic
variations are located in specific positions of the
DNA sequence. This filter allows specifying the
genomic positions where genetic variations have
to be located to be accepted.
8. Proteins (optional, multiple): Some genetic vari-
ations affect protein aspects, such as protein’s
structure or how they work. This filter allows fil-
tering genetic variations based on how they affect
a specific protein aspect.
In the second one, perform comparison, the two
groups of varieties are compared considering the ap-
plied filters. This comparison consists of four op-
erations that the system performs internally: Firstly,
those genetic variations that do not pass the defined
filters are removed. Secondly, the genetic variations
of the first group of varieties are intersected. Thirdly,
the genetic variations of the second group of varieties
are intersected. Fourthly, the symmetric difference of
the genetic variations of the two groups is obtained.
The third task, visualize task, consists of exam-
ining the data. It involves to i) examine how genetic
variations are distributed over multiple criteria, also
called passive analysis and ii) interact directly with
the data (active analysis). Passive analysis allows
users to get a general vision of the data at a glance.
To do that, six different visualizations are used:
• By Chromosome package: a visual representation
of the genetic variations with their physical loca-
tion at a chromosome level.
• By variety: number of genetic variations for each
variety in the defined groups.
• By Gene Ontology: number of genetic variations
for each gene ontology type.
1
https://www.genome.gov/genetics-glossary/Diploid
Architectural design Structural design Content design Refinement
Information patterns Page patterns
Navigation + Content
patterns
Figure 2: GenomIUm phases.
• By enzyme type: number of genetic variations for
each enzyme type according to the type of reac-
tion they catalyze.
• By scaffold: number of genetic variations for each
scaffold.
• By annotated impact: number of genetic varia-
tions for each annotated impact.
Active analysis allows users to interact with the data
in a more complex way. Multiple actions can be per-
formed, combined and chained, including: filtering,
grouping and aggregating data, showing and hiding
data attributes and performing pivoting operations.
Interaction with data can be performed by filtering,
grouping and aggregating operations that can be com-
bined and chained.
The characterization of these tasks becomes a
foundation that guides the design decisions to gener-
ate the UIs that will improve and facilitate the genetic
analysis process.
4.2 User Interface Design
So far, we have identified the tasks involved in ge-
nomic analysis. Now, our attention focuses on trans-
lating those tasks into a tangible UI design. To do that,
we focus on developing a key artifact of the design
activity: the conceptual design (CD) of the UI, which
captures the structure and flow of the UI. To define the
CD, we have applied a method called GenomIUm that
has been developed in previous work (I
˜
niguez-Jarrin,
2019) (see Fig. 2). It is based on Pattern Oriented
Design (POD) approach (Javahery and Seffah, 2002)
and aims to assist designers in creating the CD of ge-
nomics UIs.
GenomIUm takes advantage of the two main char-
acteristics of POD by providing i) a systematic design
process and ii) a catalog of interconnected patterns
that support the systematic process.
The systematic design process consists of four
steps:
1. Architectural Design: This step consists on defin-
ing the UIs that will make up the system and
their navigation flow. This step is supported by
information architecture patterns, which describe
system-wide solutions that organize the content to
ENASE 2021 - 16th International Conference on Evaluation of Novel Approaches to Software Engineering
30
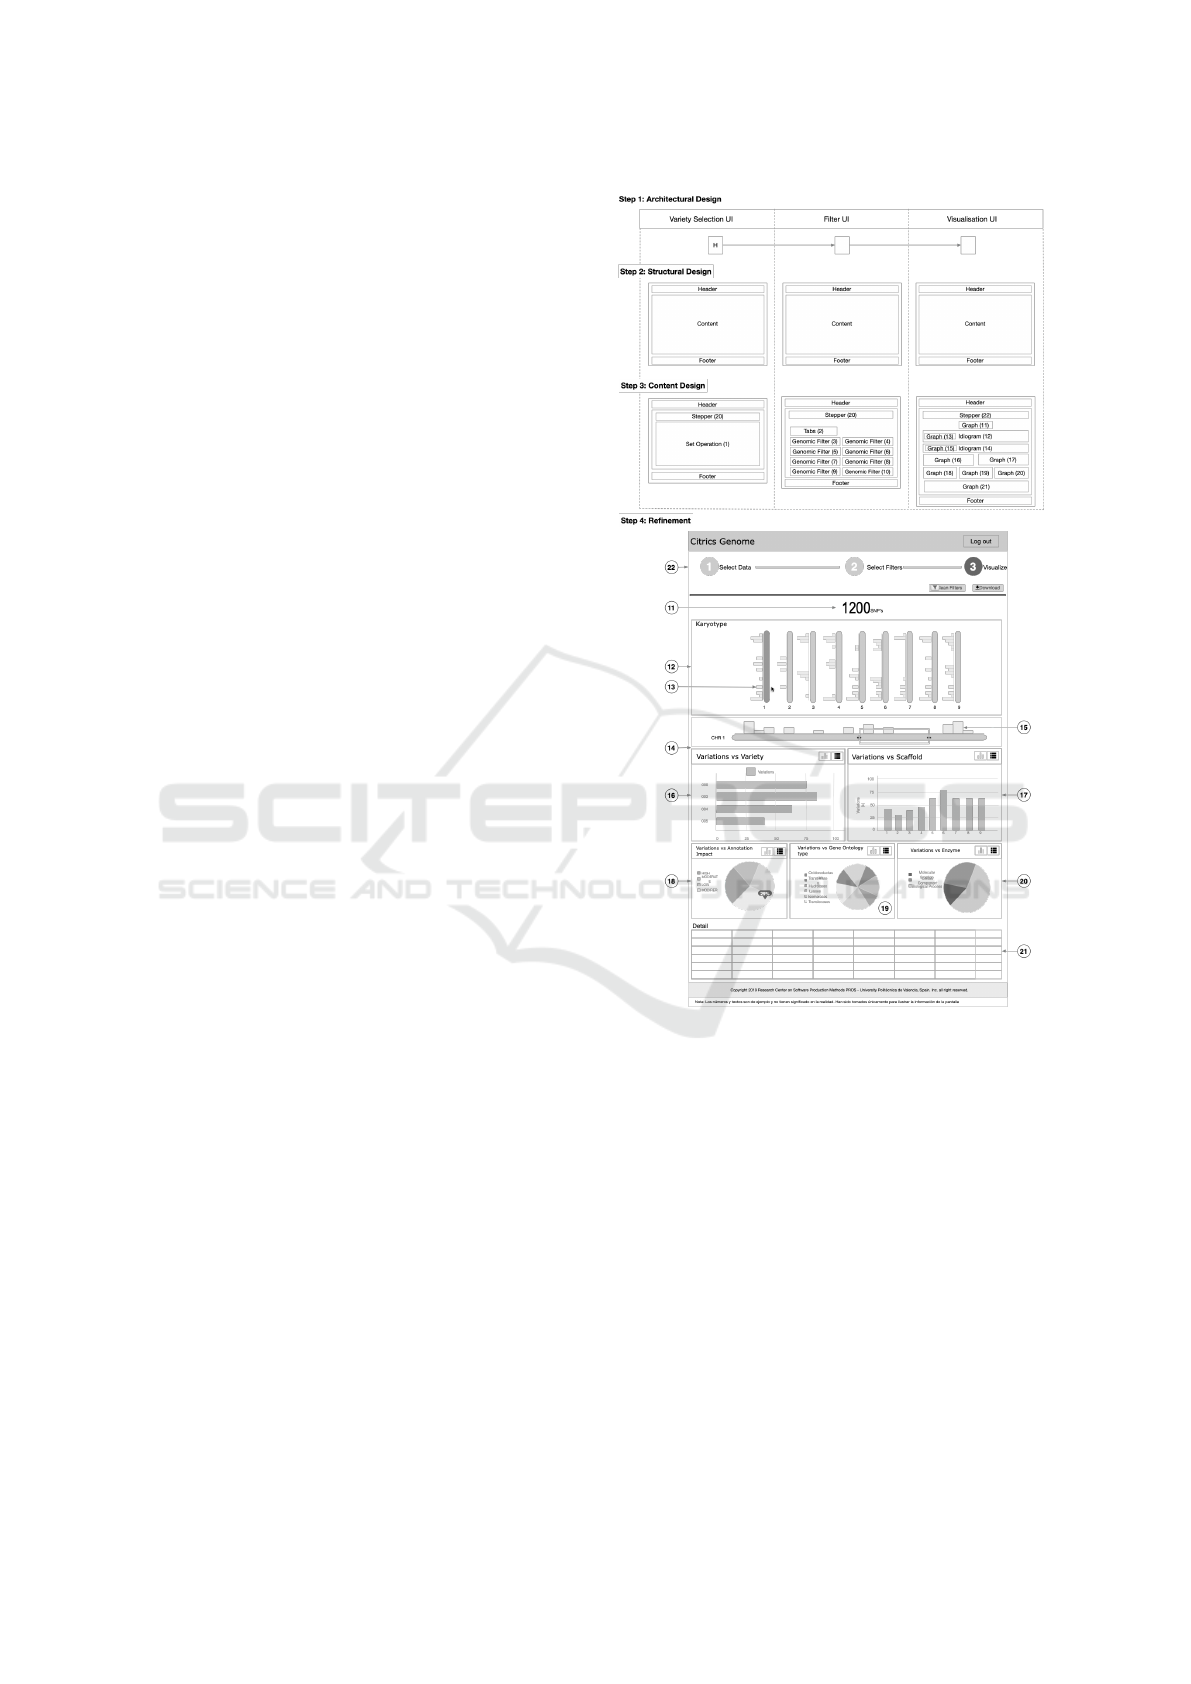
be displayed by defining high-level presentation
units and how they are linked.
2. Structural Design: This steps focuses on estab-
lishing the internal structure of each of the UIs
defined in the previous step. This step is sup-
ported by page patterns, which describe the inter-
nal structure (i.e. sectors) of presentation units.
3. Content Design: This step consists of selecting
the specific content elements that conform the in-
ternal structure of each UI defined in the previ-
ous step. This step is supported by navigation and
content patterns, which describe the content ele-
ments that compose sectors. Each pattern allows
users to perform a specific identified task.
4. Refinement: Each design pattern provides a gen-
eral UI design solution. This step consists of
adapting such a general design solution by indi-
cating the visual details of the selected patterns in
the previous step according to the specific particu-
larities of the data that is involved in the genomic
analysis.
The process is iterative in nature and designers can
repeat the steps several times until the CD meets the
user needs.
The catalog is structured in several pattern cate-
gories, one for each step of the design process and it
covers general design problems (i.e. navigation or in-
terface distribution) as well as specific design prob-
lems (i.e. visualizing the complete set of chromo-
somes of a species). Designers can exploit the pattern
relationships to create complete or partial UI designs.
The process and its pattern catalog cover the de-
sign of the UIs of a complete genomic application. In
the following paragraphs, we describe the CD result-
ing from applying GenomiUm in a joint work with
bioinformaticians. Figure 3 shows the designed UI
after performing the GenomIUm method.
In Step 1, Architectural design, three UIs have
been defined based on the tasks analysis (Fig. 1):
Variety Selection UI for the ”Select variety groups”
task, Filter UI for the ”Apply Filters” task and Visu-
alization UI for the ”Visualize” task. Bioinformati-
cians performed several UCD activities to guide the
definition of the UIs. As an example, figure 4 shows
them performing a card sorting session. The defined
UIs are connected through the “Sequential” pattern
(the UI with the “H” letter indicates the initial UI).
This pattern is used when a complex task can be di-
vided into more simple tasks that are performed in a
sequential order. It guides bioinformaticians through
the three UIs to carry out the “prioritize genetic vari-
ations” process.
In Step 2, Structural design, the sectors of the UIs
Figure 3: UI design through the GenomIUm method.
have been designed using the “Conceptual Frame-
work” pattern. This pattern suggests that the UIs
should share the same layout. The defined layout con-
sists of three sectors: a heading, a body and a footer.
In step 3, Content design, the design patterns that
compose each UI have been selected. Most of them
pertain to the ”Genomic Patterns” category, which
addresses how to show and interact with genomic-
related content. Table 1 describes the selected pat-
terns for each UI.
In Step 4, Refinement, the selected patterns have
been adapted to the specific particularities of the data
to be displayed as well as the identified task that they
solve. Step 4 in Figure 3 shows the refined Visualiza-
tion UI. Only the refinement of the Visualization UI
will be addressed due to space limitations. The re-
Applying User Centred Design to Improve the Design of Genomic User Interfaces
31

Figure 4: Geneticists and designers working together in a
Card Sorting Session.
Table 1: UI patterns used in the Conceptual Design of the
UIs.
Id Pattern Applied to
Variety Selection UI
1 Set Operation Define genomic data groups and compare them.
Filter UI
2 Tabs
Separate the content into sections that can be
accessed using a flat navigation (Toxboe, 2007)
3 Genetic Filter Filter the variations by their type
4 Genetic Filter Filter the variations by their frequency of appearance
5 Genetic Filter Filter the variations by their quality
6 Genetic Filter Filter the variations by their annotated impact
7 Genetic Filter Filter the variations by their genomic region
8 Genetic Filter Filter the variations by their allelic balance
9 Genetic Filter Filter the variations by their position
10 Genetic Filter Filter the variations by their effect over protein aspects
Visualization UI
11 Chart Show the number of genetic variations identified
12 Ideogram Show the chromosome set
13 Chart
Show the distribution of genetic variations
on each chromosome of the chromosome set
14 Ideogram Show the detail of the selected chromosome in pattern 3
15 Chart
Show the distribution of genetic variations
along the selected chromosome
16 Chart Show the genetic variations distribution by varieties
17 Chart Show the genetic variations distribution by scaffolds
18 Chart Show the genetic variations distribution by Impact Annotation
19 Chart Show the genetic variations distribution by Gene Ontology type
20 Chart Show the genetic variations distribution by Enzyme type
21 Hidden Column
List the genetic variations involved
in the overview visualizations (patterns 2 to 11)
Present in the three UIs
22 Stepper Guide users through the genetic analysis process
sulting Visualization UI gives the reader a clear idea
of how the refinement process works.
The corresponding CD of the three UIs have been
iteratively validated by bioinformaticians who pro-
vided valuable feedback to improve the UI designs.
The refined CDs have been implemented with stan-
dard web technologies. More specifically, we de-
signed the UI using the Angular framework
2
, and
utilized a set of open source libraries to implement
2
https://angular.io/
the UI paterns (i.e., angular2-charts.js
3
, ideogram.js
4
,
and agGrid
5
). These libraries offer angular-specific
implementations that allows to include them in the
project easily. Table 2 indicates the framework or li-
brary that implement each of the selected UI patterns.
Table 2: Frameworks and libraries used to implements the
UI patterns used in the Conceptual Design of the UIs.
Id(s) Pattern Implemented with License
Variety Selection UI
1 Set Operation Angular MIT
Filter UI
2 Tabs Angular MIT
3,4,5,6,7,8,9,10 Genetic Filter Angular MIT
Visualization UI
11 Chart Angular MIT
12,14 Ideogram Ideogram.js CC0 1.0 Universal
13,15,16,17,18,19,20 Chart angular2-chartjs MIT
21 Hidden Column agGrid MIT
Present in the three UIs
22 Stepper Angular MIT
Figure 5 illustrates the final implementation of the
Visualization UI. Each pattern has been labelled ac-
cording to the CD of the step four in Fig. 3.
5 VALIDATION
To validate the refined UIs, we have evaluated them
by obtaining user feedback to confirm whether the
UI design is in line with the user’s needs. To do
that, we have applied the User Interview technique
which emphasises gathering information in an agile
way rather than exhaustively documenting it (Preece
et al., 2015). The evaluation process consisted of two
steps: i) users are observed performing a set of previ-
ously defined tasks within their working environment
using the refined UIs, and ii) users are interviewed to
capture their impressions regarding their experience
using the refined UIs.
5.1 First Step
A specific genomic analysis exercise has been defined
to observe how domain experts use the application
and interact with the developed UIs. This exercise
consists of identifying meaningful variations by com-
paring two groups of varieties. One group contains
four clementine varieties while the other contains four
lemon varieties. Users must define several filters and
interact with the result to identify the meaningful vari-
ations. Observing how domain experts performed the
3
https://github.com/emn178/angular2-chartjs
4
https://github.com/eweitz/ideogram
5
https://github.com/ag-grid/ag-grid
ENASE 2021 - 16th International Conference on Evaluation of Novel Approaches to Software Engineering
32
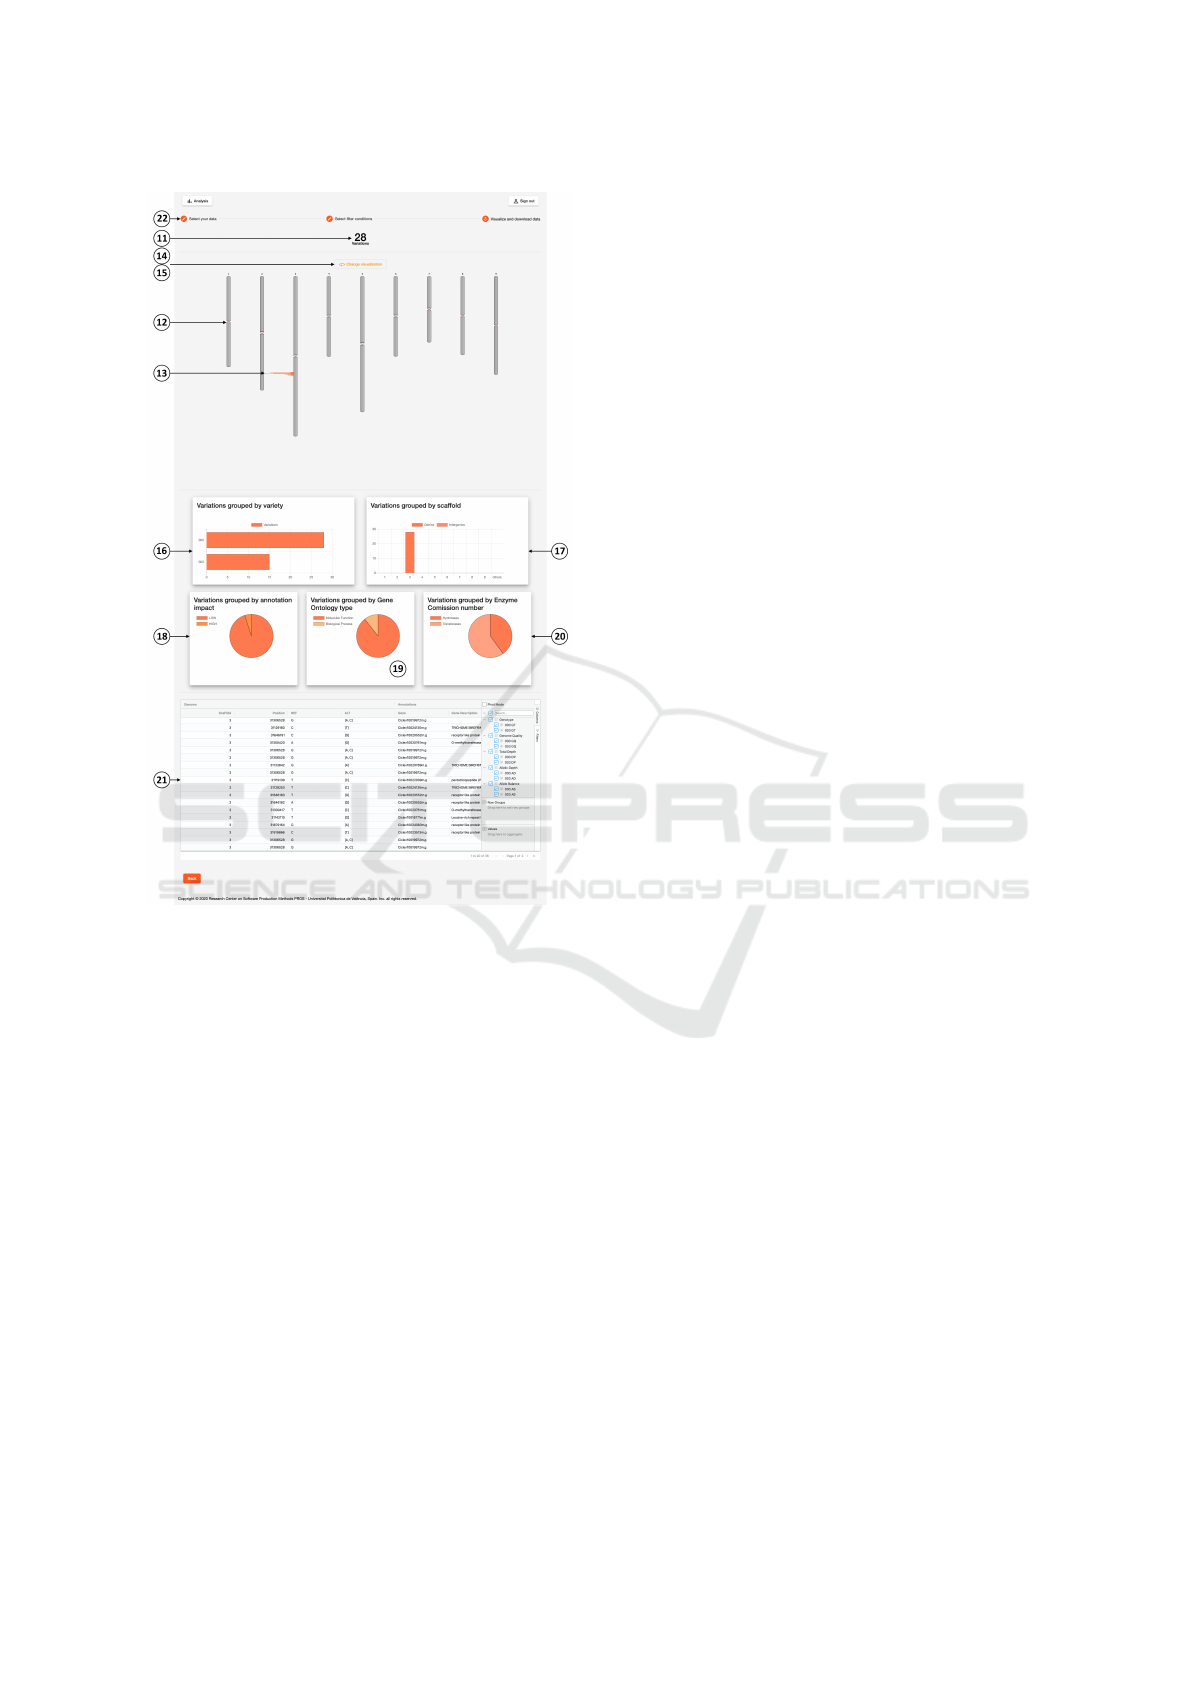
Figure 5: Implementation of Visualisation UI.
exercise allowed us to assess the well-operation of the
application and to analyze the obtained results.
5.2 Second Step
We interviewed domain experts to know their opin-
ion regarding the use of the application and its UI.
The feedback obtained is summarized in three rele-
vant points:
1. The Application Provides Easy Guidance.- They
explained that the steps to follow in the analysis is
easily described by the sequence of UIs (i.e. va-
riety selection UI, filter UI, visualization UI) im-
proving the way the analysis is performed.
2. It Is Easy to Learn.- Users found intuitive to man-
age the application because the tasks to perform
with the UIs match real work environment tasks.
They perform the analysis of the genetic varia-
tions with minimum technological support. Be-
sides, genomic terminology used in the UIs is fa-
miliar to the user.
3. Greater Access.- Users mentioned that the pro-
posed UI expands the possibility of access to data
to experts and novices bioinformaticians. In the
traditional process, analyzing the data was lim-
ited to expert bioinformaticians with high com-
puter skills.
In general, domain experts reported a positive use of
the implemented solution. The reason is that the pro-
vided tool allowed them to reduce execution time eas-
ily and intuitively. Other solutions either decreased
execution time too little or were too complicated and
required a large amount of time to learn to use them.
Nevertheless, they mentioned that adopting the tool
takes a small amount of time to get used to it and
change their mental model; but they stated that the
benefits of using the tool outweighed the cost of
adopting it.
In conclusion, it is an undeniable fact that the au-
tomatizing of the genomic analysis process produces
greater satisfaction and benefits than performing it
manually. However, how easy it is to use the ap-
plication that automates the process depends largely
on how easy it is to use its UI. The bioinformati-
cians opinion shows that the designed UI eases the
use of the application and reduces the complexity
of performing the genomic analysis. The validation
reported encouraging findings but the results should
be understood under the conditions of the evaluation.
Our next step in this line is to carry out more empiri-
cal evaluations that reinforce the results obtained.
6 CONCLUSIONS
UIs are crucial to manage data and extract knowledge
from it. Its design and development require proper at-
tention as good designed UIs can have a huge impact
in performing these tasks. Unfortunately, genomic
applications are unintuitive, complex and overly ver-
bose because their UIs are poorly designed. Conse-
quently, learning to use them is difficult and tedious,
which reduces knowledge extraction from genomic
data.
This paper emphasizes the use of UCD as an ap-
propriate approach to design genomic UIs. We report
the design and implementation of genomic UIs in a
real-word use case by applying UCD techniques and
GenomIUm, a POD based method where each UI is
composed of a set of UI patterns. Firstly, the relevant
tasks of the use case have been identified and stud-
ied through UCD techniques. Secondly, the UIs have
been designed according the GenomIUm method by
Applying User Centred Design to Improve the Design of Genomic User Interfaces
33

selecting the most appropriate patterns for each iden-
tified task. Thirdly, the designed UIs have been eval-
uated by bioinformaticians.
Complementing UCD techniques with the support
of a pattern-based method (i.e. GenomIUm) to design
UIs provides greater benefits. While UCD techniques
allows to research the users and to specify the real
user tasks, the method guides the design and imple-
mentation of the UI based on the user tasks. Compos-
ing UIs with widely used design patterns (provided by
GenomIUm) makes them familiar and consequently
easy for bioinformaticians to use.
The UCD approach together with the GenomIUm
method allowed us to generate high-quality UIs.
Bioinformaticians reported to be satisfied with them
as it allowed them to improve knowledge extraction
and data management processes by i) automating the
process, ii) providing an intuitive guideline to bioin-
formaticians, iii) allowing to deal with huge amount
of data that is complex in nature and iv) removing the
need of having high computer skills.
Future work includes, on the one hand, to carry
out a broader, more empirical user evaluation. This
evaluation should measure the increase of the user’s
performance when using pattern-based UIs. On
the other hand, the continuous improvement of the
GenomIUm method with the inclusion of new UI pat-
terns.
ACKNOWLEDGEMENTS
The authors would like to thank the members of the
PROS Research Center Genome group for fruitful
discussions regarding the application of Conceptual
Modeling in the medical field. This work has been
developed with the financial support of the Span-
ish State Research Agency and the Generalitat Va-
lenciana under the projects TIN2016-80811-P and
PROMETEO/2018/176 and co-financed with ERDF.
Work at IVIA is funding by the Ministerio de Cien-
cia, Innovaci
´
on y Universidades (Spain) trough grant
RTI2018-097790-R-100 and by the Instituto Valen-
ciano de Investigaciones Agrarias (Spain), through
grants 51915 and 52002.
REFERENCES
Al-Ageel, N., Al-Wabil, A., Badr, G., and AlOmar, N.
(2015). Human Factors in the Design and Evalua-
tion of Bioinformatics Tools. Procedia Manufactur-
ing, 3:2003–2010.
Bolchini, D., Finkelstein, A., Perrone, V., and Nagl, S.
(2009). Better bioinformatics through usability analy-
sis. Bioinformatics, 25(3):406–412.
Carpenter, A. E., Kamentsky, L., and Eliceiri, K. W. (2012).
A call for bioimaging software usability.
Chilana, P. K., Wobbrock, J. O., and Ko, A. J. (2010). Un-
derstanding usability practices in complex domains.
In Conference on Human Factors in Computing Sys-
tems - Proceedings, volume 4, pages 2337–2346, New
York, New York, USA. ACM Press.
Cingolani, P., Platts, A., Coon, M., Nguyen, T., Wang, L.,
Land, S., Lu, X., and Ruden, D. (2012). A program
for annotating and predicting the effects of single nu-
cleotide polymorphisms, snpeff: Snps in the genome
of drosophila melanogaster strain w1118; iso-2; iso-3.
Fly, 6(2):80–92.
Cl
´
ement, L., Emeric, D., J, G. B., Laurent, M., David,
L., Eivind, H., and Kristian, V. (2018). A data-
supported history of bioinformatics tools. arXiv
preprint arXiv:1807.06808.
de Matos, P., Cham, J. A., Cao, H., Alc
´
antara, R., Rowland,
F., Lopez, R., and Steinbeck, C. (2013). The Enzyme
Portal: A case study in applying user-centred design
methods in bioinformatics. BMC Bioinformatics, 14.
Galperin, M. Y. (2008). The molecular biology database
collection: 2008 update. Nucleic Acids Research,
36(SUPPL. 1):D2.
Goodwin, S., McPherson, J. D., and McCombie, W. R.
(2016). Coming of age: Ten years of next-generation
sequencing technologies. Nature Reviews Genetics,
17(6):333–351.
I
˜
niguez-Jarrin, C. (2019). GenomIUm: A Pattern Based
Method for Designing User Interfaces for Genomic
Data Access. PhD thesis, Universitat Polit
`
ecnica de
Val
`
encia.
Jaspers, M. W. (2009). A comparison of usability methods
for testing interactive health technologies: Method-
ological aspects and empirical evidence. International
Journal of Medical Informatics, 78(5):340–353.
Javahery, H. and Seffah, A. (2002). A Model for Us-
ability Pattern-Oriented Design. In Proceedings of
the First International Workshop on Task Models
and Diagrams for User Interface Design, TAMODIA
’02, pages 104–110. INFOREC Publishing House
Bucharest.
Javahery, H., Seffah, A., and Radhakrishnan, T. (2004).
Beyond Power: Making Bioinformatics Tools User-
centered. Commun. ACM, 47(11):58–63.
Mardis, E. R. (2011). A decade’s perspective on DNA se-
quencing technology. Nature, 470(7333):198–203.
Patern
`
o, F. (2003). ConcurTaskTrees: An Engineered Nota-
tion for Task Models. The Handbook of Task Analysis
for Human-Computer Interaction, pages 483–503.
Pavelin, K., Cham, J. A., de Matos, P., Brooksbank, C.,
Cameron, G., and Steinbeck, C. (2012). Bioinformat-
ics meets user-centred design: A perspective. PLoS
Computational Biology, 8(7):e1002554.
Preece, J., Rogers, Y., and Sharp, H. (2015). Interaction de-
sign: beyond human-computer interaction. John Wi-
ley & Sons Inc, 4 edition.
ENASE 2021 - 16th International Conference on Evaluation of Novel Approaches to Software Engineering
34

Rimmer, J. (2004). Improving software environments
through usability and interaction design.
Rutherford, P., Abell, W., Churcher, C., McKinnon, A., and
McCallum, J. (2010). Usability of navigation tools
for browsing genetic sequences. In Conferences in Re-
search and Practice in Information Technology Series,
volume 106, pages 33–41.
Stephens, Z. D. et al. (2015). Big data: Astronomical or
genomical? PLoS Biology, 13(7):e1002195.
Stevens, R., Goble, C., Baker, P., and Brass, A. (2001). A
classification of tasks in bioinformatics. Bioinformat-
ics, 17(2):180–188.
Sutcliffe, A., Thew, S., De Bruijn, O., Buchan, I., Jarvis, P.,
McNaught, J., and Procter, R. (2010). User engage-
ment by user-centred design in e-Health. In Philo-
sophical Transactions of the Royal Society A: Mathe-
matical, Physical and Engineering Sciences, volume
368, pages 4209–4224. Royal Society.
Svanæs, D., Das, A., and Alsos, O. A. (2008). The con-
textual nature of usability and its relevance to medical
informatics. In Studies in Health Technology and In-
formatics, volume 136, pages 541–546.
Toxboe, A. (2007). User interface design pattern library.
Tran, D., Dubay, C., Gorman, P., and Hersh, W. (2004).
Applying task analysis to describe and facilitate bioin-
formatics tasks. In Studies in Health Technology and
Informatics, volume 107, pages 818–822.
Valentin, F., Squizzato, S., Goujon, M., McWilliam, H.,
Paern, J., and Lopez, R. (2010). Fast and efficient
searching of biological data resources-using EB-eye.
Briefings in Bioinformatics, 11(4):375–384.
Wu, G. A. et al. (2014). Sequencing of diverse mandarin,
pummelo and orange genomes reveals complex his-
tory of admixture during citrus domestication. Nature
Biotechnology, 32(7):656–662.
Wu, G. A. et al. (2018). Genomics of the origin and evolu-
tion of Citrus. Nature, 554(7692):311–316.
Applying User Centred Design to Improve the Design of Genomic User Interfaces
35
