
Task Specific Image Enhancement for Improving the Accuracy of CNNs
Norbert Mitschke, Yunou Ji and Michael Heizmann
Institute of Industrial Information Technology, Karlsruhe Institute of Technology, Hertzstraße 16, Karlsruhe, Germany
Keywords:
CNNs, Image Enhancement, Deep Learning, Pre-processing, Invariant Features.
Abstract:
Choosing an appropriate pre-processing and image enhancement step for CNNs can have a positive effect on
the performance. Pre-processing and image enhancement are in contrast to augmentation deterministically ap-
plied on every image of a data set and can be interpreted as a normalizing way to construct invariant features.
In this paper we present a method that determines the optimal composition and strength of various image en-
hancement methods by a neural network with a new type of layer that learns the parameters of optimal image
enhancement. We apply this procedure on different image classification data sets, which leads to an improve-
ment of the information content of the images with respect to the specific task and thus also to an improvement
of the resulting test accuracy. For example, we can reduce the classification error for our benchmark data sets
clearly.
1 INTRODUCTION
CNNs are the state of the art for most image pro-
cessing tasks such as classification or segmentation.
However, a CNN has usually millions of parameters
that need to be determined in the training phase us-
ing annotated images. The objective of the training
is to learn a CNN with highly invariant features to
reduce the gap in accuracy between training and test
data. Invariance to certain variations must be taught
to CNN in training, as CNNs are usually very sensi-
tive to small variations in image data such as trans-
lation (Azulay and Weiss, 2018), scale (van Noord
and Postma, 2017) or contrast (Hernández-García and
König, 2018). One reason for this is that CNNs
learn few individual manifestations of a class from
the training images by memorizing them (overfitting).
Typical variations for which CNNs should be invari-
ant include illumination variations, noise, affine trans-
formations, or different contrasts and may depend on
the process of acquiring the images.
In practice, there are mainly two methods for con-
structing invariant features which can be combined:
the integrative way and the normalizing way (Schulz-
Mirbach, 1994). The integrative way for CNNs is
done by data augmentation which is highly inves-
tigated in (Cubuk et al., 2018), (DeVries and Tay-
lor, 2017), (Hauberg et al., 2016), (Krizhevsky et al.,
2012) and (Wang and Perez, 2017) and by using large
data sets. This contribution addresses the second
way, the normalizing method, which corresponds to a
pre-processing or image enhancement step for CNNs.
Augmentation and image enhancement can in princi-
ple be carried out using the same methods, e. g. Gaus-
sian filtering. They differ, however, in that during
augmentation these methods or their parameters are
subject to stochastics, whereas pre-processing is de-
terministic.
1.1 Related Work
CNNs are themselves used to enhance images such as
underwater images (Li et al., 2019), infrared images
(Lee et al., 2017) and (Choi et al., 2016), or generally
to enhance the perception of the human eye (Talebi
and Milanfar, 2018). Cheng et al. (Cheng and Yan,
2019) fuses the results of three different image en-
hancement techniques using CNNs to obtain the best
possible illuminated image. However, investigating
the performance of CNNs using enhanced image data
is a little studied issue, since often only few selected
processing methods are examined for a certain task.
SAR images suffer from poor contrast and il-
lumination, atmospheric noise, sensor noise and
the limited resolution of the imaging device. In
(Sree Sharmila et al., 2014) it is shown that denoising
and resolution enhancement of SAR images improves
the classification performance of a support vector ma-
chine by preserving edges and contour details. Using
a similar procedure, X-ray images of hands are pre-
174
Mitschke, N., Ji, Y. and Heizmann, M.
Task Specific Image Enhancement for Improving the Accuracy of CNNs.
DOI: 10.5220/0010186301740181
In Proceedings of the 10th International Conference on Pattern Recognition Applications and Methods (ICPRAM 2021), pages 174-181
ISBN: 978-989-758-486-2
Copyright
c
2021 by SCITEPRESS – Science and Technology Publications, Lda. All rights reserved

processed for CNNs in (Calderon et al., 2018). The
CNN becomes better in its regression task through
these operations.
In (Graham, 2015), image enhancement is used
to better recognize the manifestations of the eye dis-
ease diabetic retinopathy on image material. By sub-
tracting the mean color level, rescaling and clipping
the borders, variations in lighting and camera resolu-
tion are reduced. It can be shown that pre-processing
steps such as subtraction of the mean color value,
variance-based standardization and zero component
analysis can increase the classification accuracy of
various small CNNs (Pal and Sudeep, 2016).
Besides the architecture and parameters of CNNs
Mishkin et al. (Mishkin et al., 2017) examined also
pre-processing steps. In addition to rescaling and
random crop, the use of a transformation with a
(1 × 1) convolution led to a performance gain. Fur-
thermore, different color spaces were investigated. It
was shown that the RGB color space is superior to
other color spaces including various grayscale color
spaces. Handcrafted methods such as local histogram
stretching led to a deterioration of the trained CNN.
The authors of (Rachmadi and Purnama, 2015) also
investigated the behavior of CNNs at different color
spaces to determine the color of vehicles on images.
Here, as well, the RGB color space proved to be ad-
vantageous.
In (Chen et al., 2020), pre-processing is used ex-
plicitly for normalization. Handwritten letters are
normalized with regard to different writing habits
such as angle, position, size and stroke width. This
reduces the variation of individual characters, result-
ing in greater accuracy in the classification of unseen
data by CNN.
A comparison of various image enhancement
methods for detecting facial expressions with CNNs
is described in (Pitaloka et al., 2017). The examined
methods are considered individually and the respec-
tive results are compared.
1.2 Contributions
In this paper we present a method for the automatic
search for an optimal pre-processing policy. We
use different classical image enhancement methods
to pre-process images, which are then weighted and
summed up. The classic methods have on the one
hand the advantage over image enhancement using
CNNs that they can be efficiently computed on the
CPU, but on the other hand they cannot be represented
by the operations of a CNN in general. Using param-
eters found by our method, the original images are
processed first so that the enhanced images are avail-
able before the training phase. The weights of the
corresponding enhancement methods are determined
for each data set by a neural network with a new type
of layer.
1.3 Outline
In Sec. 2, we introduce the image enhancement tech-
niques used and our method of combining them. Then
we describe the experimental setup und the used data
sets in Sec. 3. Afterwards, we present in Sec. 4 the
results for our procedure and compare them to the re-
sults we achieve with the single image enhancement
procedures. In Sec. 5 we draw our conclusion.
2 PROPOSED METHOD
In this section we first describe the classic image en-
hancement and pre-processing methods used. We
then show how we combine the images and then how
we determine the optimal parameters in the training
phase.
2.1 Classic Enhancement Methods
In this section we give a brief description of the im-
age enhancement methods used which mostly origi-
nate from (Beyerer et al., 2015).
Contrast stretching maps the image values to fully
use the available value range. In a typical case the
minimum value is mapped to 0, and the maximum
to 255; all the values in between are mapped lin-
early according to these values. Histogram equaliza-
tion maps the image values with a nonlinear function
to fully use the available value range, and results in
uniformly distributed image values. Contrast limited
adaptive histogram equalization (CLAHE) (Heckbert,
1994) equalizes the values of local areas in the image.
Typically, the original image is divided into 4, 16, or
64 smaller parts, and equalized.
Homomorphic filtering filters out the effect of in-
homogeneous illumination by applying a high pass
filter on a logarithmically transformed image. Image
sharpening amplifies high frequencies in the image.
Illumination effects are reduced; edges and image de-
tails are amplified. Gaussian blur amplifies low fre-
quencies in the image. Edges and image details are
blurred; noise is reduced.
Bilateral filtering smooths the image while pre-
serving its most prominent edges. As a result the im-
age loses its details, but not the coarse structure. Ho-
mogenization of first degree transforms the image, so
Task Specific Image Enhancement for Improving the Accuracy of CNNs
175
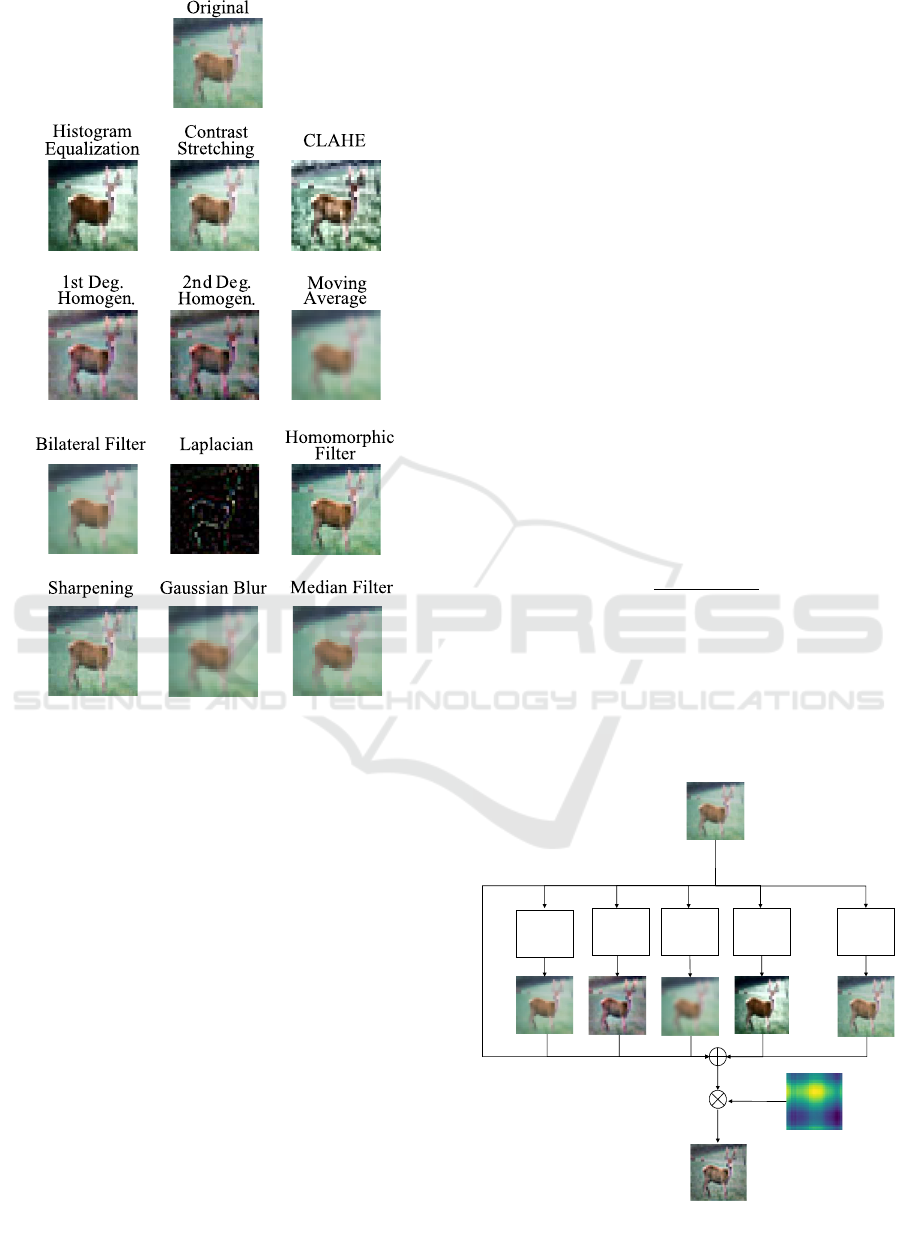
Figure 1: Operations from Sec. 2.1.
that the local mean value is independent from the im-
age location. Homogenization of second degree trans-
forms the image, so that the local mean value and the
local variance are independent from the image loca-
tion.
We also use moving average filtering, median fil-
tering and the Laplacian as possible pre-processing
methods. The operations with typical parameters are
shown in Fig. 1.
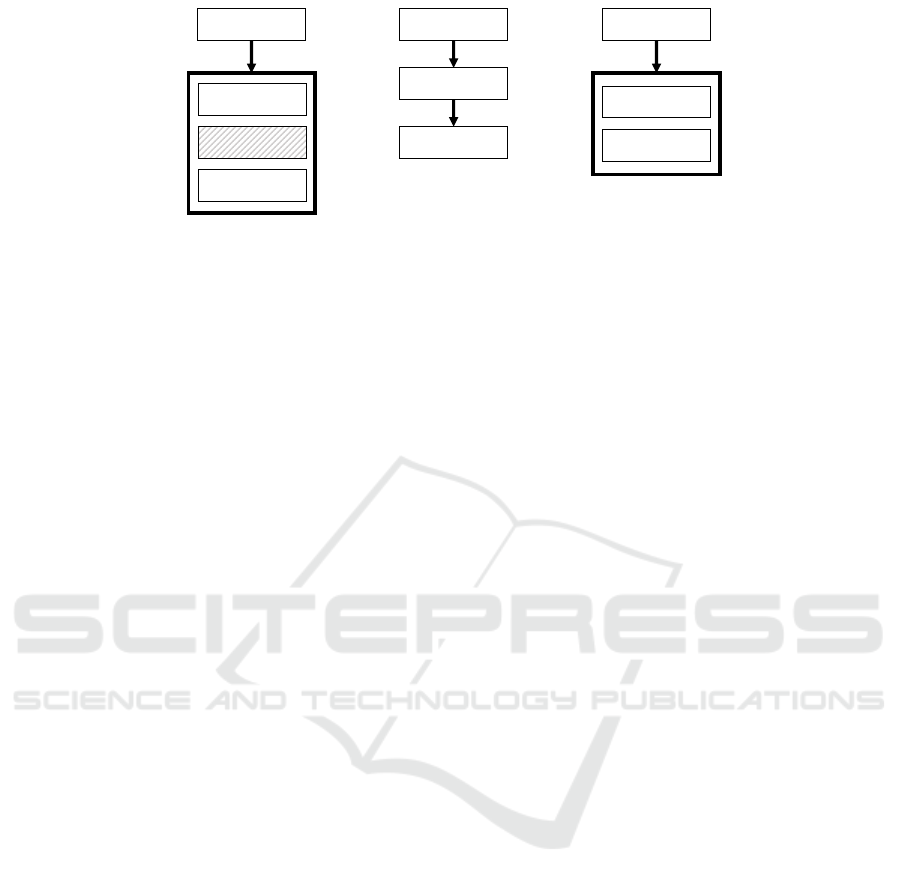
2.2 Composition of Image
Enhancement Methods
In the following we describe how we combine the
images from the enhancement methods to obtain a
higher quality image. The procedure is illustrated in
Fig. 2. We use the N = 12 image enhancement meth-
ods presented in section 2.1 and the original image I.
Each image enhancement method is represented by its
function F
i
(I;a
i
), which is a linearized function of its
original enhancement function G
i
(I;b
i
).
Since the methods are highly non-linear with re-
spect to their parameters x, we linearize the individ-
ual image enhancement methods as in (Hataya et al.,
2019) to be able to calculate a gradient. For this pur-
pose, we select a set of maximum parameters b
(max)
i
for each method G
i
, with which we calculate an image
I
(max)
i
= G
i
(I;b
(max)
i
). We get the linearized function
by
I
i
= F
i
(I;a
i
) = (1 − a
i
) · I +a
i
· I
(max)
i
(1)
with a
i
∈ [0, 1]. We choose this representation of the
function F
i
because a representation that depends on
the parameters of the operation such as the kernel size
k cannot be differentiated.
We obtain the resulting image I
res
by a weighted
sum of the N = 12 enhanced images I
i
∈ [0, ..., 255] ×
[0, ..., 255], i = 0, ..., N and the original image I by
I
res
=
N
∑
i=0
ϑ
i
· I
i
=
N
∑
i=0
ϑ
i
· F
i
(I;a
i
), (2)
with I
0
= I and
∑
N
i=0
ϑ
i
= 1 with ϑ
i
∈ [0, 1].
To use the resulting image as input to a CNN, it is
modified as follows:
x
in
=
I
res
− µ
max|I
res
− µ|
, (3)
where µ is the mean value of I
res
. The described im-
age pre-processing is thus completely described by
2N + 1 = 25 parameters.
An extension for the procedure is the use of a win-
dow function W = w
T
V
w
H
∈ [0, 1] × [0, 1] that weights
…
Original Image I
Window 𝒘
Resulting Image 𝑰
𝐫𝐞𝐬
ϑ
0
ϑ
1
ϑ
2
ϑ
3
ϑ
4
ϑ
N
𝐹
4
(𝑰; 𝑎
4
)𝐹
2
(𝑰; 𝑎
2
) 𝐹
3
(𝑰; 𝑎
3
)
𝐹
1
(𝑰; 𝑎
1
)
𝐹
𝑁
(𝑰; 𝑎
𝑁
)
Figure 2: The structure of the proposed combine layer.
ICPRAM 2021 - 10th International Conference on Pattern Recognition Applications and Methods
176
Original data set
Combine layer
VGG-16 feature
extractor
Dense layer
Reading weights
of combine layer
Enhance original
data set
Saving enhanced
data set
Enhanced data set
VGG-16 feature
extractor
VGG-16 top
Step 1 Step 2 Step 3
Figure 3: Overview of our process. The hatched objects are parts of the neural network with frozen weights.
each pixel depending on its position in the image by
I
(w)
res
= W
N
∑
i=0
ϑ
i
· I
i
. (4)
Especially for classification tasks, the relevant object
is usually located in the centre of the image. With the
help of the windowing, interfering information at the
edge could be suppressed. The windowing function
is decomposed into two vectors in order to keep the
number of parameters low.
2.3 Data Set Enhancement
To find the optimal parameters for the method pre-
sented in Sec. 2.2, we use a VGG-16 network that is
pre-trained on ImageNet without top. The weights of
the VGG-16 network remain constant over the whole
process. We add a global averaging pooling layer and
a trainable dense layer with softmax activation as new
top. A so-called combination layer is inserted in front
of the VGG-16 network, which integrates the proce-
dure from Sec. 2.2 and thus contains 2N + 1 trainable
weights corresponding to a
i
and ϑ
i
∀i and, if applica-
ble, weights for the window function. The resulting
CNN is then trained with the original data set.
After the first training, the images of the original
data set are then enhanced with the resulting parame-
ters of the combination layer. The last step is to train
a new model with the enhanced images from scratch.
The achieved test accuracy is the benchmark for the
results. The overall procedure is illustrated in Fig. 3.
We use a VGG-16 model with randomly initialized
weights as model for the third step.
In both training steps the classification task of the
data set is learned. With corresponding other pre-
trained CNNs, not only classification task, but also
detection and segmentation tasks can be performed
with our procedure, since only a combination layer
has to be inserted in front of the corresponding neural
network.
3 EXPERIMENTAL SETUP
In this chapter we first describe how the training pro-
cess is conducted and then the data sets used.
3.1 Training Setup
For every training session we use the Nadam opti-
mizer with the learning rate 0.002 and an L
2
regular-
ization with λ
2
= 1 · 10
−5
. The learning rate decays
cosine like. Each experiment is repeated three times
and the results are averaged.
During the training of the combination layer we do
not use augmentation, because on the one hand edges
due to affine transformations or cutout have a negative
influence on the image enhancement methods and on
the other hand the normalizing effect of some image
enhancement steps can be lost by certain augmenta-
tion like variations in brightness. We do not want to
use task specific augmentation, as this would lead to
an unfair comparison, as the augmentation policies
were optimised for the original data set and not the
enhanced data set. Furthermore, we want to show
that augmentation and image enhancement are com-
binable methods to improve CNNs. Therefore, we
use a baseline augmentation which consists of mir-
roring (except SVHN), cropping and cutout (DeVries
and Taylor, 2017) in the final training phase.
The pre-trained CNN is trained for 25 epochs to
determine the parameters of the combination layer.
With the resulting images a new VGG-16 model is
trained for 50 epochs with the pre-processed images.
3.2 Data Sets
In the following, the five data sets that we use for the
evaluation of the presented method are described.
The CIFAR 10 and the CIFAR 100 data set
(Krizhevsky and Hinton, 2009) consist of 60,000
Task Specific Image Enhancement for Improving the Accuracy of CNNs
177

RGB images of size 32 × 32 and represent an ob-
ject classification task with 10 and 100 classes respec-
tively. Both data sets are split up in 50,000 images for
training and 10,000 images for testing the classifier.
The third data set used is the Street View House
Numbers (SVHN) data set (Netzer et al., 2011) which
contains RGB images of real world digits taken from
Google Street View. The size of the images is 32 ×32.
The test data set consists of 26,032 images and the
training data set is enlarged to 138,610 images using
the provided extra data set to obtain an identical num-
ber of images per class.
The North Eastern University Surface Defect
(NEU-SD) data set (Song et al., 2014) consists of
six classes each with 300 grayscale images with size
200×200. We sampled down the images to 192×192
pixels and created a test data set with 540 images. The
remaining 1,260 images were used for training.
The last data set examined is the Intel Image Clas-
sification (IIC) data set. It contains 14,000 train-
ing images and 3,000 test images of natural environ-
ments. These are categorised in six different classes.
The image size is 150 × 150 pixels.
4 RESULTS
In this section we will first examine the influence of
the maximum parameters b
(max)
i
and the pre-trained
CNN in Sec. 4.2. In Sec. 4.3 we analyse the enhanced
images resulting from our method. Afterwards we
consider the impact of the enhanced images on the
classification task in Sec. 4.4.
4.1 Preliminary Tests
Before we start the experiments on the presented
method, we first look at the individual image enhance-
ment procedures for all data sets from Sec. 3.2. The
results are shown in Tab. 1.
The results show that the classifier reacts very sen-
sitively to a bad choice of image pre-processing, i.e.
an unsuitable procedure leads to a detailed deteriora-
tion, while a good choice leads to a slight improve-
ment. We see for CIFAR 10 and NEU-SD that proce-
dures with high-pass character tend to lead to an im-
provement, while procedures with low-pass character
should be avoided. For the SVHN data set, global
contrast stretching and low-pass filters are advanta-
geous.
Table 1: Best three and worst three image enhancement
methods for CIFAR 10, SVHN and NEU-SD. The number
in brackets indicates the improvement (degradation) of the
test accuracy compared to the method without image en-
hancement in percentage points. Theses test accuracies are
94.65% (CIFAR 10), 97.01% (SVHN) and 98.95% (NEU-
SD).
CIFAR 10 SVHN NEU-SD
Homomorphic
(+0.19%)
Homomorphic
(+0.07%)
Sharpening
(+0.31%)
Contrast St.
(+0.17%)
Contrast St.
(+0.04%)
Contrast St.
(+0.14%)
Sharpening
(−0.01%)
Moving Av.
(+0.03%)
Homomorphic
(+0.12%)
... ... ...
Median
(−3.87%)
CLAHE
(−1.11%)
Histogram Eq.
(−0.57%)
Moving Av.
(−3.89%)
Hom. (1)
(−4.06%)
Hom. (1)
(−1.32%)
Hom (2)
(−69.59%)
Hom (2)
(−5.76%)
Hom (2)
(−35.26%)
4.2 Acquiring the Composition
Parameters
The maximum parameters b
(max)
i
are essential for the
determination of the parameters ϑ
i
and a
i
, as they
define the maximum possible change and sensitivity
during the initial training phase. The parameters are
generally dependent on the data set and especially the
image size.
Beside some parameter-free methods like contrast
stretching or histogram equalization most of the en-
hancement methods can be described by the kernel
size k of the filter, the standard deviation σ of the
used low pass filter and/or the attenuation factor α.
The latter only plays a role for sharpening and for the
homomorphic filter.
For the data sets with the image size 32 × 32 we
get as optimal kernel size k = 3 and σ = 3 and for
NEU-SD and ICC we get k = 5 and σ = 5. For larger
values of k we get slightly worse accuracies and the
calculation effort is considerably higher. For k = 3 we
get a clear diminution of the accuracy. Interestingly,
the kernel size k and the standard deviation σ have
a hardly detectable influence on the resulting distri-
bution of the parameters ϑ
i
. By variation of α the
proportion ϑ
i
of the two corresponding procedures is
strongly influenced. For CIFAR 10, the homomorphic
filter has its maximum share at α = 0.2 with 23.2%
and the sharpening at α = 0.6 with 81.6%, if the re-
spective other method is suppressed. For the respec-
tive values α we also obtain maxima in the resulting
accuracy.
ICPRAM 2021 - 10th International Conference on Pattern Recognition Applications and Methods
178
We chose VGG-16 for the pre-trained model be-
cause tests with CIFAR 10 showed the highest accu-
racy with our image enhancement method compared
to other networks. For VGG-16 we get an accuracy of
94.64%, while for VGG-19 we get 94.56%, for Mo-
bileNet 94.51% and for ResNet-50 94.45%.
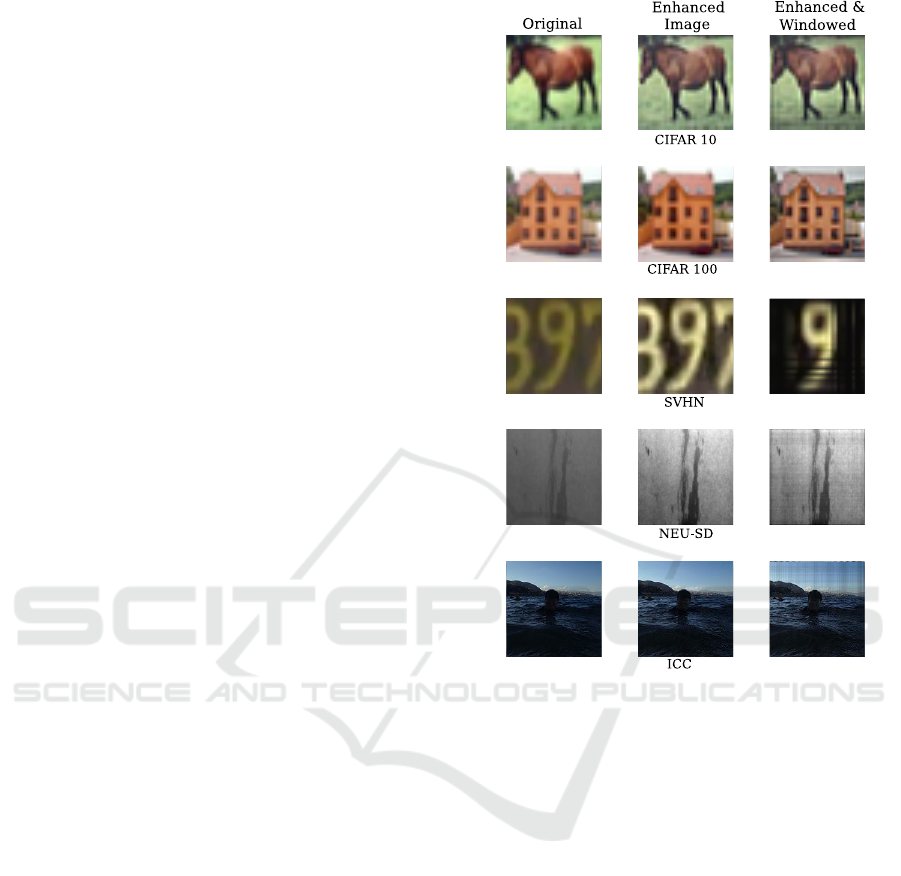
4.3 Analysis of the Enhanced Images
The resulting images of our image enhancement tech-
nique are shown in Fig. 4 and the corresponding pa-
rameters are presented in Tab. 2. More images can be
found in the appendix.
In general, the values of our procedure with and
without windowing from Tab. 2 are very similar for
all data sets. The difference in windowing is most no-
table in the SVHN data set. The larger the images,
the less concentrated the distribution on individual
methods such as sharpening for CIFAR and contrast
stretching for SVHN.
As mentioned above, sharpening is the most af-
fecting operation for both CIFAR 10 and CIFAR 100.
This operation as well as contrast stretching, which
has the second highest contribution to CIFAR 100,
have a high-pass character and thus amplify contours
but also noise. Operations with a low-pass character
such as moving average filter, Gaussian blur and bilat-
eral filter have a negligible influence due to their small
proportion. This shows that the contribution of high
frequencies, i. e. the details, to the information con-
tent of the original images is amplified. When look-
ing at the CIFAR 10 and CIFAR 100 example image
in Fig. 4, it is noticeable that the enhanced images ap-
pear much sharper than the original images. In addi-
tion, the images have a more homogeneous brightness
and saturation. An explicit windowing is not visible
with either CIFAR 10 or CIFAR 100. However, when
windowing is applied, the optimization leads to inten-
sified high-pass character.
In the case without windowing, histogram equal-
ization, contrast stretching and the Laplace operator
are the dominant methods for SVHN. These lead to a
higher contrast and stronger edges in the image, mak-
ing the digits more clearly visible. When applying
windowing, the border areas are faded out so that only
the central digit can be seen. Furthermore, single rows
and columns are faded out, which leads to black lines
in the image. In the example image in Fig. 4 this leads
to the fact that instead of the number 397 only the
digit 9 is visible. In the pre-processing methods the
Laplacian loses weight compared to histogram equal-
ization and CLAHE.
For the NEU-SD data set, the values for ϑ
i
, which
were determined with and without windowing, hardly
Figure 4: One example of the enhanced images with and
without windowing for each data set.
differ. The effect of the windowing is similar to the
one we saw in CIFAR. In this data set we want to em-
phasize the strong proportion of 1st degree homog-
enization. This eliminates variations in the lighting
that occur in this data set. The resulting images have
a remarkable higher contrast, which makes the defects
more clearly visible.
Also for the last data set (ICC) we have a simi-
lar influence of the windowing. The lines created by
windowing are more clearly visible here. Contrast-
stretching methods are predominant, which are com-
bined with the original or slightly modified (a
i
≤
0.03) image. This leads to a slightly brighter, higher
contrast image.
Although windowing is apparently useful for data
sets where the relevant objects are always at the same
place, windowing can also be advantageous since a
joint optimisation leads to an intensification of the rel-
evant attributes in the image.
Task Specific Image Enhancement for Improving the Accuracy of CNNs
179
Table 2: Obtained values for 100 · ϑ
i
and 100 · a
i
for the different data sets and depending on whether we use a window (W)
or not (E). A number in brackets indicates that the corresponding image is the original image due to a
i
= 0.
CIFAR 10 CIFAR 100 SVHN NEU-SD ICC
E W E W E W E W E W
ϑ
i
a
i
ϑ
i
a
i
ϑ
i
a
i
ϑ
i
a
i
ϑ
i
a
i
ϑ
i
a
i
ϑ
i
a
i
ϑ
i
a
i
ϑ
i
a
i
ϑ
i
a
i
Original 0 - 1 - 1 - 1 - 0 - 0 - 6 - 5 - 6 - 5 -
Histogram Eq. 1 91 2 99 2 52 3 58 18 99 31 99 (7) 0 (5) 0 18 58 15 44
Contrast St. 1 99 1 99 10 99 10 99 49 99 43 99 8 22 8 28 11 99 14 99
CLAHE (1) 0 (1) 0 (2) 0 (2) 0 4 99 11 99 7 11 6 6 17 99 18 99
Hom. (1) 4 99 6 99 2 40 5 50 0 33 2 99 12 32 14 40 (5) 0 5 9
Hom. (2) (1) 0 2 40 (2) 0 3 2 7 99 7 99 (8) 0 (6) 0 (7) 0 (4) 0
Moving Av. 0 1 0 0 1 21 (1) 0 2 99 0 98 6 11 6 19 (5) 0 5 1
Bilateral 1 84 1 34 1 55 (2) 0 0 0 0 0 6 11 6 20 (4) 0 (6) 0
Laplacian 1 70 1 70 (1) 0 (1) 0 17 99 4 99 (6) 0 (6) 0 (5) 0 5 1
Homomorpic 0 0 0 5 (1) 0 (1) 0 1 99 2 99 7 20 10 30 (6) 0 5 1
Sharpening 89 99 82 99 74 99 67 99 0 0 0 99 13 35 14 37 5 8 7 33
Gaussian Blur 0 1 (1) 0 1 22 (1) 0 2 99 0 98 7 18 5 19 5 3 6 4
Median 1 99 2 99 2 18 3 78 0 0 0 99 7 20 9 29 (6) 0 5 12
4.4 Results of the Classification Task
In the following the effect of our image enhancement
scheme on the classification accuracy of the data sets
is examined. The results are shown in Tab. 3.
For all data sets, regardless of whether a window
was used, our method leads to an improvement over
the baseline method without image enhancement. For
CIFAR 10 and CIFAR 100 the accuracy with the win-
dowing is higher than without. Here the symbiotic
effect of the windowing becomes clear.
For the SVHN data set we also get an improve-
ment in accuracy through our image enhancement
procedure. For the windowing, however, the result
is getting worse. The reason for this is that the test
data contains images where the digit is not centered.
Using the NEU-SD data set we obtain qualita-
tively the same results as with CIFAR 10 and CIFAR
100. The test error can be reduced from 1.05% to
0.28%, which corresponds to a relative reduction of
about 73%. The effect of windowing on the ICC data
set is minimal. Nevertheless, the test accuracy can be
increased by our image enhancement.
Overall, the results show that pre-processing tends
Table 3: Test accuracy in percent for the different data sets.
We compare the test accuracy of the non-enhanced data set
(-) with the enhanced data sets with (W) or without (E) win-
dowing.
- E W
CIFAR 10 94.64% 94.77% 95.26%
CIFAR 100 73.75% 74.32% 75.07%
SVHN 97.01% 97.20% 96.89%
NEU-SD 98.95% 99.26% 99.72%
ICC 92.27% 92.92% 92.90%
to be more effective the fewer images are available in
absolute terms or per class.
Compared to the results from Sec. 4.1, the
achieved accuracies are in the range of the accura-
cies of the best combination of our method without
windowing. However, our method has the advantage
that image enhancement is learned in half a training
cycle, rather than the N + 1 cycles that are necessary
to compare all methods. This accelerates the process
by a factor of about
N+1
2
. In addition, methods can be
built into our method that are not useful on their own,
such as the Laplacian.
5 CONCLUSION
In this paper we presented a method to determine an
optimal image enhancement strategy for a data set
based on a novel CNN layer to improve the classi-
fication performance on this data set. For this pur-
pose we fed a CNN with fixed weights with 12 im-
ages resulting from image enhancement procedures
and the original image. The optimal composition of
the images and the strength of the respective proce-
dure was learned. The resulting images are used to
train a VGG-16 net. For each of the data sets exam-
ined, we were able to determine an optical and quanti-
tative improvement through our method. Through ad-
ditional windowing, the effect of the image enhance-
ment could be strengthened on the one hand and on
the other hand, irrelevant objects were faded out if the
target object was always in the same position. Us-
ing the NEU-SD data set as an example, it could also
be shown that our method is particularly suitable for
ICPRAM 2021 - 10th International Conference on Pattern Recognition Applications and Methods
180

data sets that a user has produced by hand for his spe-
cific target. These targets can be the defect detection
or texture extraction in industrial data sets, where im-
ages suffer severely from uneven lighting, suboptimal
focusing or poor contrast.
REFERENCES
Azulay, A. and Weiss, Y. (2018). Why Do Deep Convolu-
tional Networks Generalize So Poorly to Small Image
Transformations? arXiv preprint arXiv:1805.12177.
Beyerer, J., Puente León, F., and Frese, C. (2015). Machine
Vision: Automated Visual Inspection: Theory, Prac-
tice and Applications. Springer.
Calderon, S., Fallas, F., Zumbado, M., Tyrrell, P., Stark, H.,
Emersic, Z., Meden, B., and Solis, M. (2018). Assess-
ing the Impact of the Deceived non Local Means Fil-
ter as a Preprocessing Stage in a Convolutional Neural
Network Based Approach for Age Estimation Using
Digital Hand X-Ray Images. In 2018 25th IEEE In-
ternational Conference on Image Processing (ICIP),
pages 1752–1756. IEEE.
Chen, T., Fu, G., and Wang, H.and Li, Y. (2020). Research
on Influence of Image Preprocessing on Handwritten
Number Recognition Accuracy. In The 8th Interna-
tional Conference on Computer Engineering and Net-
works (CENet2018), pages 253–260, Cham. Springer
International Publishing.
Cheng, Y. and Yan, J.and Wang, Z. (2019). Enhancement
of Weakly Illuminated Images by Deep Fusion Net-
works. In 2019 IEEE International Conference on Im-
age Processing (ICIP), pages 924–928. IEEE.
Choi, Y., Kim, N., Hwang, S., and Kweon, I. S. (2016).
Thermal Image Enhancement Using Convolutional
Neural Network. In 2016 IEEE/RSJ International
Conference on Intelligent Robots and Systems (IROS),
pages 223–230. IEEE.
Cubuk, E., Zoph, B., Mané, D., Vasudevan, V., and Le, Q.
(2018). AutoAugment: Learning Augmentation Poli-
cies from Data. CoRR, abs/1805.09501.
DeVries, T. and Taylor, G. (2017). Dataset Augmentation
in Feature Space. arXiv preprint arXiv:1702.05538.
Graham, B. (2015). Kaggle Diabetic Retinopathy Detection
Competition Report. University of Warwick.
Hataya, R., Zdenek, J., Yoshizoe, K., and Nakayama, H.
(2019). Faster AutoAugment: Learning Augmenta-
tion Strategies using Backpropagation. arXiv preprint
arXiv:1911.06987.
Hauberg, S., Freifeld, O., Larsen, A., Fisher, J., and Hansen,
L. (2016). Dreaming More Data: Class-Dependent
Distributions over Diffeomorphisms for Learned Data
Augmentation. In Artificial Intelligence and Statistics,
pages 342–350.
Heckbert, P. (1994). Graphics Gems IV (IBM Version). El-
sevier.
Hernández-García, A. and König, P. (2018). Data Aug-
mentation Instead of Explicit Regularization. arXiv
preprint arXiv:1806.03852.
Krizhevsky, A. and Hinton, G. (2009). Learning Multiple
Layers of Features from Tiny Images.
Krizhevsky, A., Sutskever, I., and Hinton, G. (2012). Ima-
genet Classification with Deep Convolutional Neural
Networks. In Advances in Neural Information Pro-
cessing Systems, pages 1097–1105.
Lee, K., Lee, J., Lee, J., Hwang, S., and Lee, S.
(2017). Brightness-Based Convolutional Neural Net-
work for Thermal Image Enhancement. IEEE Access,
5:26867–26879.
Li, C., Guo, C., Ren, W., Cong, R., Hou, J., Kwong, S., and
Tao, D. (2019). An Underwater Image Enhancement
Benchmark Dataset and Beyond. IEEE Transactions
on Image Processing.
Mishkin, D., Sergievskiy, N., and Matas, J. (2017). System-
atic Evaluation of Convolution Neural Network Ad-
vances on the Imagenet. Computer Vision and Image
Understanding, 161:11–19.
Netzer, Y., Wang, T., Coates, A., Bissacco, A., Wu, B., and
Ng, A. (2011). Reading Digits in Natural Images with
Unsupervised Feature Learning. In NIPS Workshop
on Deep Learning and Unsupervised Feature Learn-
ing, volume 2011, page 5.
Pal, K. and Sudeep, K. (2016). Preprocessing for Im-
age Classification by Convolutional Neural Networks.
In 2016 IEEE International Conference on Recent
Trends in Electronics, Information & Communication
Technology (RTEICT), pages 1778–1781. IEEE.
Pitaloka, D., Wulandari, A., Basaruddin, T., and Liliana, D.
(2017). Enhancing CNN with Preprocessing Stage in
Automatic Emotion Recognition. Procedia computer
science, 116:523–529.
Rachmadi, R. and Purnama, I. (2015). Vehicle Color
Recognition Using Convolutional Neural Network.
arXiv preprint arXiv:1510.07391.
Schulz-Mirbach, H. (1994). Constructing Invariant Features
by Averaging Techniques. In 12th IAPR International
Conference on Pattern Recognition, Jerusalem, Israel,
9-13 October, 1994, Volume 2, pages 387–390.
Song, K., Hu, S., and Yan, Y. (2014). Automatic Recogni-
tion of Surface Defects on Hot-Rolled Steel Strip Us-
ing Scattering Convolution Network. Journal of Com-
putational Information Systems, 10(7):3049–3055.
Sree Sharmila, T., Ramar, K., and Sree Renga Raja, T.
(2014). Impact of Applying Pre-Processing Tech-
niques for Improving Classification Accuracy. Signal,
Image and Video Processing, 8(1):149–157.
Talebi, H. and Milanfar, P. (2018). Learned Perceptual
Image Enhancement. In 2018 IEEE International
Conference on Computational Photography (ICCP),
pages 1–13. IEEE.
van Noord, N. and Postma, E. (2017). Learning Scale-
Variant and Scale-Invariant Features for Deep Image
Classification. Pattern Recognition, 61:583–592.
Wang, J. and Perez, L. (2017). The Effectiveness of Data
Augmentation in Image Classification Using Deep
Learning. Convolutional Neural Networks Vis. Recog-
nit.
Task Specific Image Enhancement for Improving the Accuracy of CNNs
181
