
TotemBioNet Enrichment Methodology: Application to the
Qualitative Regulatory Network of the Cell Metabolism
Laetitia Gibart, Gilles Bernot, H
´
el
`
ene Collavizza and Jean-Paul Comet
University C
ˆ
ote d’Azur, I3S Laboratory, UMR CNRS 7271, CS 40121, 06903 Sophia Antipolis Cedex, France
Keywords:
Formal Methods, Regulatory Networks, R. Thomas’ Modelling, Parameter Identification, Model Enrichment.
Abstract:
When designing a biological regulatory network, new information or wet experiments can require adding
variables or interactions, inside a previously validated model. They can result in complete reconsiderations
of established behaviours. Fortunately, formal methods allow for fully automated verification of properties,
and TotemBioNet is an efficient software integrating a collection of formal approaches for regulatory net-
works. It allowed us to develop a multidisciplinary methodology for designing large dynamical models in an
incremental way, including non regression proofs (preservation of important biological properties).
1 INTRODUCTION
In the ’70s, qualitative modelling of biological regula-
tory networks (Thomas, 1973; Glass, 1975) has led to
significant advances in the understanding of the main
causalities of some observed cell behaviours. Models
were handmade, and parameter identification mainly
used simulations (Gonzalez et al., 2006). In the early
2000s, formal methods automated the identification
of parameters, managing as a whole the exhaustive
sets of suited parameter settings (Bernot et al., 2004).
Software platforms handling formal methods (Khalis
et al., 2009; Batt et al., 2004; Paulev
´
e, 2017) have
made it possible to design regulatory graphs, where
numerous parameter values are compatible with the
biological knowledge, where simulations are help-
less, and where the slightest modification can have
huge consequences (Gebser et al., 2010; Khoodeeram
et al., 2017; Naldi et al., 2018).
Enrichments of models do not preserve previ-
ously established properties (Bernot and Tahi, 2009;
Siebert, 2009; Mabrouki et al., 2011). Nonethe-
less, in practice, the only way to design big regula-
tory models is to enrich previously validated mod-
els. So, we are moving into an era where intensive
verifications of formal properties play the role that
simulations played for handmade models: Model re-
vision becomes the current practice (Gouveia et al.,
2018). We describe here a methodology to effi-
ciently design large validated models by successive
small enrichments of previously validated ones. It
uses TotemBioNet, a software that offers opti-
mized management of the exhaustive set of parameter
values compatible with biological knowledge (Boyen-
val et al., 2020). Here, we describe our methodology
and we give a (very small but representative) example
of enrichment.It starts from one of the largest regu-
latory network model using the multivalued Thomas
framework (Snoussi, 1989), namely the generic reg-
ulation of the cell metabolism (Khoodeeram et al.,
2017). It abstracts the relationships between the main
actors of the metabolism in such a way that, for ex-
ample, the Crabtree/Warburg effects can be studied,
and their main causalities understood. The model
considers biomass as a whole, without distinguishing
between nucleic acids, proteins or lipids. Here, we
simply show how to distinguish between lipidic and
non lipidic biomass, so that the enrichment example is
small enough to focus on the TotemBioNet method
rather than describing detailed biological regulations.
Section 2 reminds the Thomas approach and
the formal methods implemented in TotemBioNet.
Section 3 presents our methodology, including the
role of different kinds of behaviour “property matri-
ces” that greatly aid decision making for model de-
sign. Section 4 shows the illustrating example.
2 TotemBioNet RATIONALS
TotemBioNet assists the design of R. Thomas’
qualitative regulatory network models. It handles all
the possible parameterizations, which is the key point
of the modelling process.
Gibart, L., Bernot, G., Collavizza, H. and Comet, J.
TotemBioNet Enrichment Methodology: Application to the Qualitative Regulatory Network of the Cell Metabolism.
DOI: 10.5220/0010186200850092
In Proceedings of the 14th International Joint Conference on Biomedical Engineering Systems and Technologies (BIOSTEC 2021) - Volume 3: BIOINFORMATICS, pages 85-92
ISBN: 978-989-758-490-9
Copyright
c
2021 by SCITEPRESS – Science and Technology Publications, Lda. All rights reserved
85
2.1 Thomas’ Modelling Framework
A regulatory network is a labelled directed graph in
which vertices are variables (represented by circles)
or multiplexes (rectangles). Variables abstract bio-
logical entities (gene products, biological functions
or metabolic pathways) and multiplexes contain for-
mulas that encode situations where a group of vari-
ables (inputs of multiplexes) influence the evolution
of some variables (outputs of multiplexes), the sim-
plest multiplexes being the formations of complexes
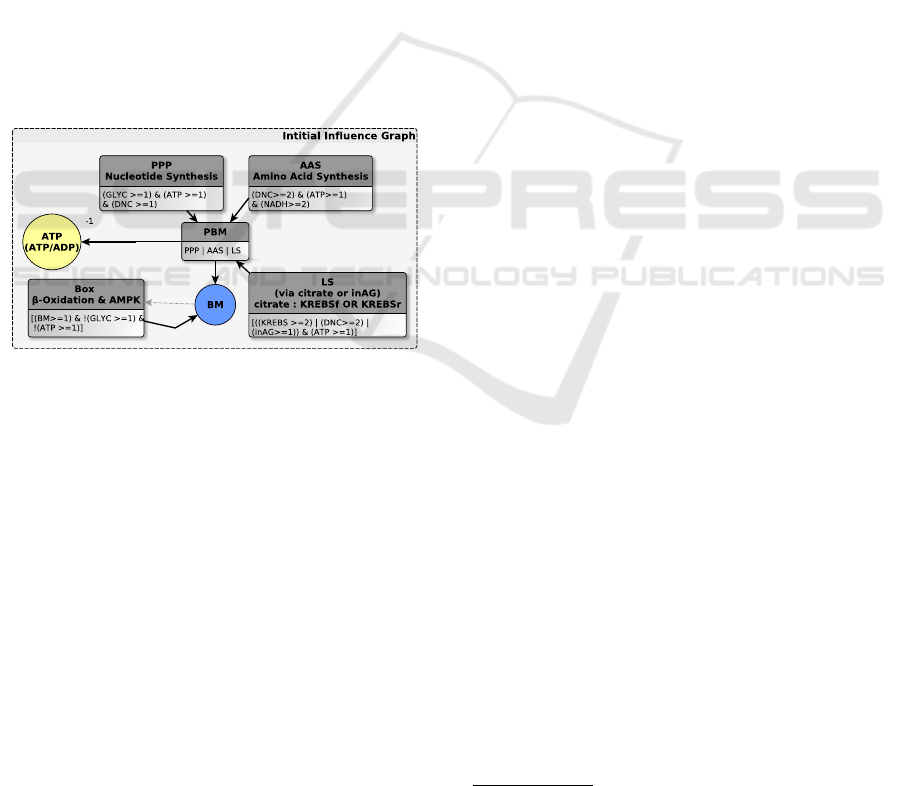
(the formula contains a simple conjunction). In Fig. 1
the multiplex PBM abstracts the biomass production,
it targets variables BM (BioMass) and ATP. It is ac-
tivated when at least one of the multiplexes AAS, LS
or PPP is activated. Among others, AAS abstracts the
amino acid synthesis process. It summarizes the ele-
ments necessary for the de novo production of amino
acids (Berg et al., 2002): nitrogen and carbon donors
(DNC > 2), a large amount of NADH (NADH > 2)
and ATP (ATP > 1) (necessary for these anabolic pro-
cesses). This can be expressed by the following for-
mula: (DNC > 2)&(AT P > 1)&(NADH > 2).
Figure 1: A part of influence graph: representation of vari-
ables and multiplexes (focus on BM in Figure 5).
Each variable has a domain of variation made of a
small number of discrete levels and the dynamics of
the model is deduced from the regulatory network and
a set of kinetic parameters K
...
(simply “parameters”
in the sequel). Formally, the presence of an activator
or the absence of an inhibitor of a variable x is called
a resource, and the exhaustive list ω of its resources
defines the discrete level towards which x is temporar-
ily attracted, denoted K
x,ω
. If x has p possible re-
sources then it has 2
p
parameters. Lastly, when the
set of effective resources of a variable increases, this
cannot lead to decreasing its level (Snoussi, 1989):
ω ⊂ ω
0
⇒ K
x,ω
6 K
x,ω
0
, which can be used to reduce
the number of parametrisations to consider.
2.2 Selection Technics
TotemBioNet inherits from SMBioNet (Bernot
et al., 2004) and combines two filtering approaches to
identify the exhaustive set of models consistent with
biological knowledge: “genetically modified Hoare
logic” and temporal logic.
Hoare Logic. Biological experiments prove that
a set of traces must exist in the model. The ge-
netically modified Hoare logic (Bernot et al., 2019;
Folschette, 2019) produces the constraint on param-
eters that characterizes the models in which these
traces exist. We firstly transcript the observed ex-
perimental traces into a so-called Hoare triple (ob-
served pre-condition, path and post-condition) and
Hoare logic constructs the weakest pre-condition that
must be fulfilled. This constraint throws away param-
eter values which do not enable the observed traces.
Temporal Logic. Most of biological knowledge
do not translate directly into Hoare logic, such as epi-
genetic phenomena, homeostasis, (non-)reachability
of certain states, some events that always happen af-
ter others (but not necessarily right after), etc. To for-
malize this general knowledge, it is preferable to use
temporal logic. (Bernot et al., 2004; Goldfeder and
Kugler, 2019) and several other authors have chosen
CTL due to the efficiency of its model checking algo-
rithm, and its ability to capture the non-deterministic
choices of Thomas’ theory.
Mixing Both Approaches. TotemBioNet in-
puts are: an influence graph, any knowledge on the
parameter values, and properties on the dynamics of
the system expressed using CTL or Hoare logic. It
first computes the weakest pre-condition (wp) us-
ing genetically modified Hoare logic. Then, it ef-
ficiently enumerates all parametrisations satisfying
wp, and generates input files for the model checker
NuSMV (Cimatti et al., 2002). Each file contains the
conjunction of CTL formulas and an automaton that
encodes the model for the considered parametrisation.
TotemBioNet
1
, comes with many examples, in-
cluding those of the present paper. It allows one to
describe the influence graph with yEd graph editor
2
.
A typical session consists in building the influence
graph using yEd, in automatically generating the as-
sociated input file and then adding temporal proper-
ties and Hoare triples. TotemBioNet generates all
parametrisations, labelled with “OK” when the dy-
namic properties are verified, and if not with all the
properties which are not satisfied (see Fig. 2.).
1
https://gitlab.com/totembionet/totembionet
2
https://www.yworks.com/products/yed
BIOINFORMATICS 2021 - 12th International Conference on Bioinformatics Models, Methods and Algorithms
86

Behavioural
properties
{Pre} x+;y−;... {Post}
m1
m2
L
Interaction graph
G PC
PC
1
0
0 1
G
PC
1
0
0 1
G
PC
1
0
0 1
G
PC
1
0
0 1
G
Set of dynamics satisfying the specifications
Hoare Logic
Construction of
Model Checking
temporal logic formula (via NuSMV)
Selection of dynamics which satisfy the
temporal
formula
of parameterizations
Enumerator
R. Thomas’ modeling framework
Φ: a temporal
logic formula
G ≥ 1
¬(PC≥1 ∧¬(L≥1))
yes
M
i
no
simple
contraints
contraints wp
(M
i
|= Φ)
M
i
|= wp
Figure 2: TotemBioNet processing flow (Boyenval et al.,
2020).
3 TotemBioNet ENRICHMENT
FRAMEWORK
3.1 Modelling Context
We proceed by successive small enrichments of the
model under design. At each step, we start from a
regulatory network model together with a set of pa-
rameter settings (non empty but of reasonable size)
that is considered relevant w.r.t. biological knowledge
and expertise. For the new enrichment, it is essen-
tial to keep track of the fundamental properties of the
previously designed network models and to guarantee
that they are preserved (possibly reformulated or en-
riched). Our TotemBioNet enrichment framework
relies on a Modelling context, formed by:
IG: An Influence Graph that describes the influ-
ence of each variable and multiplex in the system,
BK: Some Biological Knowledge on the dynamics
of the system, collected from biologists and literature,
and given in natural language,
PM: A Property Matrix that formalizes, (CTL or
Hoare logic) the dynamics under different conditions.
These formalisations are a translation of BK,
PS: A set of Parameter Settings that govern sys-
tem’s dynamics. Some of them may be identified
from BK by the modeller, others are automatically se-
lected by TotemBioNet to satisfy PM formulas.
The couple (BK,PM) is the cornerstone for the re-
liability of the enrichment process: all along this pro-
cess, PM is updated according to BK, and formal ver-
ification methods are applied to PM.
3.2 Property Matrices
Each column of a Property Matrix (Fig. 3-top) is a
variable
3
whose behaviours are described in the col-
umn. Each row is an experimental condition and a
box in the matrix can be filled by a conjunction of
CTL formulas and Hoare triples that formalizes BK.
The experimental conditions are fixed via a set of en-
vironment variables which are sources of regulations
but never target of a regulation. Their constant values
can differ from one experimental condition to another.
Along our enrichment workflow, Property Matri-
ces (PM) have two different usages, validation or pre-
diction, as detailed below:
(1)Validation Property Matrices (Fig. 3-middle) are
PM where the biologist has certainty on the proper-
ties, via literature or wet experiments, and the mod-
eller is confident in the translation into logical formu-
las. When an enrichment is done, all the properties of
the enriched version of a Validation PM must be sat-
isfied. By analogy with software engineering, a Vali-
dation PM can be seen as a set of non regression tests,
(2)Prediction Property Matrices (Fig. 3-bottom) fo-
cus on fixed parameter settings. They are PM whose
properties have been automatically generated and val-
idated with TotemBioNet from simple property
patterns such as oscillations, homeostasis, attraction
basins and so on. There are as many prediction prop-
erty matrices as parameter settings: a subset of se-
lected prediction property matrices can then become
the starting point of a new enrichment process.
Fig. 3 shows a schematic vision of the usage of
PMs along an enrichment of a model, where some
variables have been added/removed. A Validation PM
may be sparse, as the set of established biological
properties is generally small. At the opposite, a Pre-
diction PM is entirely filled, but some of the discov-
ered properties can be of little relevance. This is why
the multidisciplinary dialogue is crucial and the in-
crements of BK are often suggested by the prediction
PMs, possibly asking for new biological experiments.
3.3 Enrichment Workflow
Initial Model. The TotemBioNet enrichment
workflow starts with an initial modelling context (top
of Fig. 4). It contains a Validation PM that will be en-
riched. The challenge is to design an enriched mod-
elling context that ensures non regression w.r.t. the
initial validation matrix.
Enrichment Design. The design of an enriched
modelling context lies on a dialogue between the biol-
ogist and the modeller (Fig. 4-middle). The biologist
3
Or possibly a few variables
TotemBioNet Enrichment Methodology: Application to the Qualitative Regulatory Network of the Cell Metabolism
87

Figure 3: Schematic vision of Property Matrices (PM).
Top: initial validation PM. Middle: enriched validation PM
where var-3 has been divided into var-3A and var-3B lead-
ing to the generation of purple properties prop-3A-1 and
prop-3B-1 from the initial property prop-3-1. Bottom:
prediction PM where yellow properties have been automat-
ically generated.
describes the Enriched Biological Knowledge (EBK)
and the modeller propagates it by enriching the Influ-
ence Graph (IG) or the Property Matrix (PM) (they
become EIG and EPM). A modification of IG may
induce a modification of the validation matrix, for ex-
ample by changing the level of an homeostasis. It may
also induce new parameters, thus TotemBioNet is
run to identify the unknown parameters that validate
EPM. If there is no such parameters, the modelling
is inconsistent and has to be corrected. If there are
too many parameter settings, the modelling is not pre-
cise enough to be a good candidate for predicting new
relevant biological properties (Occam’s razor). Thus
the process goes back to a dialogue for refining the
model. When a reasonably small number of parame-
ter settings validate EPM, the biologist takes the final
decision: return to improve the models and design a
better enrichment, or continue the workflow.
Test and Validation of an Enriched Modelling
Context. When a set of parameter settings has been
selected as the best compromise, tests and validations
begin (Fig. 4-bottom). An instanciated modelling
context is then built for each parameter setting. The
dynamic behaviours controlled by these settings en-
sure a non regression of the initial modelling, but they
may also exhibit some behavioural properties that dif-
fer from one model to another. Thus the matrix com-
pletion functionality of TotemBioNet is called on
each instantiated model. TotemBioNet establishes
a set of properties on each variable in each context
4
,
which are added to the matrix, as predictions. Lastly,
the biologist and the modeller select the most interest-
ing contexts according to phenotypes, possibly with
the help of new biological experiments. This set of
contexts is the starting point of another enrichment.
4 ILLUSTRATING EXAMPLE
This section illustrates the enrichment steps of Fig 4.
The cell metabolism can be viewed as an energy bal-
ance where all metabolic pathways (linked series of
chemical reactions) are regulated according to nu-
trient cell intake. They can be anabolic (produc-
ing biomass compounds) and catabolic (that degrade
large compounds to produce energy). The anabolic
and catabolic balance is fine-tuned in the cell.
Within this context, an abstract and qualita-
tive model of the metabolism regulation was devel-
oped (Khoodeeram et al., 2017) to understand how
activity level of biological pathways in combination
with nutrient can influence Warburg/Crabtree effect.
This effect appears in all cell types from yeast to hu-
man: It leads the cells to go from one catabolic pro-
cess (respiration) to another (fermentation). Since
2017, in order to focus on cancer in human cells in
correlation with the cell cycle, we made several en-
richments of the model to better reflect key metabolic
pathways (glycolysis, oxidative respiration, Krebs cy-
cle), nutrient (oxygen or glucose), key molecular
components (biomass) and regulators (key-cofactors).
The following subsections correspond respec-
tively to the top, middle and bottom parts of Fig. 4.
4.1 Initial Model and its Limits
The enrichment starts from the model whose IG is
given in Fig. 5: biomass was represented by a unique
variable BM that covered all cell growth components
(lipids, nucleic acids for genetic material and amino
acids for proteins). Fig. 1 is an extract from Fig. 5 that
focuses on BM: the multiplexes PPP, AAS and LS ab-
stract anabolic pathways respectively producing nu-
cleic acids, amino acids and lipids (Axelrod, 1967;
Berg et al., 2002; Stein and Stein, 1967). If one of
them is activated, biomass production (PBM) is on:
PBM is the inclusive disjunction of PPP and AAS and
4
Currently, only oscillations, homeostasis, and stable
states are implemented in prediction property matrices but
enriching this range of properties is not difficult.
BIOINFORMATICS 2021 - 12th International Conference on Bioinformatics Models, Methods and Algorithms
88
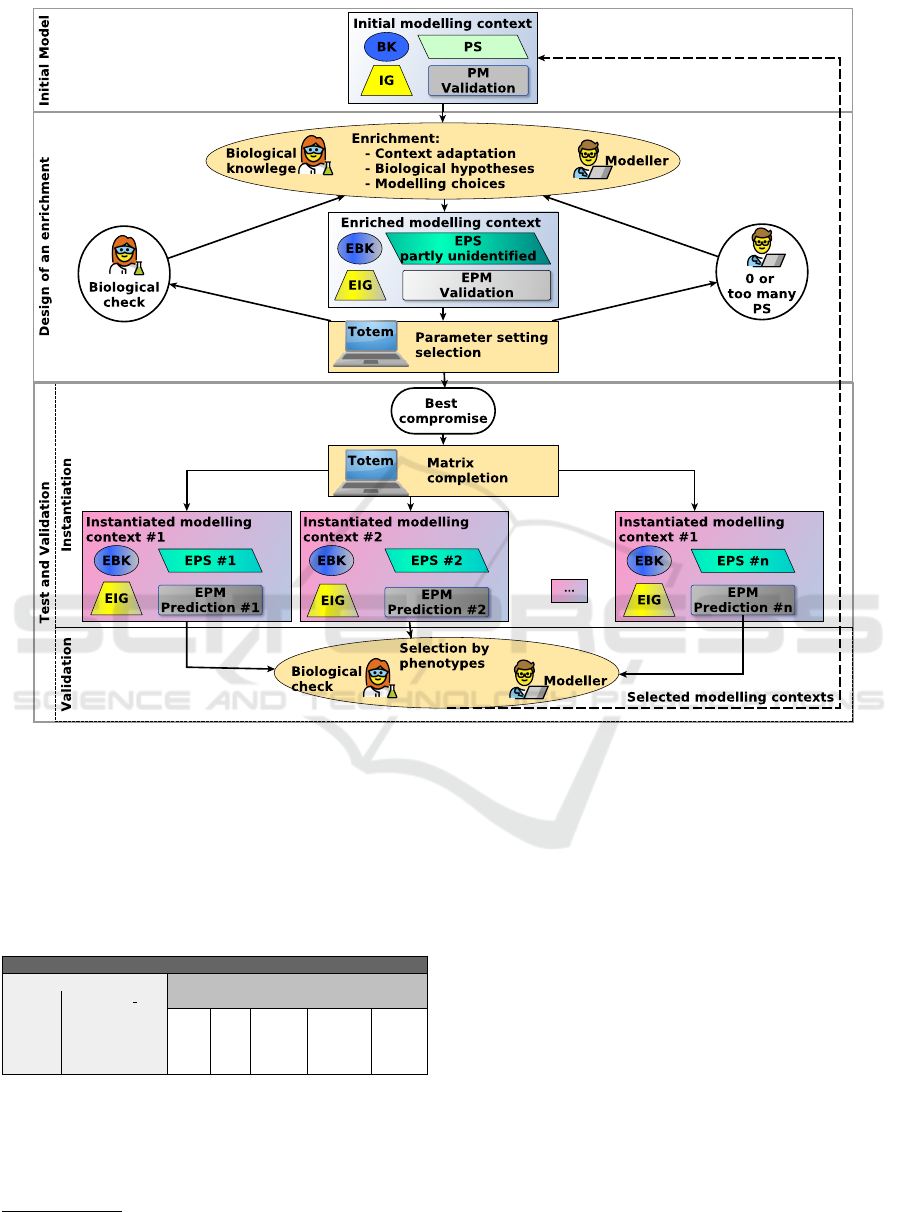
Figure 4: TotemBioNet Enrichment Framework. The quadruplet of a modelling context is represented by a box containing:
a yellow trapeze (IG), a blue bubble (BK), a grey rectangle (PM) and a green parallelogram (PS). The prefix E means an
Enrichment of one part of the quadruplet.
LS (AAS|PPP|LS). When PBM is a resource of BM,
biomass will become present in the cell
5
.
Table 1: Subpart of the Initial validation matrix. “0” means
tend toward 0, “Osc” means oscillations with arbitrary
boundaries and “!” stands for the negation.
Initial validation matrix
Environment Behaviour
OXYG GLC IN AA ATP BM FERM KREBS PHOX
0 0 0 0 0 0 0 0
0 1 0 Osc !0 0
1 1 1 Osc !0 0 Osc Osc
1 2 2 Osc !0 !0 Osc
Table 1 is a subpart of the validation matrix of this
initial model. The column BM, for example, requires
obvious properties, e.g. absence of biomass if the cell
does not receive any nutrient, and so on.
5
Because the applicable parameter is K
BM,PBM
= 1 in
the current parameter setting
BM participates in Box, which abstracts the β-
oxidation pathway, referring to the catabolic process
of lipids (Wakil, 1970). Unfortunately, this IG implies
that β-oxidation could be activated without any lipids
input. Indeed Box is satisfied when BM is activated
by PPP (nucleic acids) or AAS (amino acids) through
PBM: this behaviour proves that considering biomass
as a whole is a too coarse abstraction for an adapta-
tion to human cells. So, separating lipid biomass from
the other compounds is our next enrichment.
4.2 Enriched Modelling Context Design
EBK: Enriched Biological Knowledge. It lists all
biological information needed to separate lipids from
the rest of the biomass: lipids are produced by syn-
thesis and degraded by β-oxidation. Amino acids syn-
thesis produces proteins, and PPP (Pentose Phosphate
Pathway) produces nucleic acids for genetic material.
TotemBioNet Enrichment Methodology: Application to the Qualitative Regulatory Network of the Cell Metabolism
89
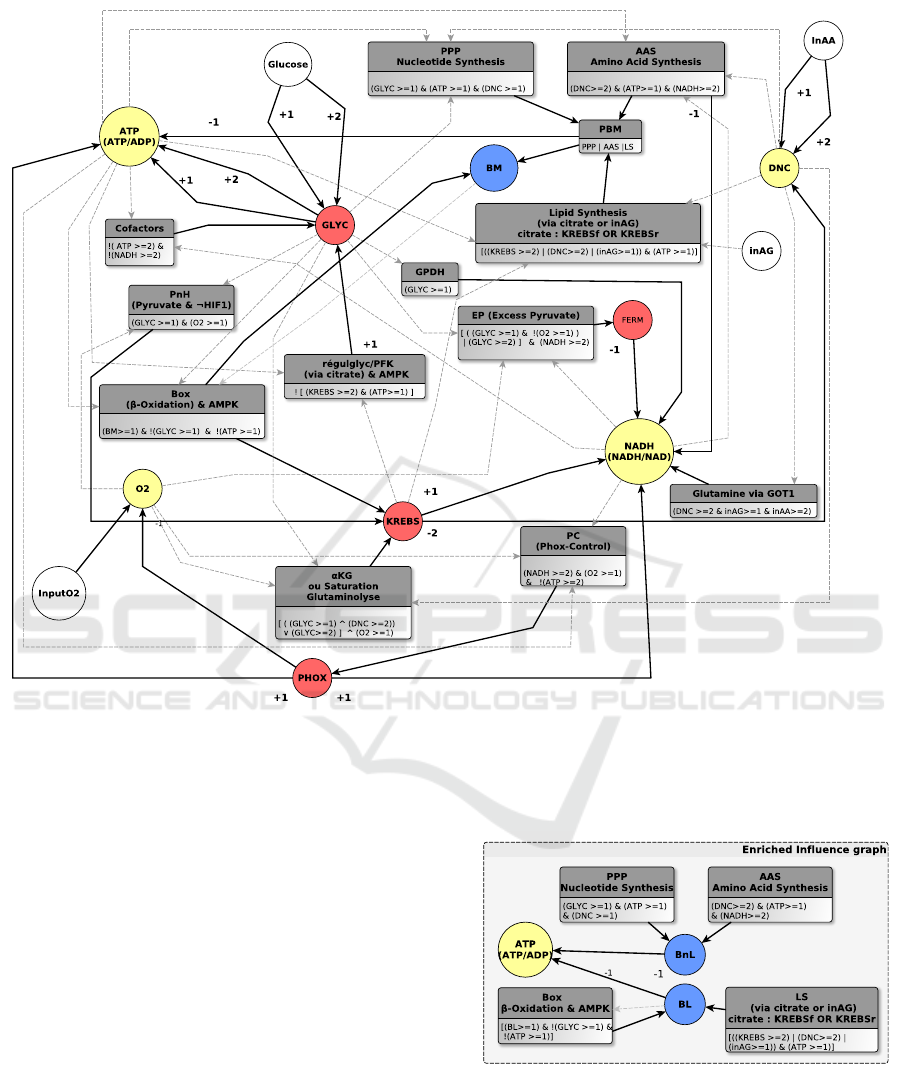
Figure 5: Influence graph (IG) of the initial modelling context: variables in red are the main metabolic processes (glycolysis,
Krebs cycle, oxydative phosphorylation), yellow ones are the main cofactors (ATP/ADP and NADH/NAD+ ratios, oxygen,
amino acid donors), biomass is in blue, environment variables are white (oxygen intake, glucose, nutrients...) and rectangle
multiplexes formalize their interactions. For more details see (Khoodeeram et al., 2017) who defined the first IG of the cell
metabolism regulation and its whole parameter setting.
Each kind of biomass production needs ATP for en-
ergy. All of this is added to initial BK to obtain EBK.
EIG: Enriched Influence Graph. Accordingly,
we modify Fig. 1 into Fig. 6. It focuses on what has
been modified: the biomass variable and its surround-
ing multiplexes. In the EIG (Fig. 6) BM has been split
into BL (lipids biomass) and BnL (non lipidic com-
pounds). BL participates in Box and is regulated by
LS. BnL resources are PPP and AAS. In the multiplex
Box the variable BM is replaced by the variable BL,
which solves the problem mentioned in Subsection
4.1. Lastly, both BL and BnL productions consume
ATP, thus regulate it negatively.
EPS: Enriched Parameter Settings. Our EIG
leads to new parameters that need to be identified. BL
and BnL have two resources each, so there are (2
2
+
2
2
= 8) new parameters (see Section 2.1). Moreover
ATP gains one resource (5 resources in the EIG in-
Figure 6: Enrichment of the influence graph of Fig. 1: BM
has been split into Bnl and BL.
stead of 4 in IG). It increases the number of ATP pa-
rameters to 2
5
= 32. Among them, 16 are ineffective
due to unsatisfiability of some resource combinations,
and the 6 identified parameters which do not involve
new resources are kept. Finally, it remains 18 parame-
BIOINFORMATICS 2021 - 12th International Conference on Bioinformatics Models, Methods and Algorithms
90

ters to identify for ATP. Thus, we have 26 parameters
to identify.
Thought experiments can be useful. For instance, to
identify the parameter K
BnL,∅
, we assume that both
pentose phosphate pathway (PPP) and amino acids
synthesis (AAS) are inactive (the set of Bnl resources
is ∅). We try to foresee toward which value would
BnL go if these conditions persist: neither genetic
material nor proteins are produced, thus K
BnL,∅
= 0.
Most of the time EBK is not sufficient to allow the
parameter identifications (many thought experiments
are inconclusive). In such cases TotemBioNet will
test all possible parameter settings. All in all 5 out of
the 26 parameters were not identified.
EPM: Validation Enriched Properties Matrix.
It summarizes the dynamical behaviours of variables,
according to EBK. The only modifications affect BM
(Table 2). It is replaced by both columns BnL and BL
and they are filled from EBK: For example without
any intake of glucose, no compounds are synthesized
so BnL and BL tend towards 0.
Table 2: Subpart of the validation EPM.
Enriched validation matrix
Environment Behaviour
OXYG GLC IN AA ATP BnL BL FERM KREBS PHOX
0 0 0 0 0 0 0 0 0
0 1 0 Osc !0 0
1 1 1 Osc !0 !0 0 Osc Osc
1 2 2 Osc !0 !0 !0 Osc
4.3 TotemBioNet Test and Validation
We test with TotemBioNet the enriched modelling
context created above, taking into consideration EBK,
EIG, EPS, EPM. The 5 unidentified parameters from
EPS give rise to only 15 instantiated modelling con-
texts (where each parameter has a unique value). We
obtain 15 prediction matrices such as Table 3 where
all empty boxes of validation-EPM are automatically
completed using TotemBioNet. They allow mod-
ellers and biologists to eliminate parameter settings
which exhibit non credible behaviours.
Table 3: Sub part of one of the 15 prediction EPMs.“Osc(0-
1)” means oscillations between level 0 and 1 of the variable.
Enriched Prediction matrix
Environment Behaviour
OXYG GLC IN AA ATP BnL BL FERM KREBS PHOX
0 0 0 0 0 0 0 0 0
0 1 0 Osc(0-2) Osc(0-1) 0 Osc(0-1) 0 0
1 1 1 Osc(0-2) Osc(0-1) Osc(0-1) 0 Osc(0-1) Osc(0-1)
1 2 2 Osc(0-2) Osc(0-1) Osc(0-1) Osc(0-1) Osc(0-2) Osc(0-1)
For our example, the 15 prediction EPMs exhibit
interestingly different behaviour for the variables BL
and BnL. Here, none of the models have aberrant pre-
dictions, so we keep this enriched modelling context
for the next enrichment step. Nevertheless, in gen-
eral some of these different behaviours can contradict
established biological knowledge or suggest new bio-
logical experiments.
5 CONCLUSION
We defined an incremental methodology for develop-
ing large formal models of biological regulatory net-
works. Starting from an initial formal model, the en-
richment is first described in natural language EBK,
then the formalisation of this information leads to
the EIG, EPS and validation EPM. Our process in-
volves, at each round of this methodology, a manage-
able number of parameter settings.
In practice, we observe that after a few enrichment
steps, the ab initio design of the enriched model, with-
out using the proposed methodology, would be im-
possible. The example outlined in this article (that
contains notably more than 100 parameters) would
lead to a number of parametrizations (1.45 × 10
60
)
that is so huge that TotemBioNet or any similar
platform would have taken more that 4.6 × 10
50
years
of computation to model check them, at the rate of
100 proofs per second! One of the key points of our
incremental methodology consists in limiting, at each
enrichment step, the number of parameter settings to
enumerate, preserving a maximum number of known
parameters from the previously validated model. EPS
and validation EPM in an enriched modelling context
allow TotemBioNet to drastically reduce the num-
ber of total parameters to identify, with a negligible
computation time: The parameters for which the re-
sources do not change (according to the new interpre-
tation) remain at the same value, and the new ones can
partly be identified by thought experiments.
Moreover, following our methodology, getting too
many parameter settings for an enriched modelling
context, simply means that the enrichment step is too
ambitious to be manageable. In such a case we re-
assess the informal enrichment EBK to address a less
ambitious enrichment. Conversely, when no coherent
parameter setting is obtained, this is generally due to
a construction error in the enriched modelling context
which has also to be reassessed. In our methodology,
this loop of reassessment is made possible owing to
the remarkably efficient TotemBioNet platform.
We currently use this methodology for the
metabolism regulation in cancer cells, when cells
acquire new functioning during the Epithelial-
mesenchymal transition. In practice, the informal BK
plays a crucial role for assisting interactions between
biologists and modellers, not only in the design of the
enrichment but also, in order to keep track of interpre-
tations made in previous contexts. Last but not least,
TotemBioNet Enrichment Methodology: Application to the Qualitative Regulatory Network of the Cell Metabolism
91

at each step the choice of a sensible subset of parame-
ter settings often suggest new biological experiments
that are particularly revealing.
ACKNOWLEDGEMENTS
We are fully indebted to Sophie Vasseur and Fabi-
enne Marchai-Guillaumond from INSERM CRCM,
for fruitful collaborations which helped us to design
the methodology. We warmly thank Jean-Yves Tros-
set and Rajeev Khoodeeram without whom the initial
model of metabolism regulation would not exist.
REFERENCES
Axelrod, B. (1967). Chapter 3 - glycolysis. In Greenberg,
D. M., editor, Metabolic Pathways (Third Edition),
pages 112–145. Academic Press.
Batt, G. et al. (2004). Model checking genetic regulatory
networks using GNA and CADP. In Graf, S. and
Mounier, L., editors, Model Checking Software, pages
158–163. Springer Berlin Heidelberg.
Berg, J. M., Tymoczko, J. L., and Stryer, L. (2002). The
biosynthesis of amino acids.
Bernot, G., Comet, J.-P., Khalis, Z., Richard, A., and Roux,
O. F. (2019). A genetically modified Hoare logic. The-
oretical Computer Science, 765:145–157.
Bernot, G., Comet, J.-P., Richard, A., and Guespin,
J. (2004). Application of formal methods to bi-
ological regulatory networks: extending Thomas’
asynchronous logical approach with temporal logic.
J.Theor.Biol, 229(3):339 – 347.
Bernot, G. and Tahi, F. (2009). Behaviour preservation of a
biological regulatory network when embedded into a
larger network. Fundam. Inform., 91(3-4):463–485.
Boyenval, D., Bernot, G., Collavizza, H., and Comet, J.-P.
(2020). What is a cell cycle checkpoint? the Totem-
BioNet answer. In CMSB, pages 362–372.
Cimatti, A. et al. (2002). NuSMV 2: An opensource tool
for symbolic model checking. In CAV’02, pages 359–
364, London, UK, UK. Springer-Verlag.
Folschette, M. (2019). The Hoare-fol Tool. Technical re-
port, CNRS, Centrale Lille, UMR 9189, France.
Gebser, M. et al. (2010). Repair and prediction (under in-
consistency) in large biological networks with answer
set programming. In 12th Intl Conf. on the Principles
of Knowledge Representation and Reasoning.
Glass, L. (1975). Classification of biological networks by
their qualitative dynamics. J.T.B, 54(1):85–107.
Goldfeder, J. and Kugler, H. (2019). BRE:IN - A Back-
end for Reasoning About Interaction Networks with
Temporal Logic. In CMSB, LNCS, pages 289–295.
Springer International Publishing.
Gonzalez, A. G., Naldi, A., Sanchez, L., Thieffry, D., and
Chaouiya, C. (2006). GINsim: a software suite for
the qualitative modelling, simulation and analysis of
regulatory networks. Biosystems, 84(2):91–100.
Gouveia, F., Lynce, I., and Monteiro, P. T. (2018).
Model Revision of Logical Regulatory Networks Us-
ing Logic-Based Tools. In Technical Communications
of the 34th ICLP 2018, pages 23:1–23:10.
Khalis, Z., Comet, J.-P., Richard, A., and Bernot, G. (2009).
The SMBioNet method for discovering models of
gene regulatory networks. G.G.G, 3:15–22.
Khoodeeram, R., Bernot, G., and Trosset, J.-Y. (2017). An
Ockham razor model of energy metabolism. advances
in Systems and Synthetic Biology, pages 81–101.
Mabrouki, M., Aiguier, M., Comet, J.-P., Le Gall, P., and
Richard, A. (2011). Embedding of biological regula-
tory networks and property preservation. Mathematics
in Computer Science, 5(3):263–288.
Naldi, A. et al. (2018). The CoLoMoTo interactive
notebook: accessible and reproducible computational
analyses for qualitative biological networks. Frontiers
in physiology, 9:680.
Paulev
´
e, L. (2017). Pint: A static analyzer for transient dy-
namics of qualitative networks with ipython interface.
In CMSB, pages 309–316. Springer.
Siebert, H. (2009). Deriving behavior of boolean bioregu-
latory networks from subnetwork dynamics. Mathe-
matics in Computer Science, 2(3):421–442.
Snoussi, E. H. (1989). Qualitative dynamics of piecewise-
linear differential equations: a discrete mapping ap-
proach. Dynamics and stability of Systems, 4(3-
4):565–583.
Stein, O. and Stein, Y. (1967). Lipid synthesis, intracel-
lular transport, storage, and secretion. J. Cell. Biol.,
33(2):319–339.
Thomas, R. (1973). Boolean formalization of genetic con-
trol circuits. J.Theor.Biol, 42(3):563–585.
Wakil, S. J. (1970). Chapter I - fatty acid metabolism. In
Wakil, S. J., editor, Lipid Metabolism, pages 1–48.
Academic Press.
BIOINFORMATICS 2021 - 12th International Conference on Bioinformatics Models, Methods and Algorithms
92
