
Approaching the Semantic Segmentation in Medical Problems: A
Solution for Pneumothorax Detection
C
˘
alin T
,
imbus
,
, Vlad Miclea and Camelia Lemnaru
Technical University of Cluj-Napoca, Cluj-Napoca, Romania
Keywords:
Semantic Segmentation, Pneumothorax Detection, Pipeline.
Abstract:
We present a method for detecting and delineating pneumothorax from X-Ray medical images by using a three-
step processing pipeline: a deep learning classification module, responsible for detecting the possible existence
of a collapsed lung within an image, followed by a segmentation model applied on the positive samples (as
detected by the classification module). The last module attempts to eliminate possible artefacts based on
their size. We demonstrate how the pipeline employed significantly improves the results, by increasing the
mean-Dice coefficient metric by 0.13, in comparison with the performance of a single segmentation module.
In addition to this, we demonstrate that using together specific state-of-the-art techniques leads to improved
results, without employing techniques such as dataset enrichment from external sources, semi-supervised
learning or pretraining on much larger medical datasets.
1 INTRODUCTION
Convolutional neural networks have recently become
ubiquitous in large-scale image recognition tasks, ow-
ing to the exponential advancement in computing
power. In addition to the considerable gain in hard-
ware performance, widely available comprehensive
datasets have contributed towards state-of-the-art im-
provements (Timbus et al., 2018). Having pushed the
boundaries in several computer vision tasks, such as
object classification and detection, they have likewise
been proven to excel at semantic segmentation.
The medical field has also benefited to a great
extent from the aforementioned technical advance-
ments: while the medical staff will probably never be
replaced by automated deep learning solutions, the ro-
bustness of many such solutions is evident and it has
become apparent that they could be employed to pro-
vide support to the medical industry.
In this paper we propose a pipeline for detecting
and segmenting pneumothorax from medical images.
In lieu of using exclusively a segmentation module,
we employ a deep-learning pipeline, composed of
two convolutional neural networks, one responsible
for detecting the pneumothorax while the second one
has the purpose of delineating the zones with col-
lapsed lung. We demonstrate the effectiveness of our
approach by contrasting the results obtained by the
pipeline versus the simple segmentation module.
At the same time, we prove that a combination
of several state-of-the-art techniques, such as SWA
(Stochastic weighted averaging) and cosine-annealing
learning rate schedules, can lead to a considerable im-
provement of the final score, in absence of dataset ex-
pansion or heavy ensemble modeling, the latter being
widely used recently for achieving state-of-the-art re-
sults. Our solution achieves top 8%, more precisely
the 130th position out of 1475 teams in the SIIM-
ACR Pneumothorax Segmentation (Society for Imag-
ing Informatics in Medicine (SIIM), 2019) hosted by
the Kaggle platform.
2 RELATED WORK
2.1 Semantic Segmentation
As far as the traffic scenario is concerned, comprehen-
sive datasets such as Cityscapes (Cordts et al., 2016),
Kitti (Geiger et al., 2013) or Mapillary (Neuhold
et al., 2018) have been developed. However, these
benchmarks are pertained solely to the automotive
industry. To the best of our knowledge, apart from the
CheXpert (Irvin et al., 2019) dataset from the Stan-
ford University, which is related to X-ray image clas-
sification problems, there is no well-established and
Timbus, C., Miclea, V. and Lemnaru, C.
Approaching the Semantic Segmentation in Medical Problems: A Solution for Pneumothorax Detection.
DOI: 10.5220/0010185402650272
In Proceedings of the 16th International Joint Conference on Computer Vision, Imaging and Computer Graphics Theory and Applications (VISIGRAPP 2021) - Volume 5: VISAPP, pages
265-272
ISBN: 978-989-758-488-6
Copyright
c
2021 by SCITEPRESS – Science and Technology Publications, Lda. All rights reserved
265

ubiquitous benchmark for image segmentation in the
medical field.
On the solution side, the majority of the archi-
tectures employ an encoder-decoder strategy. As
new classification architectures emerge, the encoder
can be replaced with a more powerful architecture,
thereby improving the feature extraction process.
2.2 Medical Image Segmentation
Medical image segmentation poses several additional
challenges in contrast to the traffic scene segmenta-
tion. While the traffic scenes are comprised of nu-
merous object categories which may constitute a large
part of an image (pedestrians, cars, buildings, etc.),
the imbalance problem is more salient in the medi-
cal image processing. This phenomenon happens on
account of two different factors. The first one is the
sample imbalance factor, which refers to the number
of positive samples against the number of negative
samples. This type of imbalance is also widely en-
countered in more typical classification problems. In
medical problems, the underrepresented class is often
the positive one. Nevertheless, the second imbalance
factor, which poses a greater challenge than the previ-
ous, is pertained to the area of the region of interest; in
essence, under most circumstances, the zone of inter-
est one attempts to detect is of negligible dimension,
be it polyp, skin lesion or pneumothorax. Therefore,
one can refer to such phenomena as an exponential
imbalance situation.
U-Net (Ronneberger et al., 2015) is a well-
established image segmentation architecture that has
proven to perform remarkably in the medical segmen-
tation. U-Net++ adds dense skip connections and re-
designed skip pathways, thus ensuring that all the pre-
viously accumulated information is gathered in the
feature map concatenation step, at the same time im-
proving the gradient flow. Moreover, the deep super-
vision model implementation enabled the selection of
selection of segmentation maps from a specific branch
(fast) or the average of the full output of the branches
(accurate), thus enabling switching between two dif-
ferent approaches according to the needs.
Last but not least, DeepLabV3+ (Chen et al.,
2018) which outperformed the previous state-of-the-
art PSPNet (Zhao et al., 2016) on Cityscapes (Cordts
et al., 2016) used the concept of atrous convolution in
conjunction with atrous spatial pyramid pooling.
3 PROPOSED APPROACH
Figure 1 describes the pipeline operations, together
with the intermediary output results. We initially feed
the pipeline with a 3-channel 1024x1024 input im-
age. Should the X-Ray image be deemed as contain-
ing pneumothorax (according to a specific threshold),
it is passed along the pipeline for further processing;
otherwise it is disregarded and marked accordingly.
In case of the forward pass (image is considered as
encompassing collapsed lung regions), the segmenta-
tion module receives the input image and delineates
the zones with pneumothorax. At this stage the image
is downscaled with a factor of two. The motivation for
this is that we noticed comparable results when train-
ing on 1024x1024 and 512x512. The semantically
segmented result is sent to the Small ROIs elimina-
tor module, which is responsible for excluding the re-
gions which are below the elimination threshold. This
process takes place at an upscaled resolution with a
factor of two, thus at the initial image resolution. This
represents the final step in our pipeline. The follow-
ing paragraphs detail the particularities of the entire
flow.
3.1 Image Classification Model
3.1.1 Description of the Pneumothorax Dataset
The dataset used to train both the classification
and segmentation models is provided by SIIM-ACR,
and exposed by Kaggle (Society for Imaging Infor-
matics in Medicine (SIIM), 2019) to the competi-
tors. The dataset is comprised of approximately
12.000 X-Ray images belonging to both healthy (non-
pneumothorax) and ill patients (at least a zone with
pneumothorax). The input resolution for all the im-
ages (and masks included) is 1024x1024.
The dataset for the second stage of the competition
contains 9378 X-Ray for the non-pneumothorax cat-
egory, whilst the number for patients suffering from
pneumothorax is 2883, yielding a class-imbalance
factor of 3.25. During the dataset analysis phase, we
observed that several patients exhibit pneumothorax
which accounts for less than 1% of the overall image.
Such a percentage is to be expected considering the
medical nature of the pneumothorax. In addition to
this, the dataset provided consists of only 12.000 sam-
ples. Therefore, the two-level imbalance increases the
complexity of the problem to a great extent, in partic-
ular due to the second type of imbalance, which is the
pixel per class one.
In light of the former observations, we argue that
an initial classification step is needed in order to re-
VISAPP 2021 - 16th International Conference on Computer Vision Theory and Applications
266

Figure 1: Workflow of the proposed method.
duce the number of false positives, improving the
overall performance – as shown in the results section.
We use the initial dataset both for classification and
segmentation purposes. The motivation for our de-
cision is the reliability of the ground truth labels, as
well as the option to being able to preserve the same
distribution for the test set.
3.1.2 Image Classification Architecture
The architecture used for image classification is
Xception (Chollet, 2016), with the weights pre-
trained on ImageNet (Deng et al., 2009). In spite of
the different nature of the dataset, we have observed
both faster convergence and better final results by us-
ing pre-trained networks on the medical pneumotho-
rax dataset. Our observation upholds the already es-
tablished good practice of using pre-trained weights
from a comprehensive dataset such as ImageNet.
We experimented both with NASNet(Large)
(Zoph et al., 2017) and InceptionResNetV2 (Szegedy
et al., 2016) prior to opting for Xception (Chollet,
2016). Lowering the batch size with a factor of 2 did
not result only in twice training time, but also in a
decrease of the overall performance. We suspect that
this phenomenon is generated by the batch normaliza-
tion layers (present in all the above-mentioned archi-
tectures), as the batch normalization tends to yield an
unrepresentative mean and variance when used with
very small batch sizes (Wu and He, 2018). The depth-
wise separable convolution operation, which greatly
reduces the number of parameters to a ninth in con-
trast to a standard K*K convolution and present in
Xception (Chollet, 2016) allowed us to use a greater
batch size.Therefore, the Xception network was the
final choice for our classification module.
3.2 Image Segmentation Model
3.2.1 Description of the Segmentation Dataset
The dataset for segmentation was created exclusively
from the dataset available within the competition.
While initially we trained our model exclusively on
the pneumothorax images, given the rationale of the
classification module, we observed an increase in the
final score when we trained the segmentation module
on both pneumothorax and non-pneumothorax im-
ages.
An explanation for this phenomenon is that, false
negatives from the classification module may pass
through the pipeline and on account of the biased na-
ture of the segmentation module, which was trained
only on pneumothorax images, several zones for a
healthy patient are marked as containing pneumotho-
rax. Moreover, it is reasonable to assume that the test
set contains more healthy samples than pneumotho-
rax samples. While the former assumption could be
easily tested, the latter cannot be verified due to the
undisclosed ground truth on the test set.
Therefore, we randomly chose non-pneumothorax
images from the training set and created the segmen-
tation dataset, using the fine pneumothorax annota-
tions provided in the dataset.
We split the dataset into a 80%-20% manner for
the training and validation set respectively, similar to
the classification one.
3.2.2 Image Segmentation Architecture
For the segmentation network, we have experimented
with several, well-established architectures, such as
U-Net(Ronneberger et al., 2015) or PSPNet(Zhao
et al., 2016).
We have preliminarily investigated both UNet
(Ronneberger et al., 2015) and PSPNet(Zhao et al.,
2016) with several backbones, such as the state-of-
the-art EfficientNet (Tan and Le, 2019). The best re-
sults on the validation set, which also later translated
to better results on the private set, was a combina-
tion of Feature Pyramid Networks (FPN) (Lin et al.,
2016) and InceptionResNetV2 (Szegedy et al., 2016).
This reinforces the idea that the training and test set
belong to the same distribution. At the same time, In-
ceptionResNetV2 yielded superior results to SERes-
Net (34,50,101,152) (Hu et al., 2017) or any variant
of ResNetXt (Xie et al., 2016) that we have tried in
our experiments (34,50,101,152). Therefore, the final
feature extractor for the segmentation architecture is
InceptionResNetV2.
Approaching the Semantic Segmentation in Medical Problems: A Solution for Pneumothorax Detection
267

The loss function that we used during both phases
of the training is essentially the sum of focal binary
cross-entropy and Dice-coefficient loss.
Although the focal-loss has been initially used in
the context of background-foreground imbalance (Lin
et al., 2017), the loss can be adapted to other imbal-
ance problems, such as both classification and seg-
mentation.
The optimizing metric in this case was the inter-
section over union (IoU), at the same time observing
the behaviour of F1 and F2 metrics on both training
and validation sets. Both F1 and F2 are particular
cases of the more general F-Beta metric; for the F1
score, the beta parameter is set to 1, yielding the har-
monic mean of precision and recall (i.e. the same
weight for precision and recall). The F2 metric em-
phasizes the recall metric, assigning twice the im-
portance to the recall as compared to the precision.
Therefore, the F2 metric was used in order to also ver-
ify the capacity of the model to detect pneumothorax
regions.
3.3 Small ROIs Eliminator
Throughout the competition, a proven heuristic to per-
form well in practice is to eliminate the small regions
of interest. In this particular case of image segmen-
tation, a small region of interest is defined as a con-
nected component whose surface in pixels is less than
a specific threshold.
De facto, for each and every medical segmentation
problem, when the region of segmentation is insignif-
icant, the same heuristic can be put into practice. Ad-
mittedly, the exact nature of the problem needs to be
taken into consideration: it may be the case that very
small areas represent important regions of interest.
Nevertheless, the pneumothorax detection prob-
lem can be construed as belonging to the former cat-
egory. A very small delineated pneumothorax region
may very well constitute a false positive, hence the
suitability of its elimination.
4 EMPIRICAL EVALUATIONS
This section is split into three subsections, provid-
ing details with regard to each module: the classifi-
cation module (1), the segmentation module (2) and
the small regions of interest removal (3) one, as seen
in Figure 1. For each module we present the motiva-
tion behind each choice, describing the experiments
and the results obtained.
4.1 Training Considerations and
Hyper-parameter Tuning
4.1.1 Classification Model
As far as the classification module is concerned, we
ran an experiment to check whether the augmenta-
tion or enrichment yield final better results. In other
words, given exactly the same training hyperparame-
ters, we contrast the models and verify their perfor-
mance on the local validation set.
For the augmentation (1) scenario, we chose the
following augmentations:
• CLAHE (Contrast Limited Adaptive Histogram
Equalization)
• Optical distortion
• Zoom-In (0.05-0.10) random factor with uniform
distribution
• Zoom-Out (0.05-0.10) random factor with uni-
form distribution
Each augmentation is applied with a probability
of 50%. Prior to implementing our pipeline, we ex-
perimented with CenterCrop augmentation. However,
due to the fact that several X-Rays are shifted, the
CenterCrop augmentation could result in a loss of in-
formation thereby introducing false ground truth el-
ements. The reason for such loss of information re-
sides in the medical nature of pneumothorax, the lat-
ter manifesting in many situations at the extremities
of the lungs.
For the enrichment/oversampling (2) scenario, we
chose the same image preprocessing techniques. We
perfectly balanced the dataset, by oversampling the
positive, minority class. We applied the enrichment
in the following manner:
sdi f = np images − pn images (1)
enrich type support = sdi f /nb o f aug (2)
In the first equation (1), sdif stands for the dif-
ference in support, which in this specific case is ob-
tained by subtracting the number of pneumothorax
images from the number of non-pneumothorax im-
ages, since the latter has higher support. The en-
rich type support in (2), which in essence translates
to the number of images of that specific image prepro-
cessing with whom the dataset is enriched, is there-
fore the division between the sdif and the number
of augmentations, namely nb of aug. For example,
if the dataset consisted of 1000 pneumothorax im-
ages and 5000 non-pneumothorax ones, we could use
4 image processing techniques(nb of augmentations)
VISAPP 2021 - 16th International Conference on Computer Vision Theory and Applications
268
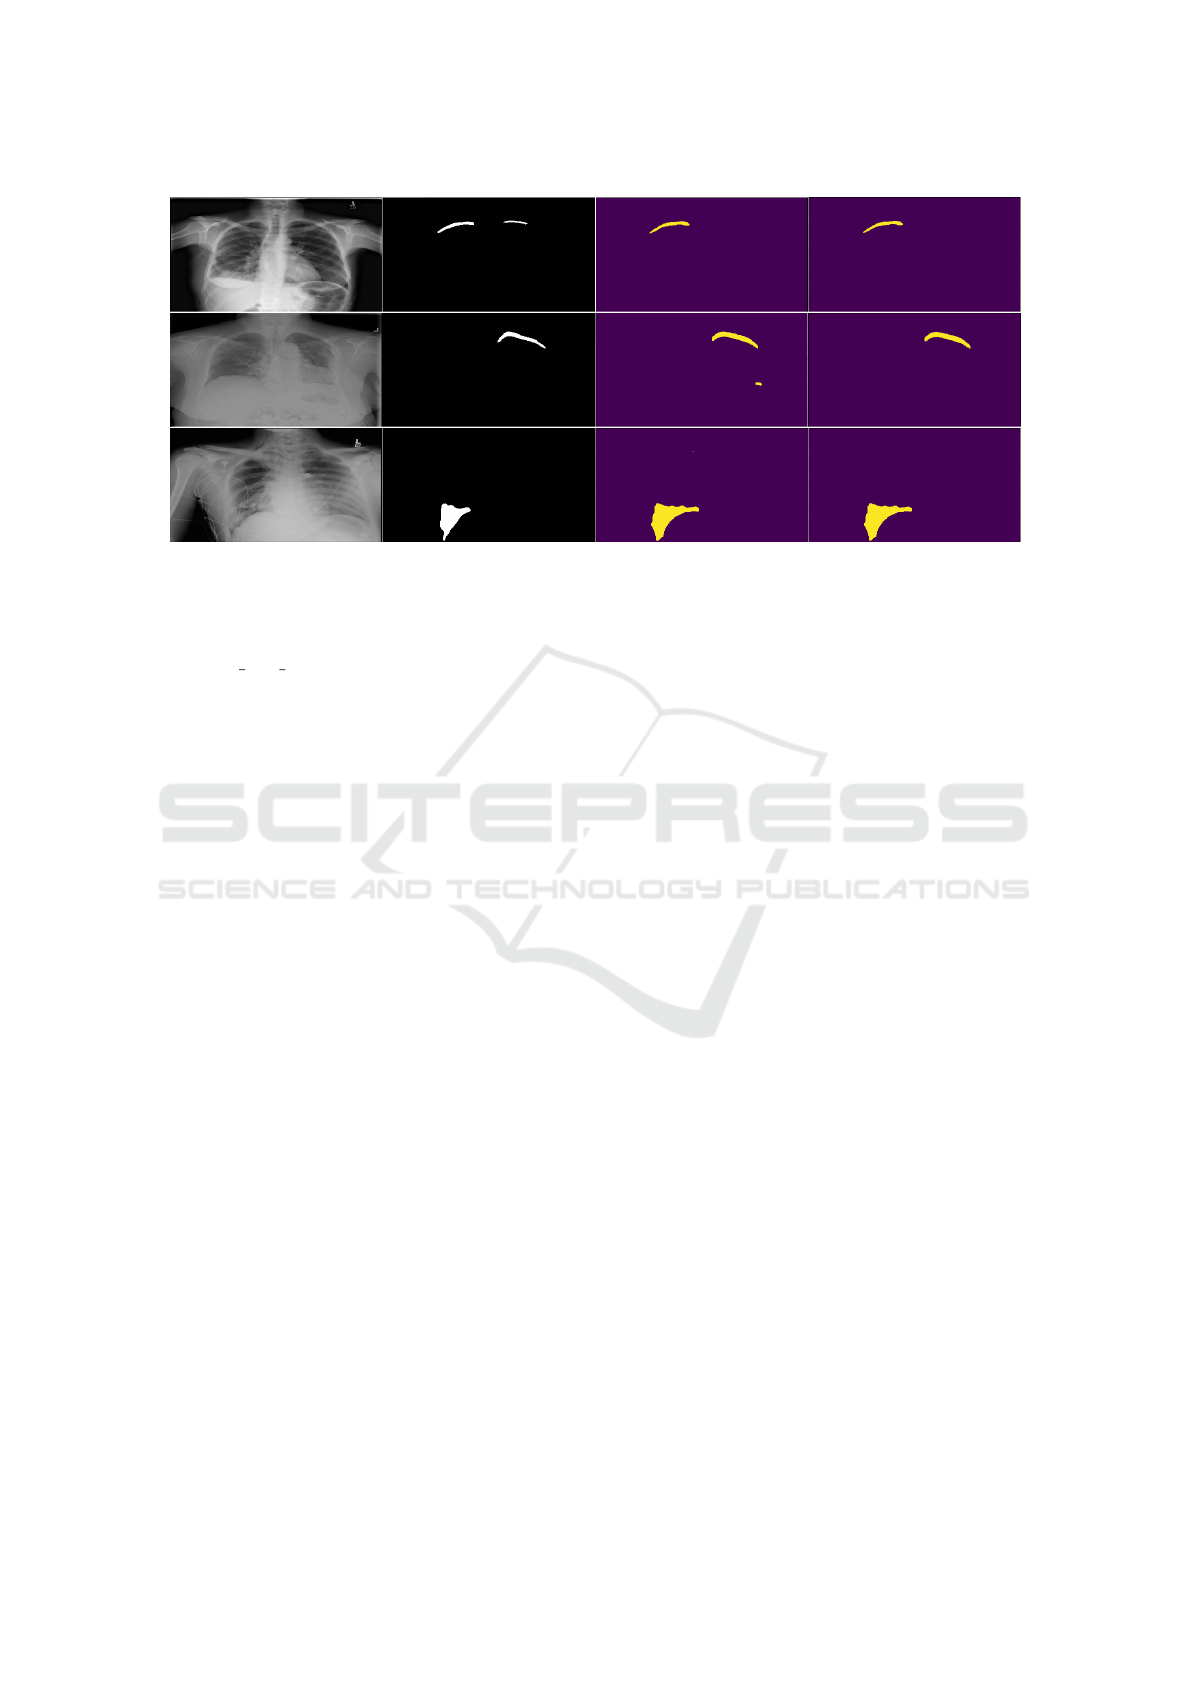
Figure 2: Example predictions on the validation set. The first column is the input image and the second represents the ground
truth. The third and fourth columns represent results – the third without the small component removal, and the fourth (final)
with that component.
for balancing, and the number of samples per enrich-
mentenrich type support is (5000 − 1000)/4 = 1000,
where sdif is 5000 − 1000 = 4000. Therefore, a bal-
anced dataset is obtained in such a manner.
In this particular scenario (enrichment), the train-
ing proceeds normally without employing any types
of augmentation due to the prior oversampling pro-
cess. At the same time the enrichment-model con-
verges faster than the augmentation-model, attaining
the peak value on the validation set on the 10
th
epoch
as compared to 17
th
epoch in case of the augmenta-
tion model.
However, the augmentation model achieved an
MCC of 0.774 on the ground truth validation set. The
former value represents an increase of 0.04 on the val-
idation set and 0.02 on the private score(mean-Dice
coefficient) as compared to the enrichment model.
The increase on both validation and test sets con-
firm that the training-validation-test sets belong to
the same distribution. In the paragraphs below, we
present two possible reasons for this phenomenon.
As the numbers of epochs increases towards a
large number (i.e. tends towards infinity from a limit
viewpoint), the probability of a model for having seen
a particular image with a particular augmentation in-
creases. Mathematically, this is incontrovertible, as
the number of epochs increases, should an augmenta-
tion be applied with a likelihood of 30%, the probabil-
ity of the model to have seen a specific image from the
dataset later in the training phase rather than earlier.
This phenomenon is also similar to an extent with
the exploration-exploitation reinforcement epsilon-
greedy balancing strategy: while epsilon is very
small, as the time passes, the agent performs actions it
could have taken from the beginning phase if epsilon
was given a high value. Exactly like in the augmenta-
tion training versus enrichment training, the augmen-
tation training sees particular examples later in the
training phase rather than early.
Therefore, given the test dataset distribution in
this particular case, we noticed that aggressive aug-
mentation (setting a 50% probability for each possi-
ble augmentation) as presented above even slightly
outperformed the balanced dataset enrichment model
on the test set. We therefore decided to opt for the
augmentation-model.
In the paragraphs below we present the hyperpa-
rameter configurations that were employed for both
training sessions: augmentation and enrichment.
We trained both models for 25 epochs. We no-
ticed an overfitting phenomenon after training for
more than 25, hence the justification for the number of
epochs hyperparameter. The duration of each epoch is
approximately 50 minutes on a GTX 1080Ti. We split
the initial dataset into an 80%-20% ratio, 80% being
reserved for training and the remaining 20% for vali-
dation. We use a fixed batch size of 4. As the dataset
is inherently imbalanced, we applied a stratified split
in order to ensure the support ratios on the training
and validation set are the same.
We started by freezing the base convolutional
model and pre-training only on last newly-added layer
of the network. We employ this strategy for 2 epochs
with Adam (Kingma and Ba, 2014) as an optimizer
with a learning rate of 2x10
−2
. In conjunction with
the Adam (Kingma and Ba, 2014) optimizer, we use
binary cross-entropy as a loss function. We also use a
learning rate on plateau reducer, with a patience of
3 and a reduction factor of 2x10
−1
. This means a
reduction of the learning rate by the factor above if,
Approaching the Semantic Segmentation in Medical Problems: A Solution for Pneumothorax Detection
269
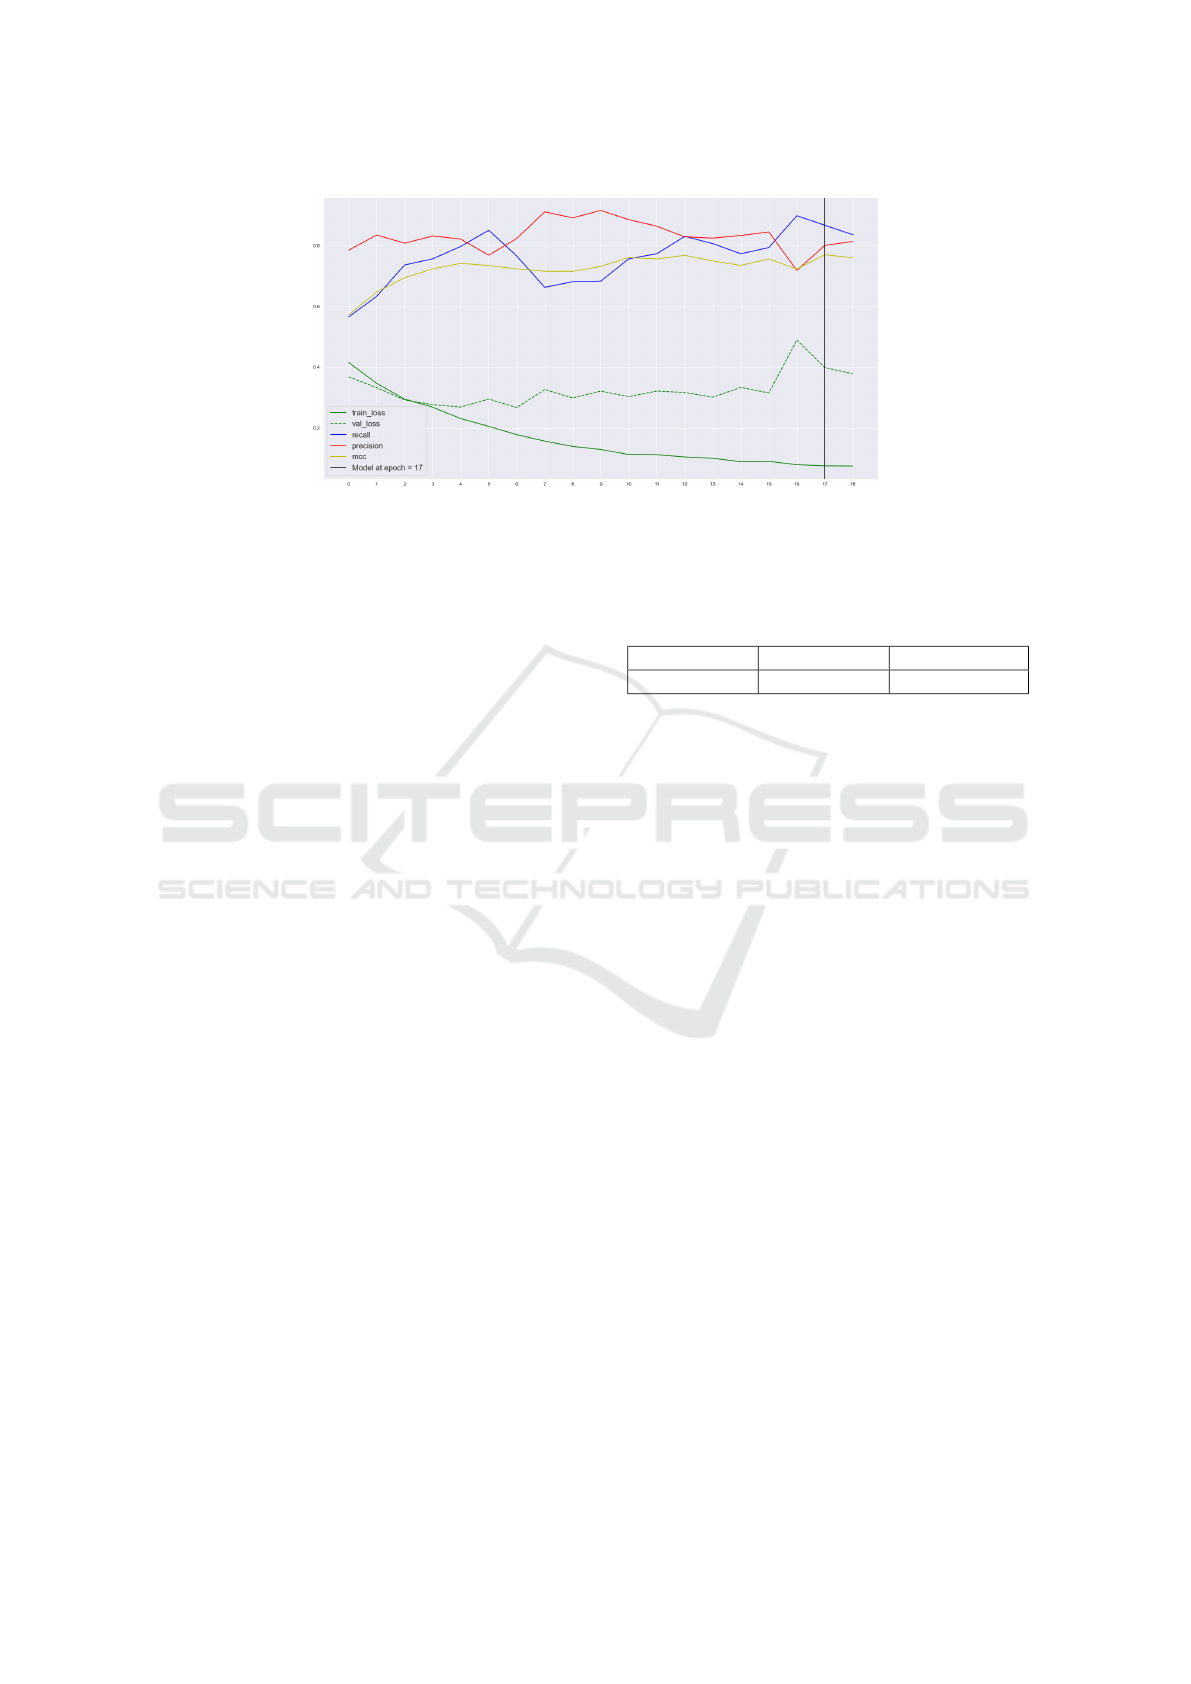
Figure 3: The metrics during the training with the classification model (with strong augmentation). The yellow line represents
the optimizing metric, which is the Matthews Correlation Coefficient. The green lines represent the training and validation
(dotted) losses. The black vertical line represents the model obtained when the MCC value attained its highest value. Notice
how the MCC reaches the peak at a different time than the moment when the validation loss attains its lowest peak.
for three consecutive epochs, the optimizing metric
(MCC) does not improve on the validation set.
For the next 23 epochs we unfreeze the entire
model and train it with the same optimizer, but with a
learning rate of 2x10
−4
. We reduce the learning rate
in order to avoid information loss for the pretrained
weights. The best results are obtained on the 17
th
epoch. We choose Matthews Correlation Coefficient
(MCC) as our optimizing metric, taking into consid-
eration that accuracy does not reflect the robustness
of a classification model in an imbalanced scenario.
Although the dataset is balanced in case of the en-
richment model, for consistency reasons we maintain
the MCC as the optimizing metric. The metrics set on
validation reported at the 17
th
epoch with the aggres-
sive augmentation model is:
• MCC: 0.7702
• Precision: 0.8010
• Recall: 0.8674
• Accuracy: 93.60%
4.1.2 Segmentation Model
As far as the training is concerned, we employed Co-
sine Annealing Learning Rate Schedule (Loshchilov
and Hutter, 2016) in conjunction with Stochastic
Weight Averaging (SWA) (Izmailov et al., 2018). We
employ a different approach for each procedure, as
explained in the paragraphs below.
We initially use the optimizer Adam with a learn-
ing rate of 1 × 10
−3
. For the first two epochs, we
freeze the first half of the trainable layers. We employ
this freezing strategy as the training set is different
from ImageNet (Deng et al., 2009) and also signifi-
cantly smaller in size. Starting from the 3
rd
epoch, we
decrease the learning rate to 1 ×10
−4
.
Table 1: Classic SWA versus Our Approach (SWA between
epochs).
Final results Typical SWA Our Approach
Private Score 0.8322 0.8347
We employed the classical idea of weight-
averaging from SWA, but we experimented with a dif-
ferent approach: rather than updating the weights at
the end of each cycle, we performed SWA between
several epochs within a cycle where we empirically
observed that the IoU metric reaches its highest peaks
(on validation data).
As such, we trained for 37 epochs and carefully
supervised the evolution of the IoU metric. We ob-
served that between the 13
th
and the 16
th
epochs the
IoU metric reached the maximum values during the
training phase, attaining values between 0.638 and
0.647. Thus, the weights of the final model are ob-
tained by applying SWA between epochs 13 and 16.
Much to our surprise, the results in Table 1 sug-
gest that by carefully choosing epochs between which
SWA is employed, one can achieve good results and
even surpass the results obtained with the typical
SWA. Another benefit for this situation would be that
a single learning cycle could be used (regardless of
the scheduler), thereby leading to considerably less
training time.
We report the following average values of the met-
rics considered, between epochs 13
th
and 16
th
, inclu-
sive:
• IoU: 0.6553
• F1-Score: 0.6773
• F2-Score: 0.6811
VISAPP 2021 - 16th International Conference on Computer Vision Theory and Applications
270
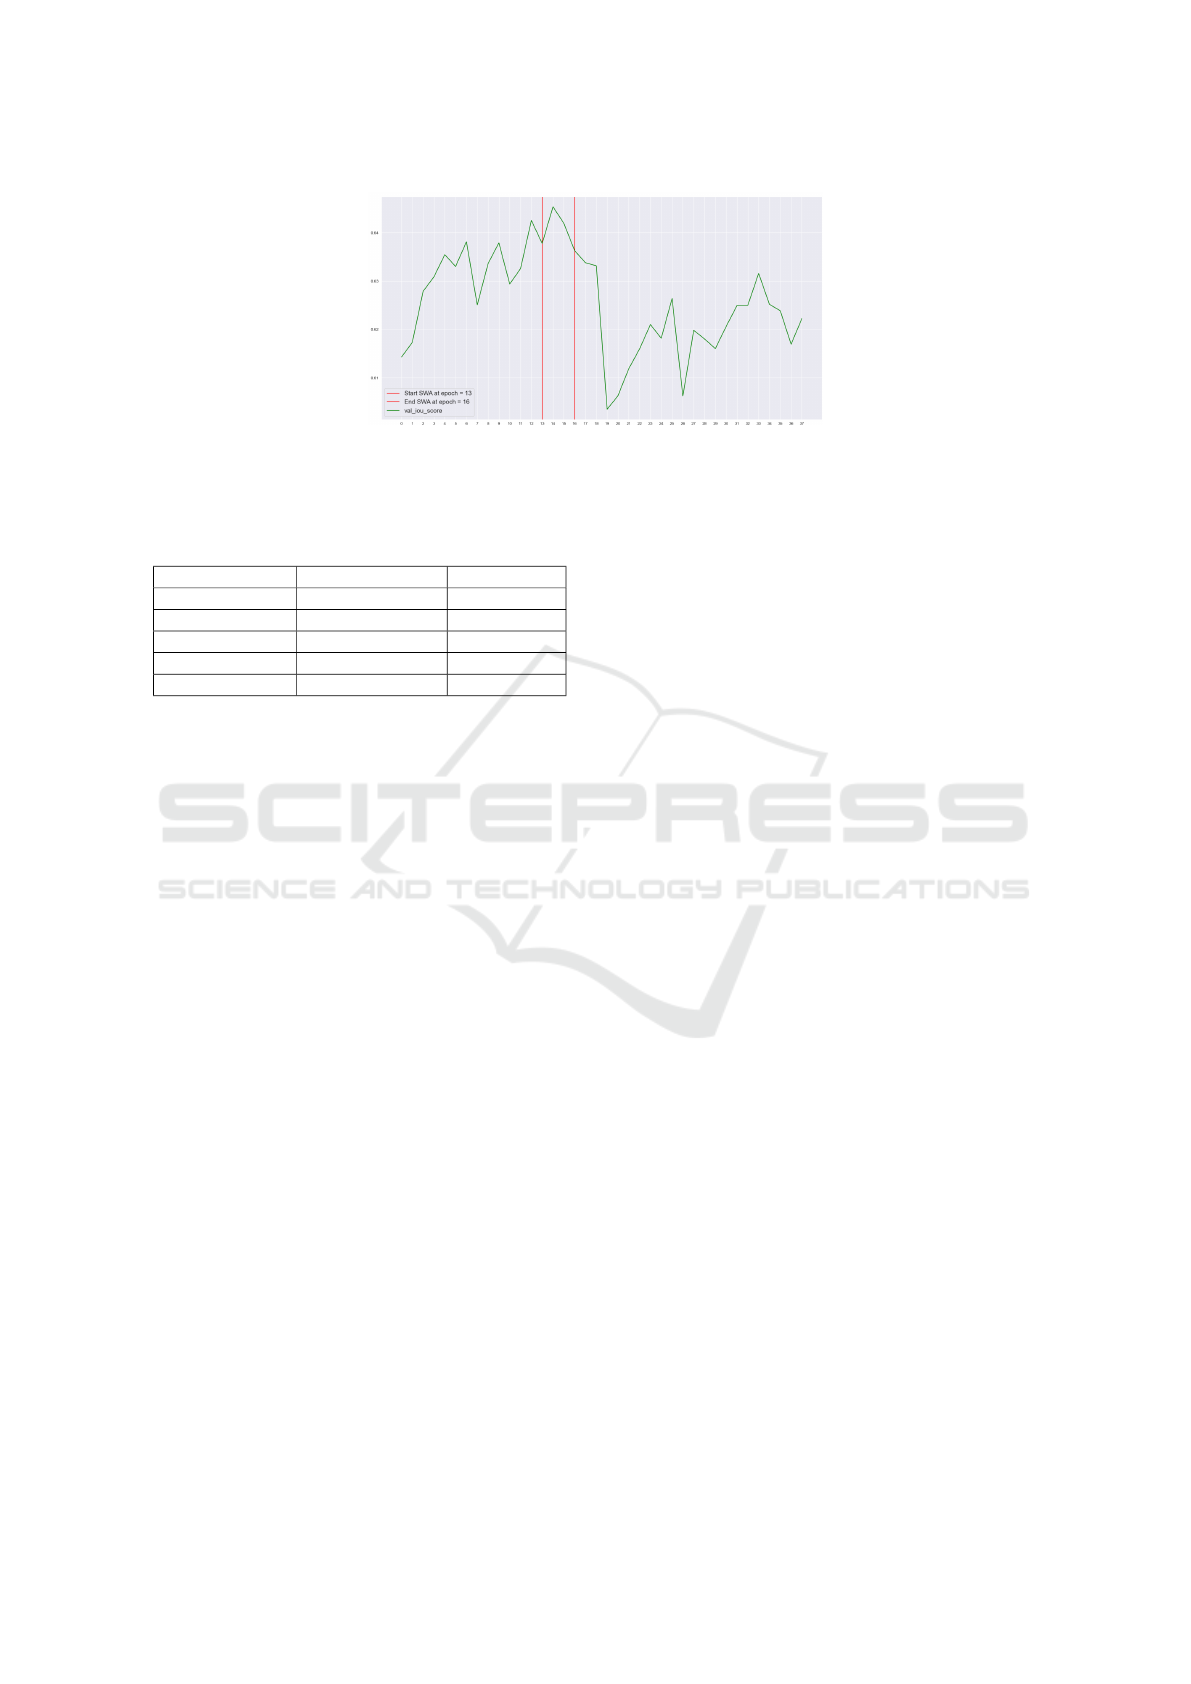
Figure 4: The validation IoU score. We apply the SWA approach between epochs 13
th
and 16
th
, when the validation IoU
score reaches the highest values between epoch 13
th
and 16
th
. The red vertical lines represent the starting and the ending
epochs for the SWA.
Table 2: Influence of the connected components hyperpa-
rameter upon the final result.
Component Size Image Resolution Private Score
3500 1024x1024 0.8347
4500 1024x1024 0.8329
750 512x512 0.8328
1750 1024x1024 0.8318
250 512x512 0.8307
4.1.3 Small ROI Elimination
As the segmentation module receives input images
with 512x512 dimension and the final results are en-
coded on 1024x1024 resolution, the natural question
of resolution choice for small positive remains.
In Table 2 we provide the results of the ex-
perimentation that we performed with this hyper-
parameter. The component size represents the elim-
ination threshold for a connected component. The re-
sults demonstrate that only tuning the connected com-
ponent hyper-parameter can greatly influence the final
score.
4.2 Evaluation of the Entire System
The solution that we provided obtains the 130
th
po-
sition in the private score of the competition. We
achieved 0.8347 mean-Dice coefficient on the private
score by combining the classification module in con-
junction with the segmentation and the small regions
of interest eliminator modules. At the time of writ-
ing this paper, the previously mentioned score would
achieve a bronze-medal position in the on-going com-
petition.
It is important to outline the results presented in
2, as opting for a different combination of resolution
and connected component size can drastically reduce
the final private score.
Last but not least, a crucial aspect to emphasize
that, given the exact same configuration and in ab-
sence of the classification module, the final mean-
Dice coefficient score would be 0.7012. This is more
than 0.13 lower than the best configuration obtained
with the employment of the classification module,
which is 0.8347 (first line in 2).
It is also worth mentioning that the 1
st
place in
the Kaggle competition adopted the same approach of
constructing a strong pipeline alongside several mod-
ifications: first, the classification module is replaced
with a triplet scheme of inference and validation, in
which possible pneumothorax or non-pneumothorax
images are eliminated considering the area and pre-
diction confidence. In addition to this, a weighted
combination of Dice, focal and binary cross-entropy
is used. Another novel idea that is employed in the
first place solution is the sliding sample rate: the
author notes that a better convergence of network
weights can be obtained if the sample rate is adapted
as the training progresses (0.8 at the beginning and
0.4 towards the end), where the sample rate is the
portion of pneumothorax images. At the same time,
several other augmentations are used such as elastic
transform and grid distortion. The solution achieves
0.8679 mean-Dice coefficient on the private score.
5 CONCLUSIONS
In this paper we presented a pipeline for detecting the
pneumothorax from X-Rays. It consists of two deep
learning modules: a classifier, whose purpose is to
eliminate images which do not contain pneumotho-
rax, and a segmentation module which segments only
images classified as containing pneumothorax. In ad-
dition to the deep learning modules, the results are
refined by a classical computer vision component,
which eliminates areas which are insignificant in size.
Experimentally, we observed that a deep learning
model, when subjected to aggressive augmentation,
can obtain similar results to the same model on an en-
Approaching the Semantic Segmentation in Medical Problems: A Solution for Pneumothorax Detection
271

riched dataset, otherwise given the same exact train-
ing configurations. Also, we argue that aggressive
augmentation, given a consistent number of epochs,
achieves similar or better results to enrichment, in
spite of the balance achieved by the latter. Moreover,
a combination of several state-of-the-art techniques,
such as a modified Stochastic Weight-Averaging with
Cosine Annealing scheduler used for training the seg-
mentation module further improves the performance.
A powerful characteristic of our pipeline resides
in its replaceable modules: as the state-of-the-art ad-
vances, both the classification and the segmentation
modules can be replaced with improved versions,
thereby potentially leading to better results. We rec-
ommend that such a pipeline be used in all medical
segmentation problems; while we consider that the
deep learning modules should be indispensable (given
a complex dataset), the existence of the small regions
of interest component is debatable: depending on the
exact nature of the medical problem, the threshold for
elimination can vary to a great extent, if the module is
to be implemented.
As possible improvements, we consider that the
Tversky Loss (Salehi et al., 2017) could be used to
improve the final results, as it shows promising results
on both 2D and 3D image segmentation. In addition,
it could be relevant to investigate whether the usage of
class weights to penalize harder false negative errors
could also contribute to an increased recall. Last, but
not least, test-time augmentation is a technique that
has been widely used recently and could contribute to
increasing the performance.
REFERENCES
Chen, L., Zhu, Y., Papandreou, G., Schroff, F., and Adam,
H. (2018). Encoder-decoder with atrous separable
convolution for semantic image segmentation. CoRR,
abs/1802.02611.
Chollet, F. (2016). Xception: Deep learning with depthwise
separable convolutions. CoRR, abs/1610.02357.
Cordts, M., Omran, M., Ramos, S., Rehfeld, T., Enzweiler,
M., Benenson, R., Franke, U., Roth, S., and Schiele,
B. (2016). The cityscapes dataset for semantic urban
scene understanding. In Proc. of the IEEE Conference
on Computer Vision and Pattern Recognition (CVPR).
Deng, J., Dong, W., Socher, R., Li, L.-J., Li, K., and Fei-
Fei, L. (2009). Imagenet: A large-scale hierarchical
image database. In 2009 IEEE conference on com-
puter vision and pattern recognition, pages 248–255.
Ieee.
Geiger, A., Lenz, P., Stiller, C., and Urtasun, R. (2013).
Vision meets robotics: The kitti dataset. International
Journal of Robotics Research (IJRR).
Hu, J., Shen, L., and Sun, G. (2017). Squeeze-and-
excitation networks. CoRR, abs/1709.01507.
Irvin, J., Rajpurkar, P., Ko, M., Yu, Y., Ciurea-Ilcus, S.,
Chute, C., Marklund, H., Haghgoo, B., Ball, R. L.,
Shpanskaya, K. S., Seekins, J., Mong, D. A., Halabi,
S. S., Sandberg, J. K., Jones, R., Larson, D. B., Lan-
glotz, C. P., Patel, B. N., Lungren, M. P., and Ng, A. Y.
(2019). Chexpert: A large chest radiograph dataset
with uncertainty labels and expert comparison. CoRR,
abs/1901.07031.
Izmailov, P., Podoprikhin, D., Garipov, T., Vetrov, D. P.,
and Wilson, A. G. (2018). Averaging weights leads
to wider optima and better generalization. CoRR,
abs/1803.05407.
Kingma, D. P. and Ba, J. (2014). Adam: A method for
stochastic optimization. CoRR, abs/1412.6980.
Lin, T., Doll
´
ar, P., Girshick, R. B., He, K., Hariharan, B.,
and Belongie, S. J. (2016). Feature pyramid networks
for object detection. CoRR, abs/1612.03144.
Lin, T., Goyal, P., Girshick, R. B., He, K., and Doll
´
ar, P.
(2017). Focal loss for dense object detection. CoRR,
abs/1708.02002.
Loshchilov, I. and Hutter, F. (2016). SGDR: stochastic gra-
dient descent with restarts. CoRR, abs/1608.03983.
Neuhold, G., Ollmann, T., Bulo, S. R., and Kontschieder,
P. (2018). The mapillary vistas dataset for semantic
understanding of street scenes. In 2017 IEEE Interna-
tional Conference on Computer Vision (ICCV), vol-
ume 00, pages 5000–5009.
Ronneberger, O., P.Fischer, and Brox, T. (2015). U-
net: Convolutional networks for biomedical image
segmentation. In Medical Image Computing and
Computer-Assisted Intervention (MICCAI), volume
9351 of LNCS, pages 234–241. Springer. (available
on arXiv:1505.04597 [cs.CV]).
Salehi, S. S. M., Erdogmus, D., and Gholipour, A. (2017).
Tversky loss function for image segmentation us-
ing 3d fully convolutional deep networks. CoRR,
abs/1706.05721.
Society for Imaging Informatics in Medicine (SIIM),
American College of Radiology (ACR), S. o.
T. R. S. M. (2019). Siim-acr pneumotho-
rax segmentation. https://www.kaggle.com/c/
siim-acr-pneumothorax-segmentation.
Szegedy, C., Ioffe, S., and Vanhoucke, V. (2016). Inception-
v4, inception-resnet and the impact of residual con-
nections on learning. CoRR, abs/1602.07261.
Tan, M. and Le, Q. V. (2019). Efficientnet: Rethink-
ing model scaling for convolutional neural networks.
CoRR, abs/1905.11946.
Timbus, C., Miclea, V.-C., and Lemnaru, C. (2018). Se-
mantic segmentation-based traffic sign detection and
recognition using deep learning techniques. pages
325–331.
Wu, Y. and He, K. (2018). Group normalization. CoRR,
abs/1803.08494.
Xie, S., Girshick, R. B., Doll
´
ar, P., Tu, Z., and He, K.
(2016). Aggregated residual transformations for deep
neural networks. CoRR, abs/1611.05431.
Zhao, H., Shi, J., Qi, X., Wang, X., and Jia, J. (2016). Pyra-
mid scene parsing network. CoRR, abs/1612.01105.
Zoph, B., Vasudevan, V., Shlens, J., and Le, Q. V. (2017).
Learning transferable architectures for scalable image
recognition. CoRR, abs/1707.07012.
VISAPP 2021 - 16th International Conference on Computer Vision Theory and Applications
272
