
Reproducing Evacuation Behaviors of Evacuees
during the Great East Japan Earthquake
using the Evacuation Decision Model with Realistic Settings
Akira Tsurushima
a
Intelligent Systems Laboratory, SECOM CO., LTD., Mitaka, Tokyo, Japan
Keywords:
Evacuation Decision Model, Herd Behavior, Functional Field of View, Tunnel Vision.
Abstract:
The analysis of evacuation behaviors from the video captured during the Great East Japan Earthquake revealed
that the evacuation behaviors of fleeing and dropping down were affected by the distance from the exits.
These behaviors were reproduced through simulations by employing the evacuation decision model, which
is a model of herd behaviors during evacuations; this showed that these unique evacuation behaviors could
be reproduced by simple herd behaviors. However, the results are questionable owing to the oversimplified
settings of the simulations, such as the different number and density of agents and the overlooked physical
constraints. We conduct simulations with settings that are more representative of those in the video clip. The
unique evacuation behavior is also reproduced with our simulation setting but for limited ranges of parameter
values. The analysis of the results reveals that the parameters related to the vicinity of an agent are significant;
this lead to the hypothesis that the attention of evacuees is narrowed to 20 degrees with a relatively long range
during evacuations.
1 INTRODUCTION
The fields of pedestrian dynamics, collective be-
haviors, and crowd evacuations have gathered mas-
sive attention from researchers; owing to this, sev-
eral studies have been conducted on these fields,
and the associated literature has rapidly increased
(Haghani, 2020a; Haghani, 2020b). Although several
researchers consider the effects of cognitive or psy-
chological factors in disaster evacuations to be signif-
icant (Sieben et al., 2017; Haghani et al., 2016), little
is known about the mental mechanisms and cognitive
processes of these factors owing to the difficulties in-
volved in obtaining objective data. Therefore, stud-
ies on human evacuation behaviors are usually con-
ducted through interviews of survivors (Mas et al.,
2012; Drury et al., 2015), laboratory experiments with
humans (Schmidt and Galea, 2013; Garcimart
´
ın et al.,
2014; Haghani et al., 2016) or animal subjects (Sa-
loma et al., 2003; Ji et al., 2017), and literature stud-
ies. However, these methods have limitations in terms
of objectivity; for example, reproducing mental stress
of real evacuations in laboratory experiments is dif-
ficult, and methods employing interviews or surveys
a
https://orcid.org/0000-0003-2711-297X
are subject to survivorship bias. With the increase
in surveillance cameras and smartphones, videos and
images of disaster evacuations have been accrued;
novel approaches to investigate evacuation behaviors
have emerged by analyzing these videos (Yang et al.,
2011; D’Orazio et al., 2014; Gu et al., 2016).
Tsurushima (2020) combined multi-agent simula-
tions with video analysis to investigate human evac-
uation behaviors during an earthquake. This study
analyzed a video clip captured during the Great East
Japan Earthquake and discovered unique human evac-
uation behavior that showed that distances to ex-
its determine the choice of actions between fleeing
the room and dropping under the table (Tsurushima,
2020). This unique evacuation behavior was repro-
duced by multi-agent simulations using the evacua-
tion decision model (Tsurushima, 2019), a model of
human herd behavior, which shows a cognitive bias
during evacuations (Altshuler et al., 2005; Helbing
et al., 2000; Lovreglio et al., 2014; Raafat et al.,
2009). Tsurushima concluded that simple herd behav-
iors are sufficient to reproduce the unique evacuation
behavior.
The research revealed the effects of herd behav-
ior on evacuations and reproduced diagonal spatial
patterns of the choices between fleeing and dropping
Tsurushima, A.
Reproducing Evacuation Behaviors of Evacuees during the Great East Japan Earthquake using the Evacuation Decision Model with Realistic Settings.
DOI: 10.5220/0010167700170027
In Proceedings of the 13th International Conference on Agents and Artificial Intelligence (ICAART 2021) - Volume 1, pages 17-27
ISBN: 978-989-758-484-8
Copyright
c
2021 by SCITEPRESS – Science and Technology Publications, Lda. All rights reserved
17
through simulations; however, the results are ques-
tionable owing to the oversimplified configurations of
these simulations. In the video, 48 people were ar-
ranged in a square facing the center of the room; their
movements were constrained by desks and chairs. In
contrast, in the simulation settings, 500 people were
evenly distributed across the room; their movements
were unconstrained. These differences are not negli-
gible because, in the evacuation decision model, herd
behaviors are determined by the movements of others
in the vicinity of each agent. Thus, these differences
may result in different results.
In this study, we reexamine the works of (Tsu-
rushima, 2020) through simulations using the same
model but with more realistic simulation settings; we
investigate whether the results hold under the new set-
tings. We also analyze the conditions in which and
the reasons why the evacuation decision model repro-
duces the unique evacuation behaviors captured in the
video clip. The results of the analysis yield a hypoth-
esis based on human cognitive factors, which affect
evacuation behaviors, that might be difficult to be ob-
tained by empirical studies.
2 EVACUATION BEHAVIOR
DURING THE GREAT EAST
JAPAN EARTHQUAKE
In this section, we briefly describe the work of (Tsu-
rushima, 2020) including the unique evacuation be-
havior reported, the evacuation decision model, and
the configurations and results of the simulations. We
also mention the differences in the simulation config-
urations compared to the real situations in the video
clip.
2.1 Diagonal Spatial Pattern
From the analysis of the video clip
1
captured during
the Great East Japan Earthquake, Tsurushima (2020)
reported unique evacuation behaviors of people, in
which choosing between fleeing the room and drop-
ping under tables was decided based on the distances
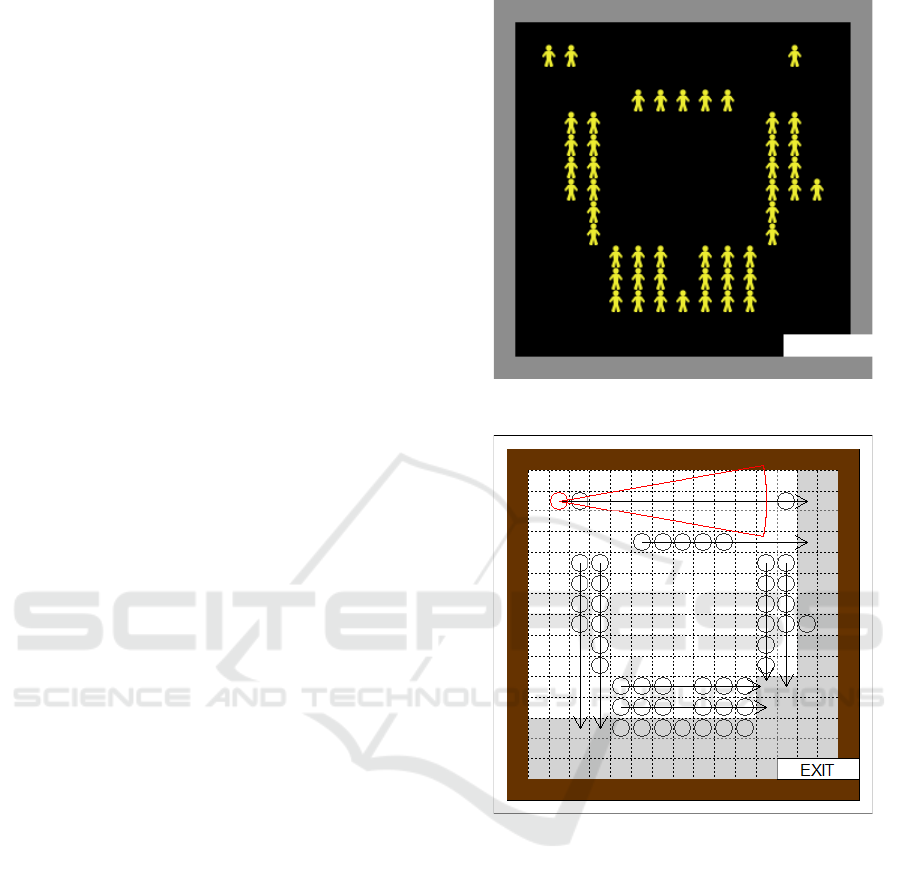
to the exits. Figure 1 shows the initial positions of 48
people at the start of the earthquake in a square room
with only one exit at the lower right corner. Figure
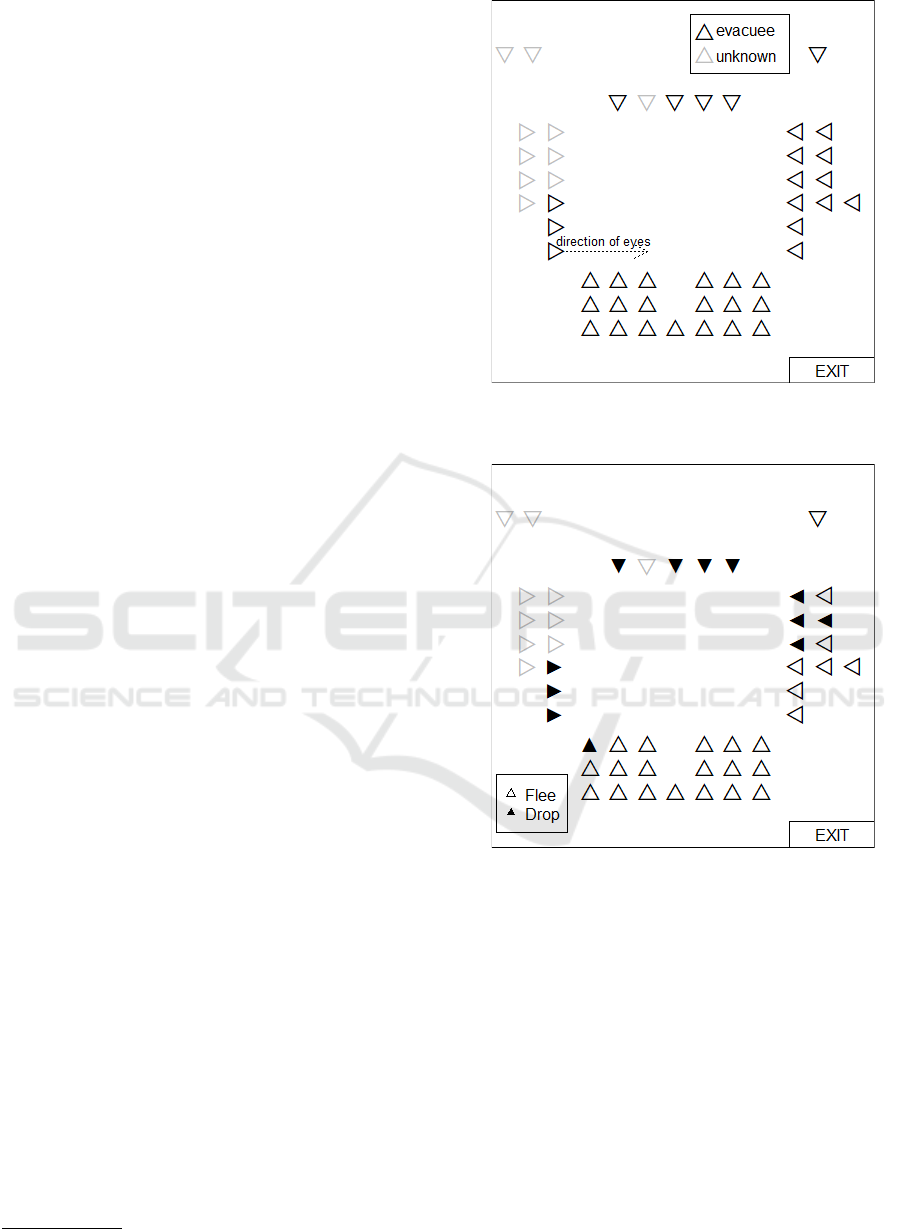
2 shows the result of the video analysis, in which a
diagonal spatial pattern of the evacuees’ choices be-
tween fleeing and dropping emerged at the end of the
earthquake depending on their distances to the exit. A
white triangle denotes an evacuee who chose to flee
1
https://www.youtube.com/watch?v=tejlDDKeg8s
Figure 1: Initial positions of 48 people in the room. Each
faces the center of the room.
Figure 2: Final choices of either fleeing or dropping.
and a black triangle denotes an evacuee who chose
to drop. A gray triangle denotes an evacuee whose
choice is unknown.
A simple theory to describe the phenomenon is
that an evacuee determines the choice between flee-
ing and dropping based on his/her distance to the exit.
Instead of the simple theory, Tsurushima made a hy-
pothesis that evacuees make a random choice between
fleeing and dropping; however, herd behaviors among
evacuees result in a diagonal spatial pattern.
2.2 Evacuation Decision Model
The diagonal spatial pattern of fleeing and dropping
evacuees was reproduced by simulations using the
ICAART 2021 - 13th International Conference on Agents and Artificial Intelligence
18

evacuation decision model, which is a model of herd
behavior during human evacuations.
In the evacuation decision model, agent a
i
has a
variable X
i
∈ {0,1}; a
i
decides his/her behavior either
by himself/herself if X = 1 or by herd behavior if X =
0. The values of X toggles between 0 and 1 with the
following transition probabilities:
P(X
i
= 0 → X
i
= 1) =
s
2
i
s
2
i
+ θ
2
i
, (1)
P(X
i
= 1 → X
i
= 0) = ε, (2)
where s
i
is a local estimate of the stimulus from the
environment for a
i
, θ
i
is the response threshold of a
i
,
and ε is a constant probability common for all agents.
A local estimate of the stimulus from the environment
is calculated as follows:
s
i
(t + 1) = max{s
i
(t) + δ − α(1 − R)F, 0}, (3)
where δ is the increase of the stimulus per unit time
and α is the scale factor of the stimulus. R, the risk
perception function of objective risk r, is defined as
follows:
R(r) =
1
1 + e
−g(r−µ
i
)
, (4)
where g is the activation gain of the sigmoid function
and µ
i
is the risk perception factor of a
i
, which rep-
resents the individual sensitivity to risk. r represents
the objective risk in the environment, which is given
as follows:
r(t + 1) = r(t) + ∆r (5)
and r(0) = 0. F is the evacuation progress function of
a
i
that estimates the total progress of the evacuation:
F(n) =
1 − n/
ˆ
N n <
ˆ
N
0 otherwise,
(6)
where n is the number of agents in the vicinity and
ˆ
N is the maximum possible number of agents in the
vicinity. The vicinity of an agent is defined by dis-
tance d (units) and angle ω (degrees) from the direc-
tion in which the agent is headed. Depending on the
value of X
i
, a
i
performs one of the following actions:
1. if X
i
= 1, randomly chooses to either flee or drop,
or
2. if X
i
= 0, chooses to flee or drop, or his/her action
is undetermined depending on the most popular
action in the vicinity.
No agent estimates the distance to the exit or chooses
his/her behavior based on the distance.
Figure 3: Example of the diagonal spatial pattern. All flee-
ing agents went out through the exit and all dropping agents
were in the room. A diagonal border between fleeing and
dropping agents has emerged.
2.3 Simulation A
Hereinafter, we refer to the simulations in (Tsu-
rushima, 2020) as simulation A. In simulation A, 500
agents incorporating the evacuation decision model
were evenly distributed in a square space (40 × 40
units) with only one exit at the lower right corner (Fig.
3). The parameters used in simulation A were as fol-
lows: α = 1.2, δ = 0.5, ε = 0.2, g = 1.0,
ˆ
N = 10,
d = 5, and ω = 120.
Figure 3 illustrates an example of the simulation re-
sults showing a diagonal spatial pattern of fleeing and
dropping evacuees; the unique evacuation behavior
captured in the video (a diagonal spatial pattern) is
reproduced by the evacuation decision model.
2.4 Critical Analysis
Tsurushima (2020) concluded that simple herd behav-
ior is sufficient to reproduce the diagonal spatial pat-
tern because all actions by agents in simulation A are
either random or herd behavior. However, the initial
condition of simulation A might not be considered as
the same as that of the real situation captured in the
video; therefore, the results of the study are question-
able.
The environment of simulation A, which is a
square room with one exit at one corner, can be a
good representation of the real situation in the video.
However, the number of agents and their initial lay-
out in the room are very different from the real situa-
tion. The number of agents in simulation A was 500,
Reproducing Evacuation Behaviors of Evacuees during the Great East Japan Earthquake using the Evacuation Decision Model with
Realistic Settings
19
whereas there were 48 agents in the real situation. The
agents were evenly distributed across the room with
high density in simulation A, whereas people were ar-
ranged in a square with relatively sparse density in the
real situation. Furthermore, agents faced random di-
rections in simulation A, whereas all the people in the
video faced the center of the room.
In the video, tables and chairs were laid out in a
square shape in the room and the movements of peo-
ple were physically restricted by these objects. How-
ever, the movements of the agents in simulation A
were unrestricted; agents could move directly toward
the exit. In the evacuation decision model, the de-
cision of an agent is determined by the behaviors of
other agents in the vicinity of that agent. Thus, the
position of an agent in the room will affect the deci-
sions of other agents and vice versa. The following
factors can significantly affect the overall dynamics
of the behavior of the model.
1. Constraints against the movement of an agent.
2. Vicinity of an agent (direction in which the agent
is facing).
3. Distribution of agents in the room.
Therefore, the differences between the configurations
of simulation A and those of the real situation are not
negligible. A more extensive analysis of these differ-
ences is required.
3 EXPERIMENT
In this section, we describe simulations using the
evacuation decision model with more realistic config-
urations (we will call them simulation B) and examine
whether the diagonal spatial pattern reported by Tsu-
rushima (2020) can be reproduced with these settings.
3.1 Simulation B
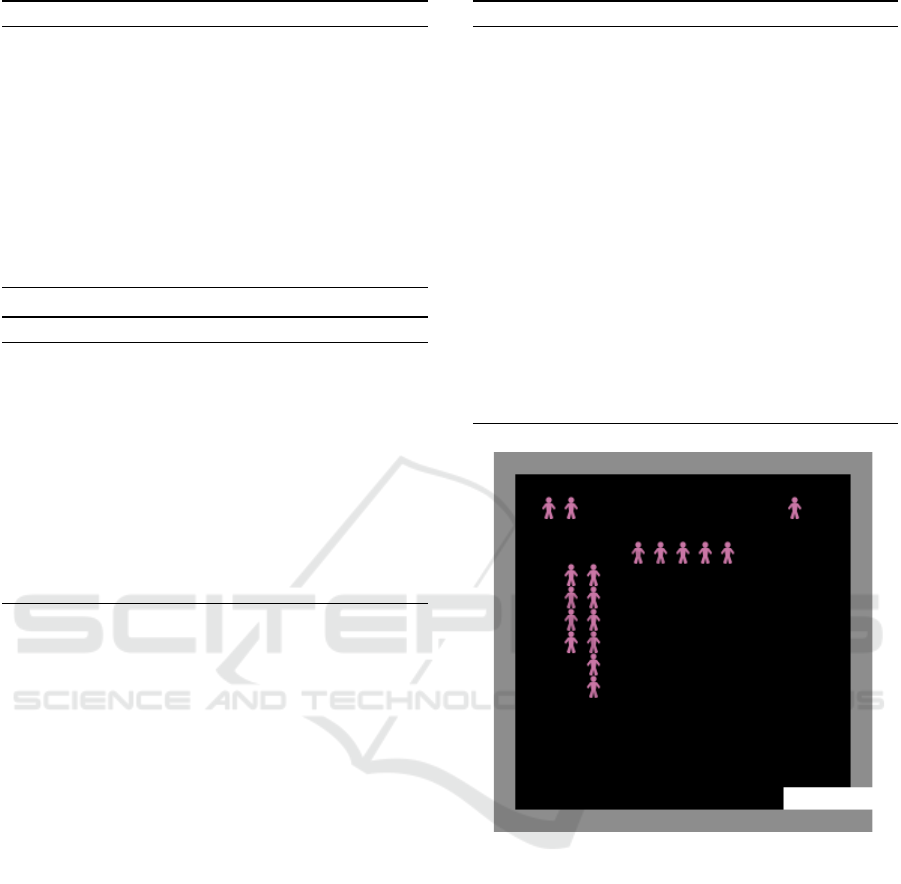
Figure 4 depicts the initial positions of 48 agents in
a square space (15 × 15 units), which has one exit at
the lower right corner. All the agents face toward the
center of the room, as in the video clip.
Figure 5 illustrates the constraints on the move-
ments of these agents. A circle on a grid refers to the
initial position of an agent. An arrow on a grid shows
the direction of movement that agents on those grids
must follow. For example, the red agent in the up-
per left in the figure can only move to the right. Grey
grids show the area where the movements of agents
are unrestricted. Thus, when an agent reaches one of
these grids, he/she can move directly to the exit.
Figure 4: Initial positions of 48 agents.
Figure 5: Constraints on the movement of agents. Arrows
depict the movement direction. Grey area shows the area
where the movements of agents are unrestricted. The red
fan shape shows the field of view of the red agent on the
upper left corner.
In simulation A, an agent is unrestricted physically,
and therefore can pass through other agents standing
on the way to the exit. In contrast, the agents in sim-
ulation B are constrained physically; hence, agents in
this setting are unable to pass through other agents.
They must stop whenever other agents are in front of
them.
Although the configurations are different, an agent
incorporating the evacuation decision model is identi-
cal to the one employed in simulation A. The param-
eters used in simulation B are as follows: α = 0.4,
δ = 1.0, ε = 0.1, g = 0.7,
ˆ
N = 10, d = 10, ω = 20,
and ∆r = 2.0.
ICAART 2021 - 13th International Conference on Agents and Artificial Intelligence
20
Algorithm 1: Herd Behavior (X = 0).
n
d
⇐ |{a
j
∈ V
i
|π
j
(t) = drop}|
n
e
⇐ |{a
j
∈ V
i
|π
j
(t) = f lee}|
n
u
⇐ |{a
j
∈ V
i
|π
j
(t) = undecided}|
if n
d
> n
e
and n
d
> n
u
then
π
i
(t) ⇐ drop
else if n
e
> n
d
and n
e
> n
u
then
π
i
(t) ⇐ f lee
end if
if π
i
(t) = f lee then
move 1 unit following the constraints in Fig. 5.
end if
Algorithm 2: Random Selection (X = 1).
if π
i
(t) = undecided then
τ ∼ U(0,1)
if τ ≤ 0.5 then
π
i
(t) ⇐ drop
else
π
i
(t) ⇐ f lee
end if
end if
if π
i
(t) = f lee then
move 1 unit following the constraints in Fig. 5.
end if
3.2 Simulation Model
In this section, we briefly describe the simulation
algorithms employed in the experiments. The al-
gorithms are identical to those used by Tsurushima
(2020).
A = {a
1
,a
2
,.. .,a
48
} is a set of 48 agents assigned
in the square space, as shown in Fig. 4. An agent a
i
has a variable π
i
(t) = {drop, f lee,undecided} hold-
ing a current decision. The vicinity of a
i
is defined as
V
i
= {a
j
∈ A|υ(a
j
,a
i
)}, where υ : A
2
→ {true, f alse},
and υ refers to a fan-like range of d units ω degrees
toward the direction of motion of a
i
.
Algorithm 1 describes the action of a
i
with X
i
= 0
(herd behavior), and Algorithm 2 describes the action
of a
i
with X
i
= 1 (random selection). Assuming a
simulation time t = 1,. ..,T , the overall procedure is
given in Algorithm 3.
NetLogo 6.1.1 (Wilensky, 1999) was used to im-
plement the algorithms described in this section.
3.3 Result
Figure 6 depicts an example result of simulation B.
Similar to the result of simulation A (Fig. 3), the
agents that remained were on the far left from the exit
in the space, resulting in a diagonal spatial pattern.
Algorithm 3: Simulation.
for t = 1 to T do
r ⇐ min{r + ∆r,100}
for all a
i
∈ A do
Caluculate s
i
, R, and F (eq. 3, 4, and 6)
τ ∼ U(0,1)
if X
i
= 1 ∧ τ < P(X
i
= 1 → X
i
= 0) then
X
i
⇐ 0
Execute Algorithm 1 {Herd Behavior}
else if X
i
= 0 ∧ τ < P(X
i
= 0 → X
i
= 1) then
X
i
⇐ 1
Execute Algorithm 2 {Random Selection}
end if
if a
i
is on the exit then
A ⇐ A \ a
i
end if
end for
end for
Figure 6: Example result of simulation B.
The results similar to Fig. 3 are not necessarily ob-
tained because of the stochastic nature of the model.
Thus, we conducted 300 simulations to confirm the
generality of the results.
Figure 7 shows the heat map of the results of 300
simulations. The dark area indicates a high frequency
of remaining agents and the light area indicates a low
frequency of remaining agents. Similar to simulation
A, agents that remained were far from the exit; none
or very few agents remained in areas close to the exit.
Note that we employed the logarithm of the frequency
of the number of remaining agents when creating the
heat map because the frequency varies significantly.
Now, we can conclude that the behaviors captured
in the video clip in (Tsurushima, 2020) can be repro-
duced by simulation B as well as simulation A.
Reproducing Evacuation Behaviors of Evacuees during the Great East Japan Earthquake using the Evacuation Decision Model with
Realistic Settings
21
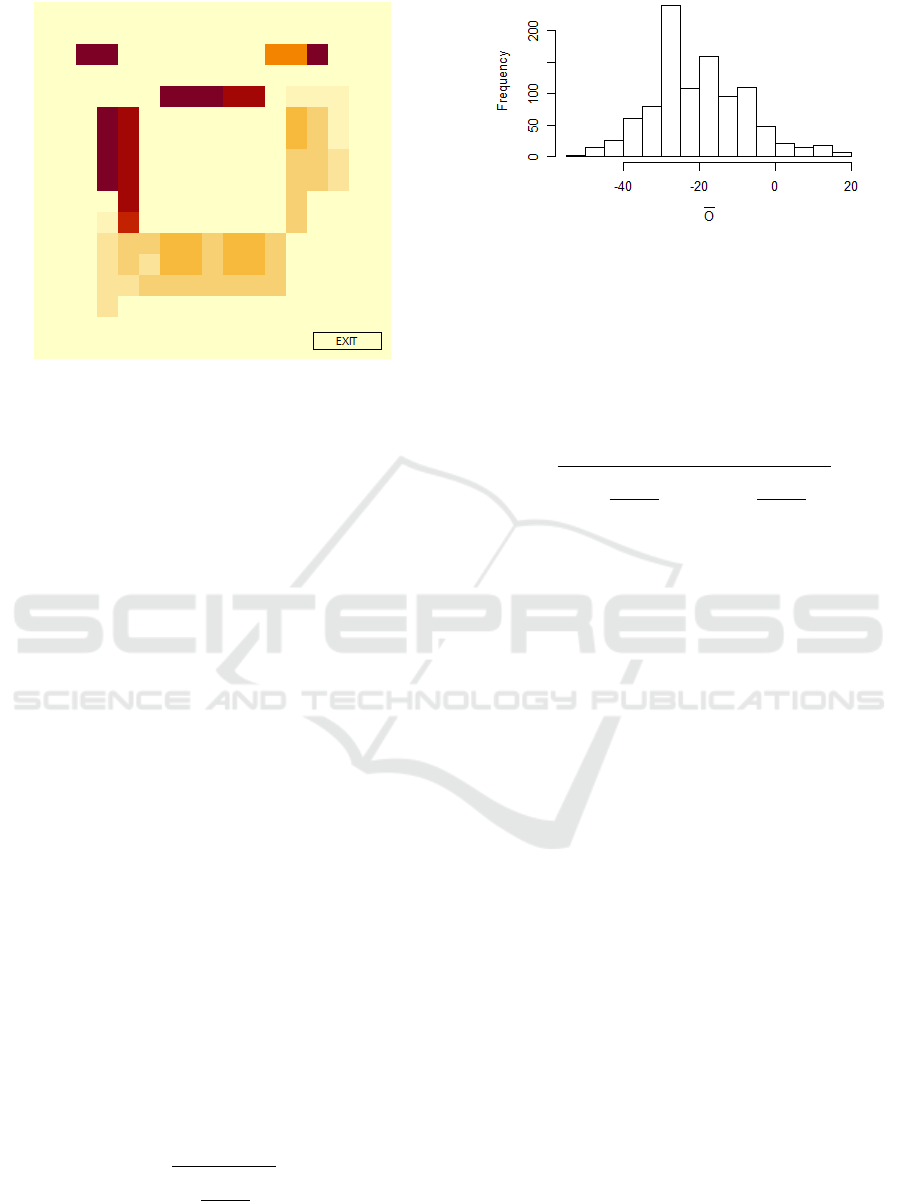
Figure 7: Heat map of the results of 300 simulations.
4 ANALYSIS
Practically, obtaining the result presented in section
3.3 was quite challenging owing to the parameter sen-
sitivity of the model. Most sets of parameters failed
to produce the diagonal spatial pattern captured in the
video. Thus, we employed black-box optimization
techniques to explore parameter sets that can repro-
duce the diagonal spatial pattern, which discriminates
between fleeing and dropping behaviors as shown in
the video.
For this, an objective function that evaluates the
simulation results in terms of the diagonal spatial pat-
tern is required. By considering the center of the room
as the origin, the objective function must take the fol-
lowing two conditions into account.
1. Maximize the number of agents above y = x; min-
imize those below y = x.
2. Make the number of agents symmetrical with re-
spect to y = −x; i.e., minimize the absolute value
of the difference between the numbers of agents
above and below y = −x.
Let the coordinates of agent a
i
be (x
i
,y
i
). Condition 1
can be expressed by maximizing:
L
+
=
∑
{a
i
|y
i
≥x
i
}
l
+
i
−
∑
{a
j
|y
j
<x
j
}
l
+
j
, (7)
where l
+
i
is the distance between a
i
and y = x.
l
+
i
=
s
2
x
i
− y
i
2
2
. (8)
Condition 2 can be expressed by minimizing:
Figure 8: Histogram of the values of
¯
O for 1000 simulations
with random parameters.
L
−
=
∑
{a
i
|y
i
≥−x
i
}
l
−
i
−
∑
{a
j
|y
j
<−x
j
}
l
−
j
, (9)
where l
−
i
is the distance between a
i
and y = −x.
l
−
i
=
s
x
i
+
y
i
− x
i
2
2
+
y
i
−
y
i
− x
i
2
2
. (10)
Thus, the black-box optimization problem mentioned
above is to maximize
max O = L
+
− L
−
(11)
with respect to the domains of the parameters in the
evacuation decision model.
In the case of the result shown in section 3.3, the value
of O was 42.43.
Figure 8 shows the histogram of the values of
¯
O
for 1000 simulations for random parameters of the
evacuation decision model.
¯
O is the mean of the value
of Os for 100 simulations with a given set of param-
eters. The range of
¯
O is −54.06 ≤
¯
O ≤ 17.37. Fig-
ure 8 illustrates that
¯
O is negative in most cases; only
6% have a positive
¯
O. The result described in section
3.3, which necessarily has a positive O, is not easily
obtained by the evacuation decision model; a careful
choice of parameter values is required to reproduce
the diagonal spatial pattern.
4.1 Black-box Optimization
We conducted black-box optimization to search for
parameters that can reproduce the diagonal spatial
pattern. We employed simulated annealing as a search
algorithm and the mean of 100 simulation samples
(
¯
O) as the objective function in the search. There-
fore, the objective function was evaluated every 100
simulations. We conducted the search 20 times with
different initial points and 1000 iterations each.
ICAART 2021 - 13th International Conference on Agents and Artificial Intelligence
22
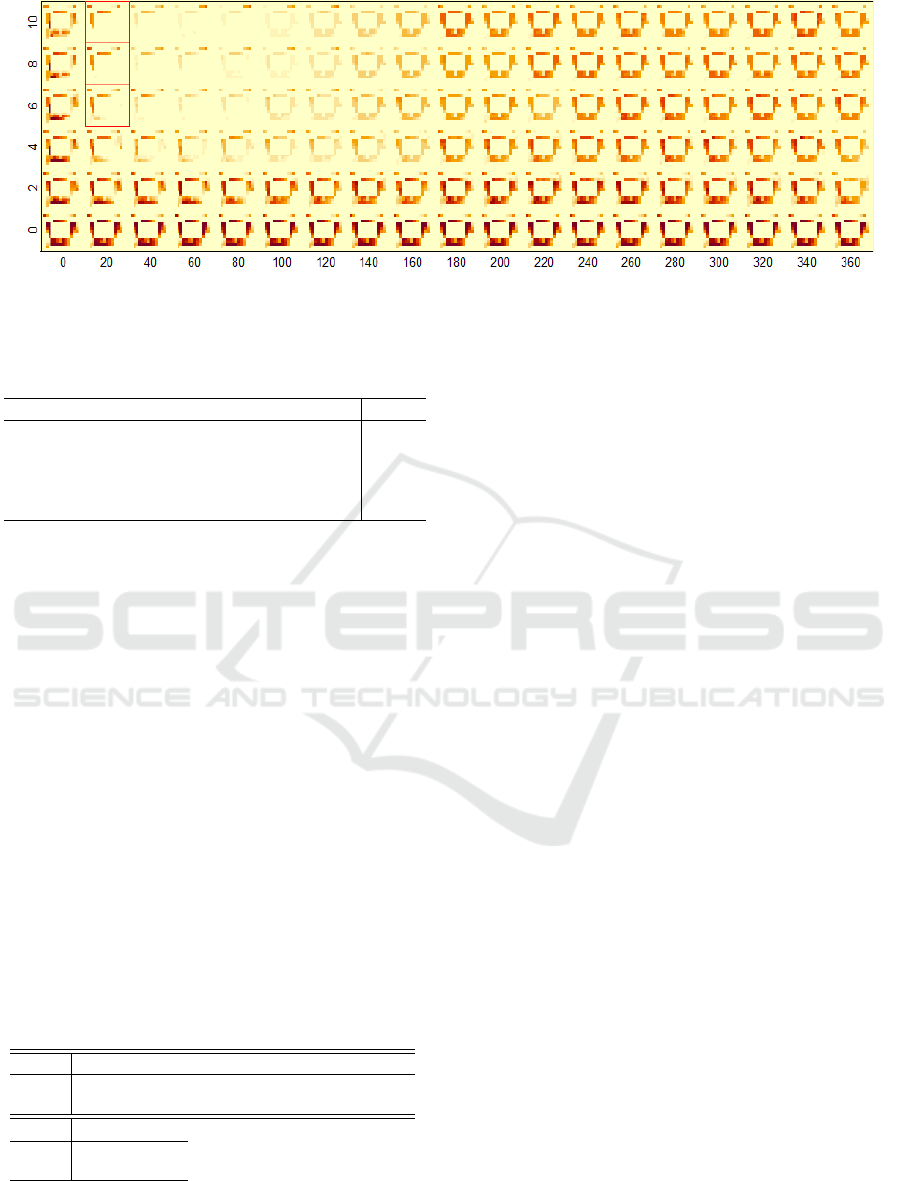
Figure 9: Results of sensitivity analysis for d and ω. The rows show d and the columns show ω. Each cell shows the heat
map of 100 simulations. Cells with red square frames refer to the result for
¯
O > 10.
Table 1: Top 5 results of black-box optimization.
ε δ α d ω ∆r
ˆ
N g
¯
O
0.1 1.2 0.1 10 20 5.0 15 0.4 28.95
0.1 0.7 0.4 10 20 2.0 1 1.5 27.76
0.1 1.1 0.8 8 20 5.0 2 1.4 26.64
0.2 0.6 0.6 9 20 2.5 7 1.4 26.23
0.1 1.0 0.2 10 20 1.5 20 0.2 26.22
Table 1 shows the top five results of the black-box
optimization; the complete table is given in the Ap-
pendix. The maximum value of the objective func-
tion found in 20 trials of black-box optimization was
¯
O = 28.95. Table 1 shows that the top five results
have some common parameter values, such as ε ≤ 0.2,
d ≥ 8, and ω = 20.
4.2 Multiple Regression Analysis
We investigated the statistical significance of each pa-
rameter against the objective value (
¯
O) using multiple
regression analysis. To conduct multiple regression
analysis, we randomly chose 100 samples from 1000
samples, from the results of simulations with random
parameters, as shown in Fig. 8. The result of the
analysis (P < 0.001) is given in Table 2. The top row
shows the coefficients of the parameters and the bot-
tom row shows the corresponding P-values.
Table 2: Result of multiple regression analysis.
ε δ α d ω ∆r
Coef 7.68 3.21 1.42 1.50 -0.06 1.18
P-val 0.01 0.06 0.36 0.00 0.00 0.05
ˆ
N g
Coef 0.12 -1.81
P-val 0.50 0.35
The result reveals that d and ω are statistically sig-
nificant (P < 0.001), implying that the vicinity of an
agent affects the simulation results significantly. Fur-
thermore, ε is also statistically significant (P < 0.01).
Note that we randomly chose 100 samples from 1000
from Fig. 8 to avoid the decrease in P-value owing to
the large size of the data.
4.3 Sensitivity Analysis
We conducted a sensitivity analysis for parameters d
and ω to examine the effects of these parameters on
the simulation results by varying d from 0 to 10 and
ω from 0 to 360. We conducted 100 simulations for
each combination of d and ω. The coordinates of all
agents that remained at the end of the simulation were
recorded; these coordinates were represented as a heat
map of the result of the analysis.
Figure 9 shows the heat maps of the results of
the simulations for each combination of parameters.
The rows in the figure show the values of d and the
columns show the values of ω. Each cell depicts the
positions of the remaining agents at the end of the
simulations. Dark colors show the high-frequency po-
sitions and light colors show low-frequency positions.
Figure 9 illustrates that most combinations of param-
eters lead to spatial patterns that are dissimilar to the
one in the video clip. Only a few cells at the upper
left in the figure show a diagonal spatial pattern. The
red square frames in the figure refer to the combina-
tions of d and ω with
¯
O > 10. This reveals that only
parameters with d ≥ 8 and ω = 20 will lead to the oc-
currence of diagonal spatial patterns. This result is in
good agreement with the result in section 4.1.
Furthermore, we conducted a sensitivity analysis
for ε, another significant parameter discussed in sec-
tion 4.2, which is the transition probability of X = 1
to X = 0. We conducted 100 simulations with ε vary-
ing from 0.1 to 1.0. The values of d and ω were fixed
to 10 and 20, respectively, during the analysis. The
Reproducing Evacuation Behaviors of Evacuees during the Great East Japan Earthquake using the Evacuation Decision Model with
Realistic Settings
23
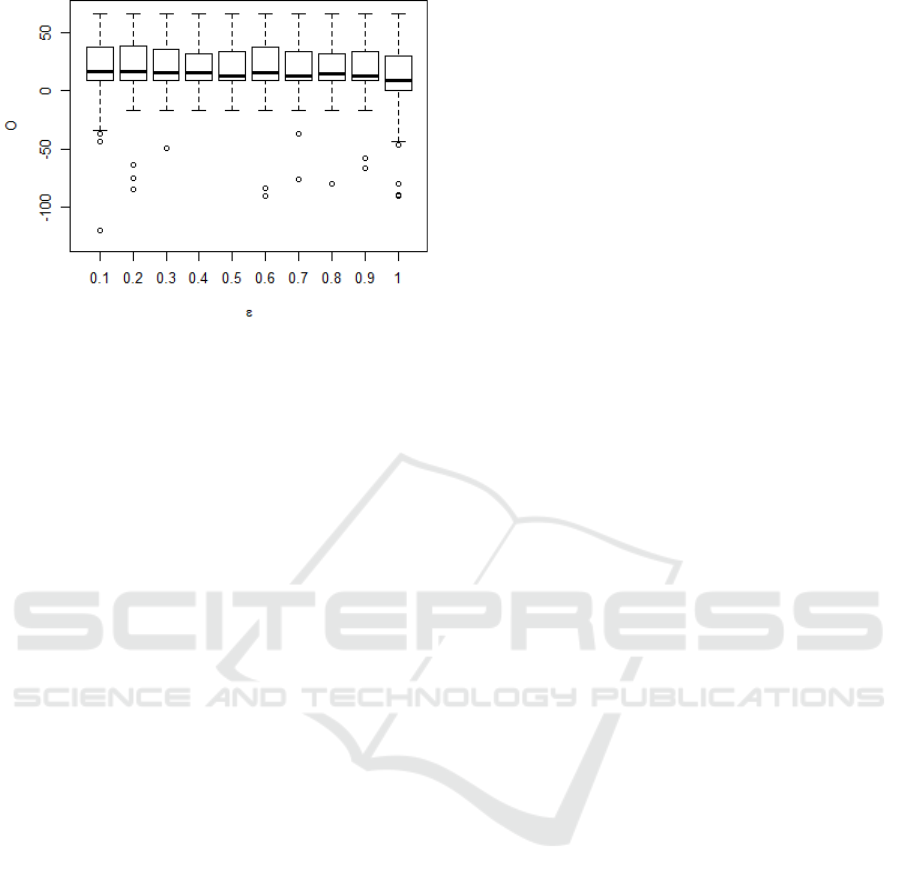
Figure 10: Results of sensitivity analysis for ε. Y-axis de-
picts the values of O.
results are presented as a box-and-whisker diagram in
Fig. 10. The x-axis represents ε and the y-axis repre-
sents O. The figure illustrates that the value of ε does
not affect simulation results much as long as the val-
ues of d and ω are within a certain range, implying
that the transition probability of intentional behaviors
(X = 1) to herd behaviors (X = 0) is unrelated to the
occurrence of a diagonal spatial pattern.
5 DISCUSSION
Section 3.3 showed that simulations with more realis-
tic settings (simulation B) can reproduce the diagonal
spatial pattern, similar to simulation A, of an evac-
uee’s choice between fleeing and dropping observed
in the video clip captured during the Great East Japan
Earthquake. However, this is only true for limited
ranges of parameters.
Analysis in section 4.2 revealed that d and ω are
statistically significant; the occurrence of a diagonal
spatial pattern is affected by these two parameters.
Black-box optimization in section 4.1 explored the
values of these parameters that will result in a diago-
nal spatial pattern, which were d ≥ 8 and ω = 20. The
sensitivity analysis in section 4.3 illustrated that diag-
onal spatial patterns are scarcely observed outside the
specified ranges of these two parameters. A diago-
nal spatial pattern was not obtained using the parame-
ter settings employed in simulation A, i.e., d = 5 and
ω = 120.
Both d and ω are related to the definition of the
vicinity of an agent. The vicinity of an agent is as-
sumed to have a fan-like shape with a length of d and
angle of ω degrees in the direction in which the agent
is headed. The red fan shape in Fig 5 illustrates the
vicinity (d = 10 and ω = 20) of the red agent on the
upper left in the figure. This definition of vicinity can
be considered to be narrow and lengthy because the
size of the space is only 15 × 15 units. In the evacua-
tion decision model, the herd behavior of an agent is
affected by other agents within his/her vicinity; there-
fore, the vicinity of an agent can be considered as the
field of vision or the range of attention of the agent.
The analysis in section 4 leads to the following hy-
pothesis.
Tunnel Vision Hypothesis. During evacuations, the
attention of evacuees is narrowed to a range of 20
degrees with a relatively long distance.
This fact, i.e., the attention of evacuees focused on
a very narrow and lengthy range in the direction of
travel during an event of a major disaster such as
the Great East Japan Earthquake, may have important
implications for understanding human evacuation be-
haviors. The evacuation decision model is a construc-
tive model and only generates sufficient conditions;
different model assumptions may lead to different re-
sults. For example, the assumption that an agent se-
lects between fleeing and dropping based on the dis-
tance from the exit individually will lead to the func-
tional field of view of an evacuee being independent
of the evacuation decisions; our study does not rule
out the possibility of such a theory. Because, in our
study, random selection does not produce any bias in
the spatial pattern of agents, herd behaviors embed-
ded in the evacuation decision model can be consid-
ered a crucial assumption in deriving the tunnel vision
hypothesis. Although the tunnel vision hypothesis is
merely a sufficient condition, the generation of such a
hypothesis has some significance because collecting
data in real evacuation situations is difficult, much
less the exploration of internal models of evacuees’
perceptions.
6 RELATED WORKS AND
GENERAL DISCUSSION
Mackworth introduced the concept of the functional
field of view (FFOV) as the area around the fixa-
tion point from which information is briefly stored
and read out during a visual task (Mackworth, 1965).
The FFOV narrows to prevent mental overload in
the case of excessive cognitive demands in visual
tasks; Mackworth called this phenomenon tunnel vi-
sion. Stressful, emotional, or unsafe events cause a
narrower FFOV and inhibit the memory of periph-
erals, which is also known as weapon focus effect.
Loftus et al. (1987) showed that memory related to
a weapon and details of the hand holding it is im-
ICAART 2021 - 13th International Conference on Agents and Artificial Intelligence
24

proved at the expense of the memory of the face and
objects in peripheral vision (Loftus et al., 1987). Sim-
ilar results, i.e., emotional arousal improves memory
for central information but undermines memory of
peripheral information, were reported by several re-
searchers; however, the concept of central informa-
tion was somewhat ambiguous (Christianson and Lof-
tus, 1987; Christianson, 1992). Burke et al. (1992)
discriminated central information into episode cen-
trality and spatial centrality and revealed that emo-
tional arousal prevents only the memory of spatially
peripheral information (Burke et al., 1992). Harada
et al. (2020) also reported that both unusualness and
unsafety play a role in impairing the FFOV (Harada
et al., 2020).
The narrowing of the FFOV in everyday lives was
studied within the context of driving. Miura (1986)
measured the FFOV of drivers during driving and
found that the FFOV narrowed as traffic congestion
increased (Miura, 1986). Recarte and Nunes (2003)
investigated the effects of mental workload tasks on
visual-detection and discrimination tests during driv-
ing (Recarte and Nunes, 2003). Mental tasks re-
sulted spatial gaze concentration and visual-detection
impairment by assigning attentional resources to the
mental tasks rather than employing tunnel vision.
These studies reveal that stressful, unusual, and
unsafe situations lead to tunnel vision, i.e., narrowing
of the FFOV; this implies that tunnel vision may oc-
cur under evacuation situations because evacuations
lead to all of these factors. However, studies have
not focused much on tunnel vision under evacua-
tion conditions. The study of human vision during
evacuations has mainly been investigated under two
contexts: identification of evacuation signs (Nilsson
et al., 2009; Galea et al., 2014; Li et al., 2017; Ding
et al., 2020; Bae et al., 2020) and evacuation behav-
iors under limited visibility conditions (Latan
´
e and
Darley, 1968; Nilsson and Johansson, 2009; Li et al.,
2019). Several researchers conducted experiments us-
ing eye-tracking devices to investigate the direction in
which evacuees were looking during evacuations (Li
et al., 2017; Ding et al., 2020; Bae et al., 2020). Al-
though these works do not focus on the FFOV of evac-
uees, the devices may be useful to reveal the FFOV
and tunnel vision effects during evacuations.
Numerous evacuation simulations consider the
field of view of evacuees in their models; yet, ef-
fects of tunnel vision of evacuees during evacuations
have barely been considered seriously. These sim-
ulations employ the cellular automaton-based model
(Yue et al., 2010; Xu and Huang, 2012; Li et al.,
2019) and the social force model (Ma et al., 2017;
Yuan et al., 2017; Zhou et al., 2018). All of these as-
sume the visibility of an agent based on distance; this
implies that the visual field of the agent is a simple
circle. Filippidis et al. (2006) introduced the concept
of visibility catchment area (VCA), which is the phys-
ical visibility range of an evacuation sign (Filippidis
et al., 2006). They also assumed that an agent could
recognize the evacuation sign in the VCA based on
the probability obtained by the relative angle between
the location of the sign and the traveling vector of the
agent. These probabilities were arbitrarily selected
and unchanged during simulations.
Empirical studies on human evacuation behav-
iors through interviews, surveys, or laboratory exper-
iments have limitations owing to the difficulty in ob-
taining objective data because the mental stress and
distress under real evacuations are difficult to be re-
produced. Constructive studies like simulations and
modeling might be beneficial if employed in conjunc-
tion with empirical results; however, the results of
constructive approaches only lead to sufficient con-
ditions. The hypothesis we generated in this study,
which is that the range of attention of evacuees nar-
rows to an angle of 20 degrees in the traveling vec-
tor direction, may have been difficult to be obtained
through empirical approaches.
Studies on tunnel vision and weapon focus effect
reveal that the FFOV narrows under stressful or un-
usual situations. These results are likely to support
our hypothesis because evacuation situations are con-
sidered to be stressful, unusual, and unsafe. Studies
on evacuation behaviors with narrowed visual fields
have not been conducted extensively; thus, the ef-
fect of these behaviors in evacuation situations is un-
known. It will be beneficial to unveil human evacu-
ation behaviors with a narrowed FFOV because this
may alter evacuation plans and designs, which may
lead to reduction in the number of casualties. Our
hypothesis regarding which circumstances of evacua-
tions will narrow the FFOV of evacuees is yet to be
validated. Empirical studies to validate our hypothe-
sis will also be valuable and desirable.
7 CONCLUSION
Through simulations using the evacuation decision
model, unique evacuation behaviors of the distance
from exits affecting the choice between fleeing and
dropping actions have been reproduced. We con-
ducted simulations with the same model but with
more realistic configurations and revealed that unique
evacuation behaviors could be reproduced in our set-
tings for limited parameter ranges. The analysis
showed that two parameters related to the vicinity of
Reproducing Evacuation Behaviors of Evacuees during the Great East Japan Earthquake using the Evacuation Decision Model with
Realistic Settings
25

an agent are significant; the unique behaviors could
be reproduced only for certain values of these param-
eters. Our research leads to the hypothesis that the
FFOV of evacuees is narrowed to an angle of 20
◦
with
a relatively long distance. As this hypothesis may al-
ter the development and design of previously accepted
evacuation protocols, the validation and application of
the hypothesis to the real environment would be desir-
able; however, these are left for future works.
ACKNOWLEDGEMENTS
The author is grateful to Kei Marukawa for his help-
ful comments and suggestions. The author would like
to thank Editage (www.editage.com) for English lan-
guage editing.
REFERENCES
Altshuler, E., Ramos, O., Nu
˜
nez, Y., Ferna
´
ndez, J., Batista-
Leyva, A. J., and Noda, C. (2005). Symmetry
breaking in escaping ants. The American Naturalist,
166(6):643–649.
Bae, Y.-H., Kim, Y.-C., Oh, R.-S., Son, J.-Y., Hong, W.-
H., and Choi, J.-H. (2020). Gaze point in the evacu-
ation drills: Analysis of eye movement at the indoor
wayfinding. Sustainability, 12(2902):1–14.
Burke, A., Heuer, F., and Reisberg, D. (1992). Remem-
bering emotional events. Memory and Cognition,
20:277–290.
Christianson, S.-A. (1992). Emotional stress and eyewitness
memory: A critical review. Psychological Bulletin,
112(3):284–309.
Christianson, S.-A. and Loftus, E. F. (1987). Memory
for traumatic events. Applied Cognitive Psychology,
1:225–239.
Ding, N., Chen, T., and Liu, Y. (2020). Evacuation guidance
design: An experimental study based on eye tracking
devices. Collective Dynamics, 5.
D’Orazio, M., Spalazzi, L., Quagliarini, E., and Bernar-
dini, G. (2014). Agent-based model for earthquake
pedestrians’ evacuation in urban outdoor scenarios:
Behavioural patterns definition and evacuation paths
choice. Safety Science, 62:450 – 465.
Drury, J., Brown, R., Gonz
´
alez, R., and Miranda, D. (2015).
Emergent social identity and observing social support
predict social support provided by survivors in a disas-
ter: Solidarity in the 2010 chile earthquake. European
Journal of Social Psychology, 46(2):209–223.
Filippidis, L., Galea, E., Gwynne, S., and Lawrence, P.
(2006). Representing the influence of signage on evac-
uation behavior within an evacuation model. Journal
of Fire Protection Engineering, 16:37–73.
Galea, R. E., Xie, H., and Lawrence, J. P. (2014). Experi-
mental and survey studies on the effectiveness of dy-
namic signage systems. Fire Safety Science, 11:1129–
1143.
Garcimart
´
ın, A., Zuriguel, I., Pastor, J., Mart
´
ın-G
´
omez,
C., and Parisi, D. (2014). Experimental evidence of
the “faster is slower” effect. Transportation Research
Procedia, 2:760 – 767. The Conference on Pedestrian
and Evacuation Dynamics 2014 (PED 2014), 22-24
October 2014, Delft, The Netherlands.
Gu, Z., Liu, Z., Shiwakoti, N., and Yang, M. (2016). Video-
based analysis of school students’ emergency evacua-
tion behavior in earthquakes. International Journal of
Disaster Risk Reduction, 18:1 – 11.
Haghani, M. (2020a). Empirical methods in pedestrian,
crowd and evacuation dynamics: Part i. experimen-
tal methods and emerging topics. Safety Science,
129:104743.
Haghani, M. (2020b). Empirical methods in pedestrian,
crowd and evacuation dynamics: Part ii. field methods
and controversial topics. Safety Science, 129:104760.
Haghani, M., Sarvi, M., Shahhoseini, Z., and Boltes, M.
(2016). How simple hypothetical-choice experiments
can be utilized to learn humans’ navigational escape
decisions in emergencies. PLOS ONE, 11(11):1–24.
Harada, Y., Mitsudo, H., and Ohyama, J. (2020). The ef-
fect of unusualness on the functional field of view in
unsafe scenes. Visual Cognition, 28:1–13.
Helbing, D., Farkas, I., and Vicsek, T. (2000). Simu-
lating dynamical features of escape panic. Nature,
407(28):487–490.
Ji, Q., Xin, C., Tang, S., and Huang, J. (2017). Symmetry
associated with symmetry break: revisiting ants and
humans escaping from multiple-exit rooms. Physica
A.
Latan
´
e, B. and Darley, J. M. (1968). Group inhibition of
bystander intervention in emergencies. Journal of Per-
sonality and Social Psychology, 10(3):215–221.
Li, X., Guo, F., Kuang, H., Geng, Z., and Fan, Y. (2019). An
extended cost potential field cellular automaton model
for pedestrian evacuation considering the restriction of
visual field. Physica A: Statistical Mechanics and its
Applications, 515:47 – 56.
Li, Y., Zhang, P., and Zhang, H. (2017). Study on the lo-
cation of building evacuation indicators based on eye
tracking. In Proceedings of the 3rd ACM SIGSPA-
TIAL Workshop on Emergency Management Using,
EM-GIS’17, New York, NY, USA. Association for
Computing Machinery.
Loftus, E., Loftus, G., and Messo, J. (1987). Some facts
about ”weapon focus.”. Law and Human Behavior,
11:55.
Lovreglio, R., Fonzone, A., dell’Olio, L., and Ibeas, A.
(2014). The role of herding behaviour in exit choice
during evacuation. Procedia - Social and Behavioral
Sciences, 160:390–399.
Ma, Y., Lee, E. W. M., and Shi, M. (2017). Dual ef-
fects of guide-based guidance on pedestrian evacua-
tion. Physics Letters A, 381(22):1837 – 1844.
Mackworth, N. H. (1965). Visual noise causes tunnel vi-
sion. Psychonomic Science, 3.
Mas, E., Suppasri, A., Imamura, F., and Koshimura, S.
(2012). Agent-based simulation of the 2011 great east
ICAART 2021 - 13th International Conference on Agents and Artificial Intelligence
26

japan earthquake/tsunami evacuation: An integrated
model of tsunami inundation and evacuation. Journal
of Natural Disaster Science, 34(1):41–57.
Miura, T. (1986). Coping with situational demands: A study
of eye movements and peripheral vision performance.
In Gale, A. G., Freeman, M. H., Haslegrave, C. M.,
Smith, P., and Taylor, S. P., editors, Vision in vehicles,
pages 205–216. North holland Press.
Nilsson, D., Frantzich, H., and Saunders, W. (2009). In-
fluencing exit choice in the event of a fire evacuation.
Fire Safety Science, 9:341–352.
Nilsson, D. and Johansson, A. (2009). Social influence
during the initial phase of a fire evacuation—analysis
of evacuation experiments in a cinema theatre. Fire
Safety Journal, 44(1):71 – 79.
Raafat, R. M., Chater, N., and Frith, C. (2009). Herding in
humans. Trends in Cognitive Sciences, 13(10):420–
428.
Recarte, M. and Nunes, L. (2003). Mental workload while
driving: Effects on visual search, discrimination, and
decision making. Journal of experimental psychology.
Applied, 9:119–37.
Saloma, C., Perez, G. J., Tapang, G., Lim, M., and
Palmes-Saloma, C. (2003). Self-organized queuing
and scale-free behavior in real escape panic. PNAS,
100(21):11947–11952.
Schmidt, S. and Galea, E., editors (2013). Behaviour - Se-
curity - Cluture (BeSeCu): Human behaviour in emer-
gencies and disasters: A cross-cultural investigation.
Pabst Science Publishers.
Sieben, A., Schumann, J., and Seyfried, A. (2017). Collec-
tive phenomena in crowds-where pedestrian dynamics
need social psychology. PLoS ONE, 12:1–19.
Tsurushima, A. (2019). Modeling herd behavior caused
by evacuation decision making using response thresh-
old. In Davidsson, P. and Verhagen, H., editors,
Multi-Agent-Based Simulation XIX. MABS2018. Lec-
ture Notes in Computer Science, vol 11463, pages
138–152. Springer.
Tsurushima, A. (2020). Validation of evacuation deci-
sion model: An attempt to reproduce human evac-
uation behaviors during the great east japan earth-
quake. In Proceedings of the 12th International Con-
ference on Agents and Artificial Intelligence - Volume
1: ICAART,, pages 17–27. INSTICC, SciTePress.
Wilensky, U. (1999). NetLogo. Center for Connected
Learning and Computer-Based Modeling, Northwest-
ern University, Evanston, IL.
Xu, Y. and Huang, H.-J. (2012). Simulation of exit choosing
in pedestrian evacuation with consideration of the di-
rection visual field. Physica A: Statistical Mechanics
and its Applications, 391(4):991 – 1000.
Yang, X., Wu, Z., and Li, Y. (2011). Difference be-
tween real-life escape panic and mimic exercises in
simulated situation with implications to the statistical
physics models of emergency evacuation: The 2008
wenchuan earthquake. Physica A: Statistical Mechan-
ics and its Applications, 390(12):2375 – 2380.
Yuan, Z., Jia, H., Zhang, L., and Bian, L. (2017). A social
force evacuation model considering the effect of emer-
gency signs. SIMULATION: Transactions of the So-
ciety for Modeling and Simulation International, page
003754971774135.
Yue, H., Guan, H., Shao, C., and Liu, Y. (2010). Simulation
of pedestrian evacuation with affected visual field and
absence of evacuation signs. In 2010 Sixth Interna-
tional Conference on Natural Computation, volume 8,
pages 4286–4290.
Zhou, M., Dong, H., Liu, J., Yao, X., and Li, Y. (2018).
Modeling of crowd dynamics with emergency signs
via modified social force model*. pages 235–240.
APPENDIX
Table 3 shows the results of the parameter searches
using black-box simulation in descending order of
¯
O.
Searches were conducted 20 times with different ini-
tial points.
Table 3: Results of black-box optimization.
ε δ α d ω ∆r
ˆ
N g
¯
O
0.1 1.2 0.1 10 20 5.0 15 0.4 28.95
0.1 0.7 0.4 10 20 2.0 1 1.5 27.76
0.1 1.1 0.8 8 20 5.0 2 1.4 26.64
0.2 0.6 0.6 9 20 2.5 7 1.4 26.23
0.1 1.0 0.2 10 20 1.5 20 0.2 26.22
0.2 1.9 1.9 10 10 1.5 6 1.3 25.96
0.3 1.8 0.9 6 20 4.5 19 0.3 23.43
1.0 0.5 0.7 10 10 4.5 13 1.6 22.27
0.6 0.6 1.4 7 10 5.0 4 1.9 22.16
0.1 1.2 0.9 7 20 4.0 2 1.1 22.04
0.3 1.9 0.7 6 20 3.0 15 1.1 22.01
0.7 0.3 0.7 10 10 2.5 2 1.4 21.96
0.4 0.7 0.0 6 20 1.5 4 1.0 21.92
0.7 0.5 1.2 3 70 3.5 16 1.0 15.76
1.0 1.7 1.6 3 70 3.0 1 1.4 15.59
0.8 0.6 0.2 3 80 1.0 7 0.4 12.91
0.6 1.6 1.2 3 70 3.5 1 0.5 12.87
0.8 1.8 1.4 3 70 3.0 1 0.1 12.03
0.8 0.2 1.8 4 360 4.0 11 0.4 -5.95
0.4 1.7 0.0 5 330 2.0 10 0.8 -6.88
Reproducing Evacuation Behaviors of Evacuees during the Great East Japan Earthquake using the Evacuation Decision Model with
Realistic Settings
27
