
A Study about Discovery of Critical Food Consumption Patterns
Linked with Lifestyle Diseases for Swiss Population using
Data Mining Methods
Ilona Rahel Mewes
1
, Helena Jenzer
2
and Farshideh Einsele
1
1
Section of Business Information, Bern University of Applied Sciences, Switzerland
2
Hospital of Psychiatry, University of Zurich, Switzerland
Keywords: Data Mining, Association Analysis, Diet & Chronical Diseases, Health Informatics.
Abstract: Background: This article demonstrates that using data mining methods such as association analysis on an
integrated Swiss database derived from a Swiss national dietary survey (menuCH) and Swiss demographical
and health data is a powerful way to determine whether a specific population subgroup is at particular risk for
developing a lifestyle disease based on its food consumption patterns. Objective: The objective of the study
was to use an integrated database of dietary and health data from a large group of Swiss population to discover
critical food consumption patterns linked with lifestyle diseases known to be strongly tied with food con-
sumption. Design: Food consumption databases from a Swiss national survey menuCH were gathered along
with corresponding large survey of demographics and health data from Swiss population conducted by Swiss
Federal Office of Public Health (FOPH). These databases were integrated and reported in a previous study as
a single integrated database. A data mining method such as A-priori association analysis was applied to this
integrated database. Results: Association mining analysis was used to incorporate rules about food consump-
tion and lifestyle diseases. A set of promising preliminary rules and their corresponding interpretation was
generated, which is reported in this paper. As an example, the found rules of the sample show that smoking
is relatively irrelevant to the high blood pressure and Diabetes, whereas consuming vegetables at regular basis
reduces the risk of high Cholesterol. Conclusions: Association rule mining was successfully used to describe
and predict rules linking food consumption patterns with lifestyle diseases. The gained association rules reveal
that the appearance of the mutually independent nutritional characteristics in the rules are equally distributed.
Furthermore, most of the sample show no chronical diseases as they smoke little and exercise regularly, which
can be interpreted that sport is a strong preventive factor for chronical/lifestyle diseases. Nevertheless, a small
percentage of the sample shows chronic illnesses due to unhealthy eating. Further research should consider
the weighting of chronic diseases’ characteristics for them not to be pruned out early by data mining compu-
tation.
1 INTRODUCTION
Lifestyle diseases are diseases that increase in fre-
quency as countries become more industrialized and
people get more aged. Lifestyle diseases include obe-
sity, hypertension (blood pressure), heart disease,
type 2 diabetes, cancer, mental disorders and many
others. They differ from the infectious diseases origi-
nated from malnutrition, also called communicable
diseases (CD) due to their contagious, dispersive na-
ture. Lifestyle diseases are therefore among the so-
called NC (non-communicable diseases) diseases.
According to World Health Organization (WHO), the
growing epidemic of chronic diseases afflicting both
developed and developing countries are related to di-
etary and lifestyle changes (WHO, 2003).
Several researches studied the relationship be-
tween nutritional habits and lifestyle diseases aka
chronic diseases. A. Fardet and Y. Boirie have aggre-
gated 304 pooled/meta-analyses and systematic re-
views in order to obtain a qualitative overview of the
associations between 17 food and beverage groups
and the risk of diet-related chronic disease. The re-
view of these authors confirmed that plant food
groups were more protective than animal food groups
against diet-related chronic diseases. Their results
show that overweight, obesity, type 2 diabetes, cancer
and cardiovascular diseases accounted for 289 of the
pooled/meta-analyses and systematic reviews (Fardet
30
Mewes, I., Jenzer, H. and Einsele, F.
A Study about Discovery of Critical Food Consumption Patterns Linked with Lifestyle Diseases for Swiss Population using Data Mining Methods.
DOI: 10.5220/0010160200300038
In Proceedings of the 14th International Joint Conference on Biomedical Engineering Systems and Technologies (BIOSTEC 2021) - Volume 5: HEALTHINF, pages 30-38
ISBN: 978-989-758-490-9
Copyright
c
2021 by SCITEPRESS – Science and Technology Publications, Lda. All rights reserved

and Boirie, 2014). Further, S. Fardet et al. conducted
additional pooled analyses and meta-analyses of co-
hort studies and randomized controlled trials that
linked fruit consumption with the risk of chronic dis-
ease and metabolic deregulation. Their results show
that the degree of processing influences the health ef-
fects of fruit-based products. Fresh and dried fruits
appeared to have a neutral or protective effect on
health, 100% fruit juices had intermediary effects,
and high consumption of canned fruit and sweetened
fruit juice was positively associated with the risk of
all-cause mortality and type 2 diabetes, respectively
(Fardet , 2019). S. Schneider and al. conducted a mini
Nutritional Assessment as a promising score for eval-
uating malnutrition in the elderly, since nutrition in-
tervention shortens the length of stay by diminishing
the rate of complication and to identify malnourished
patients and those who are at nutritional risk in order
to treat and prevent malnutrition by chronic diseases
by elderly (Schneider and Hebuterne ,2000).
Machine Learning and Data Mining methodolo-
gies for chronic diseases prediction and prevention in
relationship with nutritional habits have been ex-
plored by different researchers Internationally. S. Lee
et al conducted a study using stepwise logistic regres-
sion (SLR) analysis, decision tree, random forest, and
support vector machine as an alternative and comple-
ment to the traditional statistical approaches to iden-
tify the factors that affect the health-related quality of
life (HRQoL) of the elderly with chronic diseases and
to subsequently develop from such factors a predic-
tion model (Lee, 2014)]. D. Qudsi and al. report in
(Qudsi and Kartiwi, 2017) from a study that aims to
identify the potential benefits that data mining can
bring to the health sector, using Indonesian Health In-
surance company data as case study. Decision tree as
a classification data mining method, was used to gen-
erate the prediction model by visualizing the tree to
perform predictive analysis of chronic diseases. Z.
Lei et al report in (Lei, 2018) of studying the relation-
ship between nutritional ingredients and diseases
such as diabetes, hypertension and heart disease by
using data mining methods. They have identified the
first two or three nutritional ingredients in food that
can benefit the rehabilitation of those diseases. R.
McCabe et al. report in (McCabe, 2008) of creating a
simulation test environment using characteristic mod-
els of physician decision strategies and simulated
populations of patients with type 2 diabetes, they state
of employing a specific data mining technology that
predicts encounter-specific errors of omission in rep-
resentative databases of simulated physician-patient
encounters, and test the predictive technology in an
administrative database of real physician-patient en-
counter data. D.W. Haslam and W.P. James report in
(Haslam, 2005) of an investigation in a population -
based sample of 1140 children performed in order to
derive dietary patterns related to children's obesity
status. Their findings reveal that Rules derived
through a data mining approach revealed the detri-
mental influence of the increased consumption of
fried food, delicatessen meat, sweets, junk food and
soft drinks. K. Lange et al. state in (Lange, 2016) that
Big data studies may ultimately lead to personalized
genotype-based nutrition which could permit the pre-
vention of diet-related diseases and improve medical
therapy. A. Hearty and M. Gibney evaluate the usa-
bility of supervised data mining methods as ANNs
and decision trees to predict an aspect of dietary qual-
ity an aspect of dietary quality based on dietary intake
with a food-based coding system and a novel meal-
based coding system (Hearty, 2008). A. von Reusten
et al. used data from 23 531 participants of the EPIC-
Potsdam study to analyze the associations between 45
single food groups and risk of major chronic diseases,
namely, cardiovascular diseases (CVD), type 2 diabe-
tes and cancer using multivariable-adjusted Cox re-
gression. Their results show that higher intakes of
low-fat dairy, butter, red meat and sauce were associ-
ated with higher risks of chronic diseases (von Ru-
esten, 2013). E. Yu et al. demonstrate in (Yu, 2020)
the usability of supervised data mining methods to ex-
tract the food groups related to bladder cancer. Their
results show that beverages (non-milk); grains and
grain products; vegetables and vegetable products;
fats, oils and their products; meats and meat products
were associated with bladder cancer risk.
To gain understanding about the impact of using
data mining techniques for the analysis of lifestyle
diseases that can be influenced by nutrition, we con-
ducted a preliminary study on this matter (Einsele,
2015). In this preliminary previous study, we used a
big database gained from a grocery store chain over a
certain period along with associated health data of the
same region. Association rule mining was success-
fully used to describe and predict rules linking food
consumption patterns with lifestyle diseases. In the
current study, however, we use two real world big
databases, one from a national Swiss dietary survey
and the other from the national Swiss health survey
including demographical information and use a simi-
lar data mining approach as described in (Einsele,
2015) to gain promising association rules that show
the link between Swiss nutritional habits and chroni-
cal diseases.
A Study about Discovery of Critical Food Consumption Patterns Linked with Lifestyle Diseases for Swiss Population using Data Mining
Methods
31

2 DATABASE SELECTION
The data comes from the national surveys menuCH
and the health survey that was carried out in Switzer-
land.
The national food survey menuCH (BLV, Federal
Office for Food Safety and Veterinary 2020) was car-
ried out for the first time from January 2014 to Feb-
ruary 2015. Over 2000 people living in Switzerland
were asked about their eating habits and food con-
sumption. The data resulting from the survey is the
first representative, national nutritional survey data
available in Switzerland from BLV.
The second database results from the Swiss health
survey. This survey is being carried out by the federal
government every five years since 1992. In this work
the health data from 2012 is used. The data contains
data sets from over 21,000 interviewed people. This
data has already been pre-cleaned, attributes have
been partially selected from the database and the data
has been already transformed as reported in (Mewes
and Einsele, 2020).
3 DATA PREPARATION FOR
DATA MINING PROCESS
Preparatory steps had to be carried out for the data
mining processes. The Swiss data were cleaned in ad-
vance and a selection of the important attributes (table
columns) of the health and nutritional databases was
made.
In a first data selection, the attributes of the health
and nutritional data relevant to the question were se-
lected. A further reduction of the data was necessary
because the selected attributes were still too extensive
in their characteristics and the characteristics were in
a structure that did not make sense for a first data min-
ing attempt.
Our multidisciplinary team consisted of a special-
ist in health and nutrition, that enabled us to appropri-
ately assess, select and summarize the characteristics
of the attributes into categories. The aim of the further
categorization was to create several 4-8 occurrences
for each category. This was followed by the transfor-
mation of the data according to the corresponding cat-
egorization and the creation of a new relational, inte-
grated database (see Fig. 1).
4 CATEGORIZATION OF SWISS
HEALTH DATA
Categories were created on blood pressure, Choles-
terol, diabetes and alcohol consumption. Blood pres-
sure was reduced into 6 categories. The Cholesterol
data was reduced to 4 categories. The diabetes data
was reduced to 4 categories and finally alcohol con-
sumption data was reduced to 4 categories. As an ex-
ample, the alcohol consumption data was reduced as
follows:
Daily alcohol consumption up to 18 grams,
Daily alcohol consumption > 18-23 grams,
Daily alcohol consumption> 23-28 grams,
Daily alcohol consumption> 28 grams.
5 CREATION OF INTEGRATED,
RELATIONAL DATABASE
After defining the categories for each chronical dis-
ease and menuCH attributes, the data was trans-
formed according to the corresponding categorization
to an integrated, relational database. Five common
demographical attributes available in both databases
were used, such as gender, age group, household,
marital status and language to link the two databases
into an integrated relational database. Fig. 1 shows
the resulted new integrated database.
6 ASSOCIATION ANALYSIS
WITH THE A-PRIORI
ALGORITHM
The basis for the implementation of the A-priori al-
gorithm is the data with discrete sizes, which were put
in Excel tables. Each row entry in the table is a trans-
action. Several items were summarized per transac-
tion. The sum of all transactions was the population.
The aim of the association analysis is to find rules of
the form "if feature A occurs, then feature B occurs
with the probability of the confidence level" (A-> B).
The calculation parameters support, confidence and
lift were used to evaluate the rules. The algorithm
continues until no item set fulfils the minimum sup-
port (Agrawal and Srikant, 1994). Item sets for rule
HEALTHINF 2021 - 14th International Conference on Health Informatics
32
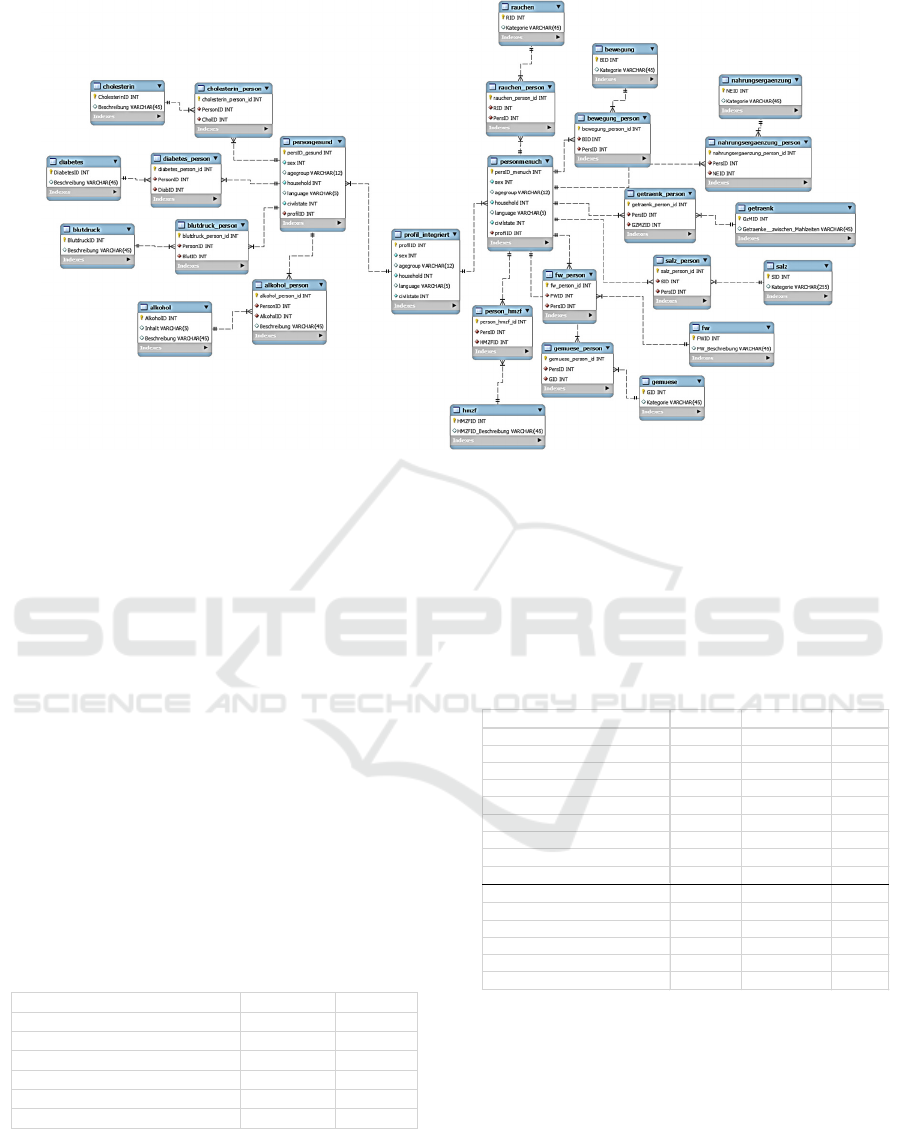
Figure 1: The integrated Swiss Nutrition-Health Database.
formation were selected from theses 9 items. The A-
Priori algorithm was then run a second time without
the healthy chronic disease values. The item sets with
the highest support and confidence value were se-
lected for rule formation. In this study A-Priori algo-
rithm was applied to find rules for a set of 9 items as
follows: 8 items from menuCH database and 1 item
was the categorized chronical diseases from Swiss
health database as described previously (see sec. cat-
egorization of health and menuCH data)
6.1 Exemplary Presentation of the Data
Mining Process for a Chronic
Disease: Blood Pressure
6.1.1 Step 1
In the first iteration of the a priori algorithm, the sup-
ports of all 1-Itemsets were calculated.
Table 1: Blood Pressure, 1-Itemset.
6.1.2 Step 2
In the second iteration, all 2-item combinations were
formed with the item blood pressure and the support
was calculated for all 2-item combinations. In total,
in the second iteration there were 8 times 2-item sets
for which the support was calculated. Here, a mini-
mum support of 0.01 was specified. All 2 items of the
item set blood pressure and movement with a mini-
mum support 0.01 were taken into the next iteration
(8 item sets).
Table 2: Blood Pressure, 2-Itemset with minsup-Line.
6.1.3 Step 3
The calculation of all 2-Itemsets for the further itera-
tions would have been too extensive for the scope of
this work. The item food supplements has been added
to the 2-Itemset blood pressure and exercise.
For the 3-Itemset, the supports for all different
item sets were calculated All item sets with a support
above 0.01 were included in the fourth iteration (12
item sets).
Blutdruck Transaktionen Support
nichtmedizinischbeurteiltnormal 226920 0.5641
medizinischbeurteiltnormal 114914 0.2857
nichtmedizinischbeurteiltzutief 40130 0.0998
medizinischbeurteiltzuhoch 15955 0.0397
medizinischbeurteiltzutief 2524 0.0063
nichtmedizinischbeurteiltzuhoch 1844 0.0046
Blutdruck Bewegung Transaktionen Support
nichtmedizinischbeurteiltnormal Regelmässi
g
206885 0.4498
medizinischbeurteiltnormal Regelmässi
g
105754 0.2299
nichtmedizinischbeurteiltzutief Regelmässi
g
37281 0.0811
medizinischbeurteiltzuhoch Regelmässi
g
14523 0.0316
medizinischbeurteiltzutief Regelmässi
g
2334 0.0051
nichtmedizinischbeurteiltnormal Unregelmäs
s
24155 0.0525
medizinischbeurteiltnormal Unregelmäs
s
10759 0.0234
nichtmedizinischbeurteiltzutief Unregelmäs
s
3869 0.0084
medizinischbeurteiltzuhoch Unregelmäs
s
1673 0.0036
medizinischbeurteiltzutief Unregelmäs
s
218 0.0005
nichtmedizinischbeurteiltnormal Selten–nie
(
3335 0.0073
medizinischbeurteiltnormal Selten–nie
(
2130 0.0046
nichtmedizinischbeurteiltzutief Selten–nie
(
333 0.0007
medizinischbeurteiltzuhoch Selten–nie
(
259 0.0006
medizinischbeurteiltzutief Selten–nie
(
48 0.0001
A Study about Discovery of Critical Food Consumption Patterns Linked with Lifestyle Diseases for Swiss Population using Data Mining
Methods
33

Table 3: Blood Pressure, 3-Itemset with minsup Line.
6.1.4 Further Steps
The item salt was added to the 3-Itemsets blood pres-
sure, exercise and food supplements. Support was cal-
culated for all item combinations of the 4-Itemsets. In
this iteration, all item sets with a minimum support of
0.005 were taken into the next iteration.
In the next iteration, the item smoking was added.
In the iteration with the 5-Itemsets, the minimum sup-
port of 0.005 was used again.
The drinks item was added to the 5-Itemsets. All
6-Itemsets with a support above 0.005 were included
in the 7th iteration.
The item warm meals was added to the 6-Itemsets.
The main meals item has been added to the 7-Itemsets
with a minimum support of 0.0025.
No minimum support was specified for the 8-
Itemsets because a total of 60 times 8-Itemsets still
had support above 0. The item vegetables has been
added to the 8-Itemsets. The support, the confidence
value and the lift were calculated for the 9-Itemsets.
6.1.5 Final Step: Building Association Rules
Only item sets with a blood pressure value “medically
assessed” were used. From these item sets, the item
sets with the highest support and confidence value
were selected in order to form rules (see Fig. 5).
The a- priori algorithm was carried out a second
time without the healthy blood pressure values. The
minimum support was set in this implementation in
all iterations at 0.00025. After calculating the support
and confidence and lift values for the 9-Itemsets. Item
sets with the highest support and confidence value
were selected for rule formation. Hence 6 rules re-
sulted.
7 RESULTS OF ASSOCIATION
MINING USING A-PRIORI
ALGORITHM
After completion of the algorithm rules were found
that show the relationship between nutrition and
chronic diseases. We report in the following gained
rules for blood pressure, Cholesterol and Diabetes.
7.1 Blood Pressure
Rule 1: 0.52% of people in the sample have a medi-
cally assessed normal blood pressure and have the
following characteristics: They do not take any die-
tary supplements. They smoked earlier; they eat
warm meals irregularly (4-7 times a week).
Rule 2: 0.16% of the people in the sample have a
medically assessed normal blood pressure and have
the following characteristics: They do not take any di-
etary supplements. They have never smoked; they
consume hot meals regularly.
Rule 3: 0.12% of the people in the sample have a
medically assessed normal blood pressure and have
the following characteristics: Dietary supplements,
they have never smoked, they consume hot meals reg-
ularly. 4% of the sample has a medically judged high
blood pressure.
Rule 4: 0.06% of the people in the sample have a
medically assessed high blood pressure and have the
following characteristics: They do not take any die-
tary supplements. They have never smoked; they con-
sume hot meals regularly.
Rule 5: 0.06% of the people in the sample have a
medically assessed high blood pressure and have the
following characteristics: They do not take any die-
tary supplements. They used to smoke; they consume
warm meals irregularly.
Rule 6: 0.05% of the people in the sample have a
medically assessed high blood pressure and have the
following characteristics: They are taking food sup-
plements. They have never smoked; they consume
hot meals regularly.
Table 4: Blood Pressure, 9-Itemset.
Blutdruck Beweg
u
Nahrungsergänzungs
m
Transaktionen Support
nichtmedizinis
c
Regel
m
NimmtkeineNahrungs 110005 0.2734
nichtmedizinis
c
Regel
m
NimmtNahrungs ergän
z
90692 0.2254
medizinischbe
u
Regel
m
NimmtkeineNahrungs 55890 0.1389
medizinischbe
u
Regel
m
NimmtNahrungs ergän
z
46556 0.1157
nichtmedizinis
c
Regel
m
NimmtNahrungs ergän
z
18145 0.0451
nichtmedizinis
c
Regel
m
NimmtkeineNahrungs 17958 0.0446
nichtmedizinis
c
Unrege NimmtkeineNahrungs 14385 0.0358
nichtmedizinis
c
Unrege NimmtNahrungsergän
z
9124 0.0227
medizinischbe
u
Regel
m
NimmtkeineNahrungs 7765 0.0193
medizinischbe
u
Regel
m
NimmtNahrungs ergän
z
6324 0.0157
medizinischbe
u
Unrege NimmtkeineNahrungs 6048 0.0150
medizinischbe
u
Unrege NimmtNahrungsergän
z
4390 0.0109
nichtmedizinis
c
Unrege NimmtkeineNahrungs 1935 0.0048
nichtmedizinis
c
Unrege NimmtNahrungsergän
z
1780 0.0044
medizinischbe
u
Regel
m
NimmtkeineNahrungs 1239 0.0031
medizinischbe
u
Regel
m
NimmtNahrungs ergän
z
1026 0.0026
Blutdruck Bewegung Nahrungsergänzungsmittel Salz Rauchen Getränke FrequenzwarmeMahlzeiten Hauptmahlzeiten Gemüse Transaktion
e
Support Konfiden
z
Lift
medizinisc Regelmässi
g
NimmtkeineNahrungsergän
z
Salzmi
t
Früher Wasser,Kaf
f
warmeMahlzeitunregelmässigFSregel./MEregel.
/
Gemüse
r
2047.00 0.0052 0.0178 1.26
medizinisc Regelmässi
g
NimmtkeineNahrungsergän
z
Salzmi
t
Nie Wasser,Kaf
f
warmeMahlzeitregelmässig(8
‐
FSregel./MEregel.
/
Gemüse
r
1945.00 0.0050 0.0169 1.29
medizinisc Regelmässi
g
NimmtNahrungsergänzungs
m
Salzmi
t
Nie Wasser,Kaf
f
warmeMahlzeitregelmässig(8
‐
FSregel./MEregel.
/
Gemüse
r
1422.00 0.0036 0.0124 0.95
HEALTHINF 2021 - 14th International Conference on Health Informatics
34

7.2 Cholesterol
Rule 1: 1.4% of the people in the sample have a med-
ically assessed normal cholesterol value and have the
following characteristics: They do not take any food
supplements. They smoked earlier; they eat warm
meals irregularly (4-7 times a week). They process
vegetables regularly (more than twice a week).
Rule 2: 1.3% of the sample have a medically assessed
normal cholesterol value and have the following char-
acteristics: They do not take any dietary supplements.
They have never smoked; they consume hot meals
regularly (4-7 times a week). They process vegetables
regularly (more than twice a week).
Rule 3: 0.4% of the people in the sample have a med-
ically assessed normal cholesterol value and have the
following characteristics: They do not take any food
supplements. They used to smoke, they rarely or
rarely consume hot meals. They never or rarely pro-
cess vegetables.
Rule 4: 0.1% of the people in the sample have a med-
ically assessed normal cholesterol value and have the
following characteristics: They do not take any food
supplements. They used to smoke, they rarely or rarely
consume hot meals. They process vegetables regularly.
Rule 5: 0.07% of the people in the sample have a
medically assessed high cholesterol value and have
the following characteristics: They do not take any
food supplements. They used to smoke; they consume
warm meals irregularly. Process vegetables regularly.
Rule 6: 0.05% of the people in the sample have a
medically judged high cholesterol value and have the
following characteristics: They do not take any food
supplements. They have never smoked; they consume
hot meals regularly. Vegetables process regularly.
Rule 7: 0.04% of the people in the sample have a
medically judged high cholesterol value and have the
following characteristics: They take dietary supple-
ments. They have never smoked; they consume hot
meals regularly. Process vegetables regularly.
7.3 Diabetes
Rule 1: 0.017% of people in the sample have a med-
ical diagnosis of diabetes and have the following
characteristics: They do not take any dietary supple-
ments. They have never smoked; they consume hot
meals regularly.
Rule 2: 0.015% of the people in the sample have a
medical diagnosis of diabetes and have the following
characteristics: They do not take any dietary supple-
ments. They used to smoke; they consume warm
meals irregularly.
Rule 3: 0.4% of the people in the sample have a med-
ical diagnosis of diabetes and have the following
characteristics: They are taking food supplements.
They have never smoked; they consume hot meals reg-
ularly.
8 KNOWLEDGE
INTERPRETATION
8.1 Blood Pressure
Hypertension is a disease of the organ axis of the heart
- vessels - kidneys or lungs. The heart no longer de-
livers enough cardiac output, the vessels have lost
their elasticity and the kidneys or lungs are inade-
quate, which creates a counterpressure and, in the
case of the kidney, the pressing pressure is insuffi-
cient for the excretion of metabolic end products. As
with a powerless electric motor, which is also sup-
posed to supply a blocked lawn sprinkler with water,
but is overheated and destroyed by resistance, the
heart works against resistance. It tries to generate
more strength with volume increases, the heart wall
becomes thicker and thicker until the strength is no
longer enough, and the disease is decompensated. The
system becomes insufficient. There is a high risk of
stroke (brain or coronary arteries). In the study, hy-
pertension and normal pressure were associated with
characteristics (dietary supplements, smoking, num-
ber of hot meals).
Rule 1: Energy production is sufficient to maintain
metabolic performance, i.e. Vitamins and trace ele-
ments and the oxygen supply are sufficient. Normo-
tonic do not need food supplements. Your cardiovas-
cular performance is sufficient, even if you smoke
earlier. Nicotine has not yet noticeably damaged the
lungs, or the lung tissue is regenerated. The food in-
take in this group is enough for maintaining health.
Cholesterol and fats are obviously not absorbed ex-
cessively, so that vascular damage and obviously obe-
sity are avoided.
Rule 2: The same situation as in rule 1 as normotics.
The lung tissue is even healthier in this group.
Rule 3: The same situation as in Rules 1 and 2,
whereby the dietary supplement intake is not known.
This supply is guaranteed by a balanced diet.
Rule 4: Hypertensive patients with an impairment of
the functional axis cardiovascular kidney. Probably
older people with this profile. Here, food supplements
could improve energy production (ATP). The lungs
A Study about Discovery of Critical Food Consumption Patterns Linked with Lifestyle Diseases for Swiss Population using Data Mining
Methods
35

are probably intact, so the kidneys have tended to be-
come insufficient, but the obesity should be reduced.
Rule 5: Hypertensive patients with an impairment of
the cardiovascular-kidney functional axis. Probably
older people with this profile. Here, food supplements
could improve energy production (ATP). The lung
function could be impaired by previous smoking, so
the pulmonary circulation could also be at high pres-
sure. Obesity should be reduced.
Rule 6: Hypertensive patients with an impairment of
the cardiovascular-kidney functional axis. Probably
older people with this profile. Here, food supplements
could improve energy production (ATP). The lung
function is probably intact (no pulmonary high pres-
sure). Obesity should be reduced.
8.2 Diabetes
There is an acquired partial loss of function of the in-
sulin-producing cells in the pancreas. Here it is possi-
ble to stimulate insulin secretion by oral means. These
then increase the glucose uptake in muscle cells and
liver cells and thus the energy production. Today
there is a new generation of antidiabetic drugs against
type 2 diabetes. They no longer influence the cells,
but act like incretin, a hormone that already plays a
role in the absorption of food from the intestine into
the circulation. The whole insulin cascade is then trig-
gered in a finely dosed manner, which is much gentler
for the remaining function of the pancreas than with
the old oral antidiabetic agents. Since glucose is a fuel
for the cells (and as such needs oxygen for oxidation),
it is very important in diabetes to get a handle on car-
bohydrate intake (and therefore glucose). There are
foods that slowly release glucose from the polysac-
charides, e.g. Rice, which is so slowly absorbed into
the circulation that the insulin release may still be suf-
ficient, or those that are quickly broken down into
glucose, e.g. White bread, which overwhelms insulin
production and release. The glycemic index of carbo-
hydrates indicates how quickly this conversion of car-
bohydrate to glucose takes place. It is not clear from
the information how the food is composed and how
much the study participants ingest. Only the disease
with characteristics was associated, not the healthy
status. It can therefore be expected that those traits re-
sult in a rule that are connected to the carbohydrate /
glucose metabolism.
Rule 1: In the case of type 1 diabetics, a balanced diet
can be expected, in the case of type 2 diabetics an in-
creased food intake. The type 1 diabetics, which are
obviously at issue here, consciously eat a balanced
supply of glucose, do not need any supplements and
do not smoke. If it were type 2 diabetics, they would
have ingested too much food and developed excess
weight in the past, which results in insidious type 2
diabetes with the dreaded complication "metabolic
syndrome". These type 2 diabetics are not always
conscious about their diet. Food supplements (vita-
mins, trace elements) would only have added value if
they were malnourished. This group shows no short-
age of micronutrients.
Rule 2: Compared to glucose intake, smoking has lit-
tle relevance for the measurement metabolism of glu-
cose. The prognosis can only worsen in the case of
consuming diseases. This group feeds irregularly,
therefore less consciously and accepts the dangers of
smoking. It could be type 2 diabetic.
Rule 3: Like rule 1, but with micronutrient intake,
perhaps diabetics with a less stable metabolism, more
frequent tiredness and weakness, which can be influ-
enced favourably with micronutrients.
8.3 Cholesterol
Hypercholesterolemia is a disease of the fat metabo-
lism; cholesterol can be biosynthesized purely inter-
nally. A chain is created from unused glucose, or its
degradation product acetyl-CoA, which ends with
cholesterol. Therapeutically, this synthetic route can
be interrupted with statins. The second possibility of
hypercholesterolemia is based on increased external
intake (high-fat diet, especially animal fats). In this
group, associations of sick and non-sick people with
the same characteristics are examined.
Rule 1: This group with a normal cholesterol level
eats a lot of vegetables, which also contains the nec-
essary micronutrients. If bread or other carbohydrate
are not consumed excessively, endogenous choles-
terol production remains low. The previous smoking
apparently did not cause any vascular changes, which
combined with hypercholesterolemia would worsen.
Rule 2: This group with normal cholesterol eats like
the group in rule 1 but does not smoke. Vascular walls
altered by atherosclerosis due to nicotine consump-
tion can be excluded. There is no cardiovascular risk.
Rule 3: This group with a normal cholesterol level is
not very conscious and, in combination with smoking,
has an increased risk of atherosclerosis, especially if
a lot of bread is eaten with butter instead of warm
meals.
Rule 4: This group with a normal cholesterol level
eats similarly to the group in Rule 3. The risk of hy-
percholesterolemia is reduced here by regular vegeta-
ble intake.
Rule 5: This group suffers from hypercholesterole-
mia. The profile is like the group in rule 4. However,
HEALTHINF 2021 - 14th International Conference on Health Informatics
36

the vegetable consumption is insufficient or has
started too late or cholesterol arises from too much
carbohydrate intake.
Rule 6: This group suffers from hypercholesterole-
mia. The profile is like the group in rule 5. The intake
of regular hot meals with a (hopefully) balanced com-
position and the non-smoking behaviour significantly
reduce the risk of atherosclerosis. The vessel walls
should be less changed here.
Rule 7: Like group in Rule 6, but with nutritional sup-
plements. These can be helpful if cholesterol espe-
cially emerged from internal biosynthesis. This form
would be amenable to therapy with statins. If you eat
too greasy, the risk can also be improved by adapting
the meal composition
9 CONCLUSION AND FUTURE
WORK
In this paper, we apply a data mining method such as
A-priori algorithm to a big integrated Swiss nutrition
and health database to gain rules that show the effects
of nutritional habits on some chronical diseases such
as high blood pressure, Diabetes and high Choles-
terol.
The interpretation of the derived rules reveals in-
teresting aspects about the selected Swiss population
subgroup. In general, the Swiss population nutritional
habits are reasonable in relation to chronical diseases.
The results show that the derived rules are only rele-
vant for a very small proportion of the sample.
Furthermore, the rules show that the appearance
of the mutually independent nutritional characteris-
tics in the various forms occurs in the rules equally
distributed which can be interpreted that most of the
sample population follow the state-of the art nutri-
tional standards, smoke little and do physical activi-
ties regularly.
Nevertheless, a small percentage of the sample
show chronic illnesses due to unhealthy eating. In
further research, the focus should be on the targeted
selection of the characteristics, their categorization
and the consideration of the characteristics in context,
as this is crucial for the association analysis and the
later interpretation of the rules. The weighting of
characteristics should also be considered in further
studies so that characteristics with a small total pro-
portion in the population do not drop out early due to
the minimum support criterion by A-priori algorithm.
REFERENCES
WHO, 2003. Diet, Nutrition, and the Prevention of Chronic
Diseases. Report of a Joint WHO/FAO Expert Consul-
tation. In World Health Organization aper templates.
Fardet, A., Boirie, Y. 2008. Associations between food and
beverage groups and major diet-related chronic dis-
eases: an exhaustive review of pooled/meta-analyses
and systematic reviews, In Nutr Rev. 2014 Dec;
72(12):741-62. doi: 10.1111/nure.12153
Fardet, A. Richonnet, C., Mazur, A., 2019, Association be-
tween consumption of fruit or processed fruit and
chronic diseases and their risk factors: a systematic re-
view of meta-analyses, Nutrition Reviews. In Nutrition
Reviews, Volume 77, Issue 6, Pages 376-387.
Schneider, S., Heuterne, X., 2000, Moore, R., Lopes, J.,
1999. Prediction Model for Health-Related Quality of
Life of Elderly with Chronic Diseases using Machine
Learning Techniques. In Healthc Inform Res. 2014
Apr;20(2):125-134.
Kee, S. K., Son, Y. J, Kim H,,G., Lee J. Il., Cho, H.S., Lee,
S., 2014, Associations between food and beverage
groups and major diet-related chronic diseases: an ex-
haustive review of pooled/meta-analyses and system-
atic reviews, In Nutr Rev. 2014 Dec; 72(12):741-62.
doi: 10.1111/nure.12153
Qudsi, D., Kartiwi, M., Saleh, N.B., 2017, Predictive data
mining of chronic diseases using decision tree: A case
study of health insurance company in Indonesia. In In-
ternational Journal of Applied Engineering Research
12(7):1334-1339
Lei Z., Yang, S., Liu, H., Aslam, S., Liu, J., Bugingo, E.,
Zhang, D., 2018, Mining of Nutritional Ingredients in
Food for Disease Analysis, In IEEE Access 6(1):52766-
52778
McCabe, R.M, Adomavicius, G., Johnson P.E:, Rund, E.,
Rush, A., Sperl-Hillen, A., , 2008, Using Data Mining
to Predict Errors in Chronic Disease Care, Advances in
Patient Safety: In New Directions and Alternative Ap-
proaches In Vol. 3: Performance and Tools.
Haslam, D.W., James, W.P.T., Obesity, In The Lancet, Vol-
ume 366, Issue 9492, Pages 1197-1209
Lange, K.W., James W.P.T., Makulska-Gertruda E., Naka-
mura Y., Reissmann, A., 2008, A. Sperl-Hillen, Using
Data Mining to Predict Errors in Chronic Disease Care,
Advances in Patient Safety. In New Directions and Al-
ternative Approaches (Vol. 3: Performance and Tools)
Hearty, A.P., Gibney, M.J., 2008, , A. Richonnet, C., Ma-
zur, A., Analysis of meal patterns with the use of super-
vised data mining techniques—artificial neural net-
works and decision trees, In The American Journal of
Clinical Nutrition, Volume 88, Issue 6, Pages 1632–
1642.
Von Ruesten, A., Feller, S., Bergmann, N.M., Boeing, H.,
2013, S., Diet and risk of chronic diseases: results from
the first 8 years of follow-up in the EPIC-Potsdam
study, In European Journal of Clinical Nutrition vol-
ume 67, pages412–419.
Yu E. Y. W., Wesselius A., Sinhart C., Wolk A., 2020, A
data mining approach to investigate food groups related
A Study about Discovery of Critical Food Consumption Patterns Linked with Lifestyle Diseases for Swiss Population using Data Mining
Methods
37

to incidence of bladder cancer, In the Bladder cancer
Epidemiology and Nutritional Determinants Interna-
tional Study, Cambridge University Press
Einsele, F., Sadeghi, L., Ingold, R., Jenzer, H., 2015, A
Study about Discovery of Critical Food Consumption
Patterns Linked with Lifestyle Diseases using Data
Mining Methods, In HealthInf, BIOSTEC - Interna-
tional Joint Conference on Biomedical Engineering
Systems and Technologies, Lisbon.
Mewes I., Jenzer H., Einsele, F., 2020, building an inte-
grated relational database from Swiss Nutrition’s
(menuCH) and Swiss Health datasets for Data Mining
Purposes, submitted and accepted In ICAFNH 2021: In-
ternational Conf. on Agrilife, Food, Nutrition and Health
Agrawal R., Srikant, R., 1994, Fast algorithms for mining
association rules. In IBM Research Report RJ9839,
IBM Almaden Research Center, San Jose, California
HEALTHINF 2021 - 14th International Conference on Health Informatics
38
