
Exploring Fractal Dimension Analysis as a Technique to Study the
Role of Intensity of Facial Expression and Viewing Angle
Braj Bhushan
1
and Prabhat Munshi
2
1
Department of Humanities & Social Sciences, Indian Institute of Technology Kanpur, India
2
Nuclear Engineering and Technology, Indian Institute of Technology Kanpur, India
Keywords: Facial Expressions, Geometric Feature Extraction, Fractal Dimension, Root Mean Square Pixel Difference,
Self-similarity.
Abstract: Fractal dimension analysis of the images of facial expressions has been reported earlier by Takehara and
colleagues We have performed a similar exercise for two Indian databases, the Indian dataset of basic
emotions and the Indian Affective Picture Database, to examine the relationship between the geometric
properties of the facial expressions vis-à-vis the intensity of expressions and the viewing angle. It is a first of
its kind in the Indian context. We analyzed the geometric pattern of three regions of the face, computed pixel
difference, and calculated fractal dimensions of the expressions for all the images of these two databases.
Thereafter, we analyzed the obtained outcomes of the geometric analyses and the reported unbiased hit rates
for these databases, respectively. Results suggest that recognition of facial expressions is independent of the
viewing angle. Further, happiness and anger are recognized best irrespective of their intensity followed by
more intense surprise and disgust. The Root Mean Square pixel difference shows identical pattern in the
expressions of happiness and disgust. Fractal dimensions indicate self-similarity among surprise, happiness,
and disgust.
1 INTRODUCTION
A substantial percentage of the information that we
intend to express is conveyed through facial
expressions. The analysis of feature point distance in
facial expressions is the key to quantification of
expression of emotions. However, most of the
behavioural studies have ignored the interaction
between facial morphology and facial expressions
(Hess et al., 2009).
Geometric methods have the potential to map
subtle changes on the face. They rely on the position
of facial features and the corresponding
displacement/ deformation. The higher the distance of
the feature vector of a given facial expression is from
the mean, the easier one finds recognizing it
(Valentine, 1991). Assuming face as geometric shape
implies extraction and analysis of facial components
such as eye brows, eyes, nose, and lips as geometric
features. The geometric feature-based methods use
geometric relationships between facial feature points
and extracts the features.
Fractal dimension is one of the robust but rarely
used techniques for the study of facial expression.
These applications also involve two-dimensional
images which are produced by medical and non-
medical machines. Fractal dimension has been
calculated using a pixel-intensity method in several
such studies (Athe et al., 2013). The same approach
has been adopted to compute fractal dimension from
photographs representing different facial expressions.
Takehara et al. (2002) have argued that recognition of
facial expressions of emotions is based in potential
regularity on the basis of fractal dimension.
Assuming the two-dimensional psychological space
homogenous, Takehara et al. (2002) have argued that
the expression prototype, and thus the geometric
relationship between these prototypes, should be
continuous. Fractal geometry is the best tool to
analyze uneven surface with irregularities of variable
sizes. They have analysed facial expressions in terms
of fractal dimension and found that recognition of
facial expression has fractal properties. However, the
two-dimensional psychological space is not
homogeneous. Some researchers have used fractal
analysis to explain fractal dimension changes in facial
expressions (Takehara et al., 2013). Except Takehara
et al. (2007) we did not find any study examining
Bhushan, B. and Munshi, P.
Exploring Fractal Dimension Analysis as a Technique to Study the Role of Intensity of Facial Expression and Viewing Angle.
DOI: 10.5220/0010124301030110
In Proceedings of the 16th International Joint Conference on Computer Vision, Imaging and Computer Graphics Theory and Applications (VISIGRAPP 2021) - Volume 2: HUCAPP, pages
103-110
ISBN: 978-989-758-488-6
Copyright
c
2021 by SCITEPRESS – Science and Technology Publications, Lda. All rights reserved
103

facial expressions on the basis of fractals. The three
studies adopting fractal analysis of facial expressions
(Takehara et al., 2002, 2007, 2013) were conducted
on small sample and limited images. Considering the
merit of fractal mathematics, especially it being
independent of how the images are obtained, we
explored its application in the study of facial
expression vis-à-vis the intensity and viewing angles.
Researchers have mostly used high intensity static
stimuli (Lander & Butcher, 2015) and most of them
have not looked at varying intensity of expression. For
instance, the low, intermediate, and high intensity
expressions were created by Wingenbach et al. (2016)
by extracting consecutive frames. They found a linear
relationship between physical intensity of expression
and accuracy. Bould and Morris (2008) truncated the
unfolding of facial expression of emotions from neutral
to full intensity. Our day-to-day interaction involves
facial expression of emotions of low to intermediate
intensity (Motley & Camden, 1988) and intense
expressions are exceptions (Hess et al., 2009). Thus,
study of varying intensity of facial expression of
emotions can help understand issues related to emotion
recognition in normal as well as clinical population
such as Autism Spectrum Disorder (Harms et al.,
2010). Given this fact, it is important to combine the
thoroughness of geometric method and the
exquisiteness of behavioural method to examine what
makes us decipher facial expressions and recognize the
emotion as well as its intensity. Also, the angle of view
and its effect on the recognition of emotions needs to
be looked at. However, we did not come across any
such study and decided to work on it.
A careful screening of the datasets revealed that
three datasets (Bhushan, 2007; Bould & Morris,
2008; Wingenbach et al., 2016) contains variable
intensity of emotions based on extraction of
consecutive frames. However, all of them have only
front view of the expresser. Two other databases, the
Karolinska Directed Emotional Faces (Lundqvist et
al.,1998) and the Indian Affective Picture Database
(IAPD: Sharma & Bhushan, 2019), contains facial
expressions of the basic emotions taken from five
different angles. We looked at the three existing
Indian datasets reviewed by Sharma and Bhushan
(2019) and taking care of the cultural and ethnic
concerns selected two of the existing Indian datasets.
The choice of the database was based on three
criteria, the database should have facial expressions
of the basic emotions, it should have expressions of
variable intensity and/or facial expressions captured
from different viewing angles, and both of them
should have expressers and respondents from the
same culture. This was done to take care of issues
pertaining to cultural variations in recognition
patterns.
The objective of the study was to examine— (i)
the interplay of physical properties of facial
expression of emotions and their recognition, and (ii)
the relationship between physical intensity of
expression and response accuracy for front and
angular view of expressions. Accordingly, we
hypothesized that (i) the geometric properties of the
face would significantly affect the recognition of
facial expression of emotions, and (ii) the geometric
properties of the face for front view will differ from
the angular view of the facial expression and this will
affect recognition accuracy.
2 MATERIAL AND METHOD
2.1 Stimuli
As stated above, facial expressions of two datasets,
the Indian dataset of basic emotions (Bhushan, 2007)
and IAPD (Sharma & Bhushan, 2019), were used in
this study. The Indian dataset of basic emotions
comprise of 36 coloured images (6 emotions x 6
intensity) of a male expresser (see figure 1). They are
static frames of sequential changes derived from
videos. Depending upon their sequence of
occurrence, these static images are numbered from 1-
6 wherein the numbers also refer to the increasing
order of intensity of the expression (1= lowest
intensity – 6= highest intensity). All the images show
the front view of facial expression. This dataset has
been used to identify the areas of the face scanned
during emotion recognition (Bhushan, 2015).
IAPD contains 140 coloured pictures (7 emotions
X 5 angles X 4 expressers) of four expressers (two
males and two females) from five different angles—
-90 (full left profile), -45 (half left profile), 0
(straight), +45 (half right profile), and +90 (full right
profile) degrees (see figure 1).
The pictures of both the database were of same
size (562x762 pixels). Although, both the databases
have adopted Likert scale for rating the intensity they
are bit different. While the first dataset requires the
participants to recognize the emotion (happy, sad,
fear, anger, surprise, disgust, or neutral) and then rate
its intensity on a 5-point Likert scale (1= minimum,
5= maximum), IAPD has adopted 9-point scale
ranging from 1 (not at all intense) to 9 (completely
intense) for rating the intensity of the emotion.
HUCAPP 2021 - 5th International Conference on Human Computer Interaction Theory and Applications
104
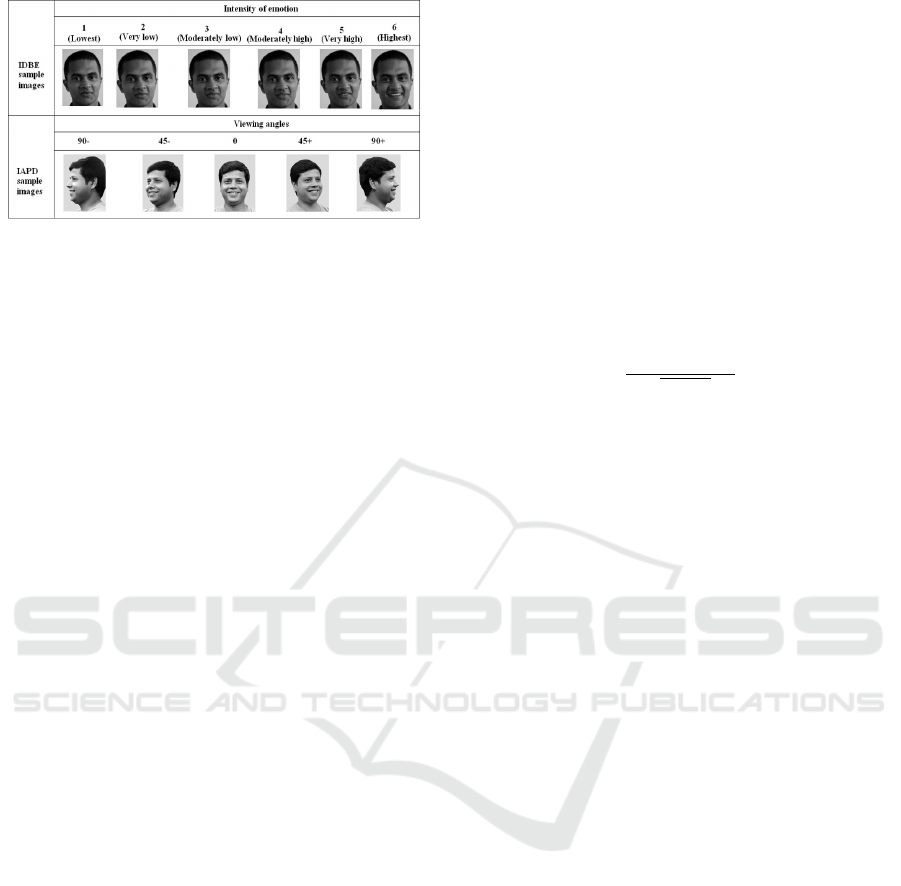
Figure 1: Sample images of facial expressions of both, the
Indian dataset of basic emotions and the Indian Affective
Picture Database.
2.2 Procedure
Behavioural studies have relied on subjective
response of human participants by quantifying them
in terms of accuracy and/or response time. However,
we did not collect behavioural data; rather we
conducted three tier analyses of the images of both
the databases— analyzing geometric pattern in the
area attended on the face, computing root mean
square (RMS) pixel difference, and fractal
dimensions to examine the geometrical deviation
among images depicting facial expression of
emotions. Thereafter, we compared these outcomes
with the behavioural outcomes reported by the
respective authors of these two databases. RMS is
root-mean-square which is bread-and-butter term for
engineers. Scattered data points can be fit into a
straight line and root-mean-square (RMS) is the
standard techniques for making such a fit. Most
engineering application adopt this strategy to
represent seemingly large collection of individual
points by a straight line. The major advantage of such
a representation is that a straight line can be
quantified by only two parameters, the slope and the
intersect. This two-parameter system now represents
the set of several individual points and the RMS value
of zero (goodness-of-fit value of 1) represents a
perfect fit.
3 RESULT
3.1 Identifying Geometric Pattern
To see the interplay of physical properties of facial
expression of emotions and their recognition it was
important to extract embedded geometric pattern in
the photographs depicting facial expressions and see
the interplay of these physical properties and their
recognition accuracy. Based on eye-tracking Bhushan
(2007) has reported that the observers look at only
three regions while trying to understand human facial
expressions— the eyes (eyebrows, eyes, and eyelash),
nose (without the bridge) and lip regions (centre and
two diagonals). Thus, we investigated the geometric
pattern in all the 36 images of the Indian dataset of
basic emotions. The initial parameters were shortest
vertical and horizontal distance among the three facial
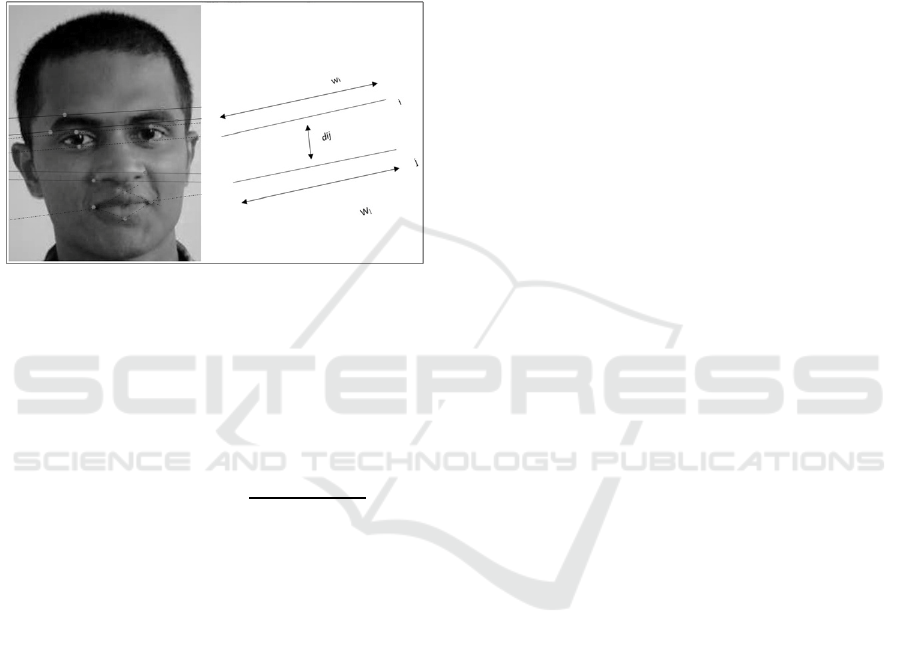
regions. Figure 2 illustrates the three regions. The
shortest distance between point ‘P’ and line ‘L’ is the
minimum vertical length and is denoted by ‘d’.
Distance ‘d’ can then be defined as the length of the
line segment that has P (x
0
, y
0
) as an endpoint and is
perpendicular to L (ax+by+c=0). It was calculated
using the formula—
𝑑=
|
𝑎𝑥0+𝑏𝑦0+𝑐
|
√
𝑎
+𝑏
(1)
The resultant horizontal distance is estimated by
W
ij
= W
i
-W
j
,
(2)
where W
i
is the width of ith line and W
j
is the
width of jth line.
These equations (1 and 2) were worked out for all
six intensity levels of all the six basic emotions using
MATLAB
©
2014 software. Significant changes were
observed in all the three regions for surprise and
disgust. For surprise the eyebrows, lips centre and
diagonal changes play important role (higher value of
vertical distance) at higher intensity. For disgust the
eyebrows, eyelash, and nose play important role at
low intensity. Expansion (horizontal distance) of lips
centre is more expressive at lower intensity level,
whereas vertical distance of lips centre section is
more sensitive at higher intensity levels of disgust.
Fear had a distinct pattern. Each region of fear
expression becomes more prominent as the intensity
increases. For the remaining three emotions,
happiness, sadness, and anger, the horizontal-vertical
changes were not exhibited in all the three regions. In
happy expressions the expansion of lips centre
increases at higher intensity of happy expression. In
sadness the expansion of both nose and lips centre
become more prominent at higher intensity of
expression. The nose region plays important role at
low intensity of anger, whereas lips centre and
diagonal changes are more prominent (high values of
vertical distance) at high intensity of anger.
The overall comparison of the facial expressions
with respect to changes in the vertical and horizontal
distance points out that as far as horizontal distances
are concerned the findings suggest that the eyebrow,
eyelash, lips centre and diagonal sections of happy
emotion indicated distinguished pattern compared to
other emotions. Disgust facial expression show
Exploring Fractal Dimension Analysis as a Technique to Study the Role of Intensity of Facial Expression and Viewing Angle
105
variance in the eyelash, nose and lips centre section
compared to other emotions. Analysis of the vertical
distance indicated that the eyebrow section is the
most expressive part in surprise compared to the
remaining facial expressions of emotions. Eyelash,
lips centre and diagonal sections of happy emotion
indicate distinguished pattern compared to others
emotions. Disgust facial expression show anomaly in
nose and lips centre section compared to other
emotions.
Figure 2: The three regions of the face.
3.2 Root Mean Square and Average
Value
The root mean square (RMS) pixel difference was
estimated for facial expressions of all six intensities
of all the six emotions. RMS was compute using
following formula—
𝑅𝑜𝑜𝑡 𝑚𝑒𝑎𝑛 𝑠𝑞𝑢𝑎𝑟𝑒
𝑒
)
=
𝑓
)
−
𝑓
)
)
,
where the image size is M x M implying a total of
M
2
pixels and f
i
is the value of the gray-level for i
th
pixel. The six emotions are represented by the index j
which takes on integer values between 1 and 6. The
index k also takes on integer values between 1 and 6.
Whenever j=k we have RMS value as zero since the
image is compared by itself. The observer sees the
whole face and identifies the person concerned.
The findings suggest that RMS pixel difference
value of happy and disgust emotions are in increasing
order. Thus, these emotions show identical behaviour.
Similarly, fear and sad emotions show identical
pattern. The diagonal matrix shows all possible RMS
difference for all intensity levels. It is observed from
the matrix that fear facial shows maximum RMS
difference values with all combinations, whereas
happy and sad emotions show comparatively lower
values.
RMS pixel difference shows identical patterns in
the expressions of happiness-disgust and fear-
sadness. It suggests that changes in eyebrows (region
1) affect expression of surprise whereas changes in
nasal area (region 2) and lips (region 3) affect
expression of disgust. Happiness is affected by
changes in eye-lash (region 1) and lips (region 3).
We neither analyzed geometric pattern (of the
area attended on the face) nor computed root mean
square (RMS) pixel difference for IAPD images for
two reasons— (i) all expressions of any given
emotion in IAPD show only one static pose and
therefore doesn’t have variance, and (ii) except one
(straight), all other images of IAPD are from varying
degree which limitsgeometric comparison of select
regions.
3.3 Fractal Dimension
The mathematical formulation of fractal involves
analysis of distribution of these gray-levels and it is
independent of the source that makes the
image/photograph. This study is an attempt to
quantify emotions with the help of photographs taken
of the subject. These photographs have been taken
from different angles since observer in real life
situations may not be present exactly in front of the
subject. The effect of viewing angle thus becomes
important in this work. The geometric property
considered in the fractal theory is the change in pixel-
value (gray-level) from one pixel to another. This
notion of "self-similarity" exists in nature and we see
that facial photographs also exhibit this behaviour.
The facial muscles expand/contract in an interesting
way to produce facial expressions unique to the basic
emotions. This aspect has been captured by fractal
dimension computation. Fractal theory illustrates the
characteristics of images/photographs based on the
similarities of neighboring regions from the gray-
level perspective. The "measurement" aspects is
embedded in the fractal variable normalized-range-
scale (NSR) parameter which incorporates physical
distances in the formulations. These distances are in
pixel units since an image is composed of square
pixels. Each pixel in this study is 0.26 mm x0.26 mm
square shape and it is used in image processing steps
for computing fractal dimension.
3.3.1 The Indian Dataset of Basic Emotions
We analyzed fractal dimensions for all expressions
of the Indian dataset of basic emotions across all six
intensity levels. Table 1 summarizes the obtained
fractal dimensions whereas figure 3 illustrates the
HUCAPP 2021 - 5th International Conference on Human Computer Interaction Theory and Applications
106
change in fractal dimensions with increase in the
intensity of expression.
Table 1: Fractal dimensions for IDBE (all six intensity
levels) and IAPD (all five viewing angles) facial
expressions of all six basic emotions and respective
unbiased hit rates (Hu).
IDBE
Emotions
Intensity
Reported
Hu
1 2 3 4 5 6
Happy
2.58 2.59 2.59 2.59 2.59 2.61 0.64
Sad
2.61 2.64 2.64 2.65 2.62 2.63 .13
Fear
2.61 2.61 2.64 2.64 2.64 2.64 0.11
Anger
2.56 2.57 2.58 2.59 2.57 2.56 0.44
Surprise
2.58 2.58 2.58 2.59 2.59 2.60 0.25
Disgust
2.57 2.58 2.58 2.58 2.59 2.61 0.15
IAPD
Emotions
Viewing Angles
Reported
Hu
90- 45- 0 45+ 90+
Happy 2.29 2.23 2.42 2.34 2.37 0.88
Sad 2.33 2.16 2.39 2.29 2.37 0.8
Fear 2.3 2.18 2.33 2.35 2.44 0.86
Anger 2.38 2.17 2.42 2.41 2.31 0.92
Surprise 2.3 2.27 2.4 2.22 2.38 0.89
Disgust 2.26 2.2 2.35 2.34 2.41 0.9
Neutral 2.33 2.21 2.46 2.32 2.37 0.74
*Hu for IDBE has been reported separately for
all intensity levels across six emotions. Here average
Hu for the given emotions have been reported.
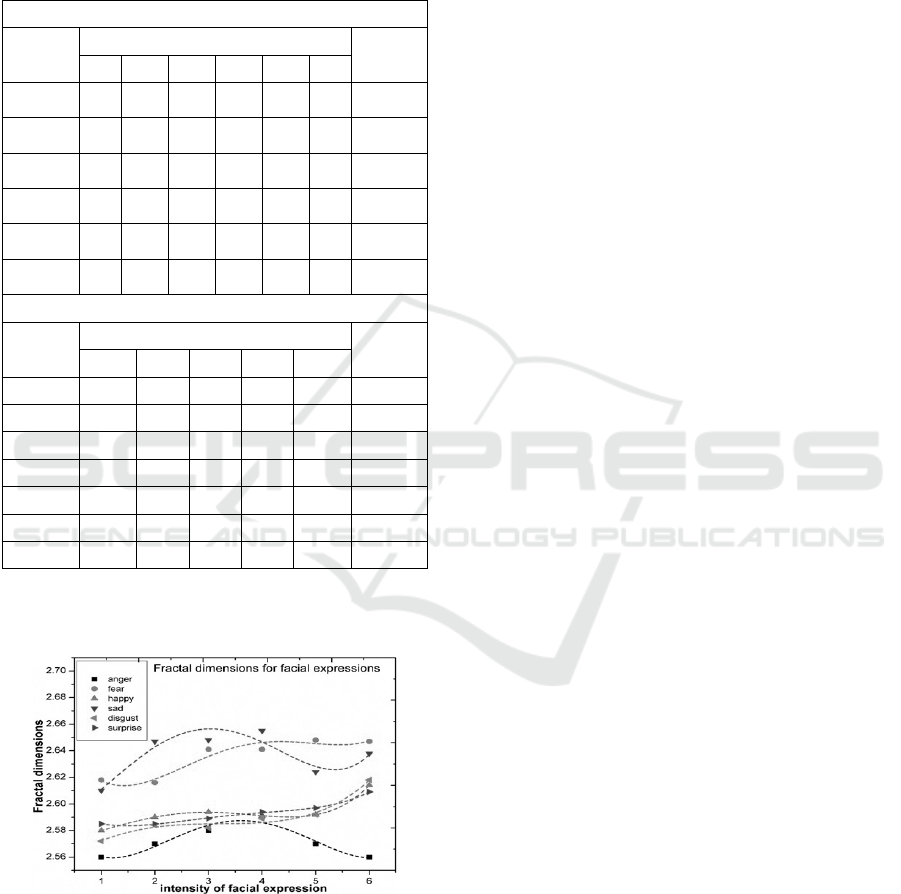
Figure 3: Fractal dimensions for the facial expressions of
the Indian dataset of basic emotions across six dimensions.
For clear understanding of the results, it is
presented in form of apolynomial fit. This apart can
further be used for detailed mathematical analysis of
emotions. The findings suggest very-very strong (say
3) self-similarity between surprise-happiness and
very strong (say 2) self-similarity between surprise-
disgust. Happiness and disgust also had strong (say
2.5) self-similarity. It indicates self-similarity which
is one aspect of complexity of a two-dimensional
function/image. Other mathematical functions can be
used also but fractal dimension has become very
popular in medical and industrial imaging, hence we
have tried it for understanding facial expressions also.
The surprise-happiness-disgust trio had self-
similarity across all six intensity levels, lowest to
highest. The self-similarity between surprise and
anger reached a non-distinguishable level as the
surprise-happiness-disgust trio between moderately
low (3) and moderately high (4) intensity levels. Fear
and sadness had a weak self-similarity. Sadness and
anger showed a distinct characteristic. They had
different base but shared same pattern (showing a
bump).
3.3.2 The Indian Affective Picture Database
We computed fractal dimensions for all the images of
this database. Table 1 summarizes the obtained fractal
dimensions.
The result suggests that the facial expressions of
IAPD images fall within a band ranging between 2.1
and -2.5 and this band is independent of the type of
emotion. The uncertainty band marginally changes (∆
.4) depending upon the angle of observation. The
manifestation of happy facial expression is isotropic,
i.e., they are angle independent. Further, there is no
sex difference as far as expression of happiness is
concerned. For neutral expressions the facial
expressions of the males do not change as much as the
females. Although IAPD has two male and two
female expressers, one of the male expressers does
not show much change in the expression, especially
neutral, surprise expressions.
4 COMBINING IMAGE
ANALYSIS OUTCOMES AND
REPORTED BEHAVIOURAL
OUTCOMES
Both the databases have reported the proportion of
correctly identified stimuli (hit rate), unbiased hit rate
(Hu), and rating of intensity. Having quantified the
geometric properties of the facial expressions we tried
mapping them together with the reported behavioural
response for the two respective databases to derive
some meaningful conclusion. The behavioural data
outcome of the Indian dataset of basic emotions
Exploring Fractal Dimension Analysis as a Technique to Study the Role of Intensity of Facial Expression and Viewing Angle
107

(Bhushan, 2007) clearly indicates high recognition
accuracy (hit rate) for happiness and disgust across
intensity levels. With increasing intensity recognition
accuracy of surprise and anger also increases. The
unbiased hit rate (Table 1) also suggests better
recognition of happy, anger, surprise, and disgust
expressions. RMS pixel difference show identical
pattern in the expressions of happiness and disgust.
On the other hand, fractal dimensions indicate self-
similarity among surprise, happiness, and disgust. It
also indicates self-similarity between surprise and
anger between moderately low and moderately high
intensity levels. It seems that human beings have a
natural inclination to search appropriate geometric
cues while deciphering facial expressions of
emotions.
The outcome of behavioural data for IAPD
(Sharma & Bhushan, 2019) suggests high recognition
rate (mean hit rate) for happiness (99.91). The other
emotions were also close (anger (96.21), disgust
(95.66), surprise (95.15), sadness (94.18), and fear
(92.91). They found that neutral expression (77.14)
was most difficult to recognize.
A comparison of both the databases on the basis
of hit rates indicates that happiness, disgust, anger,
and surprise are recognized better. When the Huof the
two databases were compared slight variation was
observed. For IAPD anger (0.92), disgust (0.90),
surprise (0.89), and happiness (0.88) had higher Hu.
The Hu for the Indian dataset of basic emotions have
been reported for all six intensity levels of the
respective emotions. Hence, we took the overall value
for each of the basic emotion. Here the Hu of
happiness (0.641) is far higher followed by anger
(0.443) and surprise (0.251). For remaining emotions,
the reported values are low.
The fractal dimension of IAPD suggests that
accuracy of recognition of emotion is not affected by
the viewing angle of the facial expression. The
findings confirm that geometric properties of the face
significantly affect the recognition of facial
expression of emotions. Further, these properties do
not affect recognition of facial expressions when
viewed from different angles.
5 DISCUSSION
This study examined the geometric changes in the
select regions of the face during expression of
emotions vis-à-vis increase in the intensity of
expression and the viewing angle. IAPD study has
reported happiness as ‘easily identifiable emotion’
and neutral to be difficult. Difficulty in distinguishing
fear-surprise and anger-disgust has also been reported
attributing it to similarity in‘configuration of the
facial muscles’. Further, recognition of emotion on
the face is not affected by the viewing angle. The
findings of IDBE study has also endorsed that the
accuracy of recognition depends on the intensity of
surprise, happiness, and disgust. Other studies have
also reported that happiness is very distinct compared
to other basic emotions and hence is distinctly
recognized. They show that happy and surprise
expressions are easily recognized (Calvo et al., 2014).
Recognition of happiness has also been found to be
faster compared to negative emotions (Leppanen &
Hietanen, 2004). Du and Martinez (2011) have
reported higher recognition of happiness and surprise,
poor recognition of anger and sadness and worst
recognition of fear and disgust. If we look at these
expressions in terms of larger face transformations,
surprise involves largest deformation followed by
disgust and fear. However, both disgust and fear are
very poorly recognized. (Calvo & Lundqvist, 2008)
found that fear is difficult to be recognized.
Another significant finding of the study was the
relationship between geometric changes and
recognition of facial expression. We found high
recognition accuracy as well as self-similarity
between surprise, happiness, and disgust. Neth and
Martinez (2009, 2010) have reported distance
changes between facial features in specific emotion
expression. Happiness involves change in the
curvature of mouth and surprise involves opening of
the eyes. These expressions share additional sclera.
The distance between eyebrows and eyes is large and
the face is thinner for surprise. The distance between
eyebrows, eyes, nose, and mouth is shorter for
disgust. Our findings are in consonance with these
results. The distance between eyebrows and mouth
and the width of the face are distinct to sad and anger
expressions. Larger distance has been reported
between eyebrows and mouth (Neth & Martinez,
2009) and a thinner face than usual (Neth & Martinez,
2010) for sadness. The distance between eyebrows
and mouth is much shorter and the face is wide for
anger. Further, the distinction between these two
expressions blurs with reduction in the computational
space between them.
Fearful expression had a distinct pattern but we
did not find self-similarity across intensity levels. The
evolutionary viewpoint has endorsed fair degree of
recognition of fear due to its survival significance but
later researchers have reported poor recognition of
fear in healthy population (Du & Martinez, 2011).
Susskind et al. (2008) have argued that the sensory
channels open in fear and closes in disgust.
HUCAPP 2021 - 5th International Conference on Human Computer Interaction Theory and Applications
108

These findings have several applications. The
understanding of facial expressions has application in
mental health setting where it can help identify
mental state, intensity of pain, deception of
symptoms, subjective experience of treatment/
interventions, automated counselling, and many more
areas. Such findings are also likely to affect human
computer interaction (HCI), interactive video, and
other related areas. Calder et al. (2001) have
classified emotion expression into three categories
and the take away for HCI research. Happiness and
surprise can be detected easily irrespective of the
distance between the expressor and the person
perceiving it. Anger and sadness are reasonably
detected from proximity. Fear and disgust constitute
the third group of emotions for which people are not
very good at recognizing. Although, we also found
the relationship between happiness and surprise, our
findings show little deviation from the findings of
Calder et al. (2001). These findings might be useful
for HCI researchers looking for systems that can at
least reasonably imitate human perceptual ability.
Some researchers suggest variability in the perception
of dynamic expressions in the clinical population
such as Pervasive Developmental Disorder (Uono,
Sato, & Toichi, 2010) and Asperger Syndrome
(Kätsyri et al., 2008). The stimulus used in the present
study has graded intensity level adding to the
dynamic nature of facial expression and thus might be
useful for study of the clinical population as well.
The advantage of the two databases analyzed in
this work is that they contain static stimuli extracted
from dynamic source that represents real life
condition. Thus, together they consist of facial
expression of emotions of all the six basic emotions
of six varying intensities and five different viewing
angles. However, there is an inherent limitation as
well. While IDBE consists of facial expressions of
only one male expresser, IAPD comprise of
expressions from five different viewing angles but not
of variable intensity. Although, the absence of larger
database limits the generalizability of specific
findings but it does establish that RMS and fractal
dimension can be very well applied in behavioural
science studies as well.
REFERENCES
Athe, P., Shakya, S., Munshi, P., Luke, A., & Mewes, D.
(2013). Characterization ofmultiphase flow in bubble
columns using KT-1 signature and fractal dimension.
Flow Measurement and Instrumentation, 33, 122-137.
Bhatt, V. Munshi, P., & Bhattacharjee, J. K. (1991).
Application of fractal dimension for nondestructive
testing. Materials Evaluation, 49, 1414-1418.
Bhushan, B. (2007). Subjective analysis of facial
expressions: Inputs from behavioural research for
automated systems. Unpublished project report INI-
IITK-20060049, Indian Institute of Technology,
Kanpur.
Bhushan, B. (2015). Study of facial micro-expressions in
psychology. In A. Awasthi & M. K. Mandal (Eds.)
Understanding facial expressions in communication:
Cross-cultural and multidisciplinary perspective.
Springer, pp. 265-286. https://doi.org/10.1007/978-81-
322-1934-7_13
Bould, E. & Morris, N. (2008). Role of motion signals in
recognizing subtle facial expressions of emotion.
British Journal of Psychology. 99, 167-189.
https://doi.org/10.1348/000712607X206702
Calder, A. J., Burton, A. M., Miller, P., Young, A. W., &
Akamatsu, S. (2001). A principal component analysis
of facial expressions. Vision Research, 41, 1179-1208.
https://doi.org/10.1016/S0042-6989(01)00002-5
Calvo, M. G. & Lundqvist, D. (2008). Facial expressions of
emotion (KDEF): Identification under different
display-duration conditions. Behavior Research
Methods, 40, 109-115.
https://doi.org/10.3758/BRM.40.1.109
Calvo, M. G., Gutiérrez-García, A., Fernández-Martín, A.,
&Nummenmaa, L. (2014). Recognition of facial
expressions of emotion is related to their frequency in
everyday life. Journal of Nonverbal Behavior, 38, 549-
567. https://doi.org/10.1007/s10919-014-0191-3
Du, S. & Martinez, A. M. (2011). The resolution of facial
expressions of emotion. Journal of Vision, 11, 24.
https://doi.org/10.1167/11.13.24
Harms, M. B, Martin, A., & Wallace, G. L. (2010). Facial
emotion recognition in autism spectrum disorders: a
review of behavioral and neuroimaging studies.
Neuropsychology Review, 20, 290-322.
https://doi.org/10.1007/s11065-010-9138-6
Hess, U., Adams, R. B., &Kleck, R. E. (2009). The face is
not an empty canvas: how facial expressions interact
with facial appearance. Philosophical Transactions of
the Royal Society B: Biological Sciences, 364, 3497-
3504. https://doi.org/10.1098/rstb.2009.0165
Kätsyri, J., Saalasti, S., Tiippana, K., von Wendt, L.,
&Sams, M. (2008). Impaired recognition of facial
emotions from low-spatial frequencies in Asperger
syndrome. Neuropsychologia, 46, 1888-1897.
https://doi.org/10.1016/j.neuropsychologia.2008.01.00
5
Lander, K. & Butcher, N. (2015). Independence of face
identity and expression processing: exploring the role
of motion. Frontiers in Psychology, 6, 255.
https://doi.org/10.3389/fpsyg.2015.00255
Leppänen, J. M. &Hietanen, J. K. (2004). Positive facial
expressions are recognized faster than negative facial
expressions, but why? Psychological Research, 69, 22-
29. https://doi.org/10.1007/s00426-003-0157-2
Exploring Fractal Dimension Analysis as a Technique to Study the Role of Intensity of Facial Expression and Viewing Angle
109

Lundqvist, D., Flykt, A., &Öhman, A. (1998). The
Karolinska Directed Emotional Faces-KDEF, CD
ROM from Department of Clinical Neuroscience,
Psychology section, KarolinskaInstitutet: Stockholm.
Medicine, 30(1), 32-28.
Motley, M. T. & Camden, C. T. (1988). Facial expression
of emotion: A comparison of posed expressions versus
spontaneous expressions in an interpersonal
communication setting. Western Journal of Speech
Communication, 52, 1-22.
https://doi.org/10.1080/10570318809389622
Neth, D. & Martinez, A. M. (2009). Emotion perception in
emotionless face images suggests a norm-based
representation. Journal of Vision, 9, 1-11.
https://doi.org/10.1167/9.1.5
Neth, D. & Martinez, A. M. (2010). A computational shape-
based model of anger and sadness justifies a configural
representation of faces. Vision Research, 50, 1693-
1711. https://doi.org/10.1016/j.visres.2010.05.024
Sharma, U. & Bhushan, B. (2019). Development and
validation of Indian Affective Picture Database.
International Journal of Psychology, 54, 462-467.
https://doi.org/10.1002/ijop.12471
Susskind, J., Lee, D., Cusi, A., Feinman, R., Grabski, W.,
& Anderson, A. K. (2008). Expressing fear enhances
sensory acquisition. Nature Neuroscience, 11, 843-850.
https://doi.org/10.1038/nn.2138
Takehara, T., Ochial, F. & Suzuki, N. (2002). Fractals in
emotional facial expression recognition. Fractals, 10,
47-52. https://doi.org/10.1142/S0218348X02001087
Takehara, T., Ochial, F., Watanabe, H. & Suzuki, N.
(2007). The fractal property of internal structure of
facial affect recognition: A complex system approach.
Cognition & Emotion, 21, 522-534.
https://doi.org/10.1080/02699930600774582
Takehara, T., Ochial, F., Watanabe, H., & Suzuki, N.
(2013). The relationship between fractal dimension and
other-race and inversion effects in recognizing facial
emotions. Cognition & Emotion, 27, 577-588.
https://doi.org/10.1080/02699931.2012.725655
Uono, S., Sato, W., &Toichi, M. (2010). Brief Report:
Representational Momentum for Dynamic Facial
Expressions in Pervasive Developmental Disorder.
Journal of Autism and Developmental Disorders, 40,
371-377. https://doi.org/10.1007/s10803-009-0870-9
Valentine, T. (1991). A unified account of the effects of
distinctiveness, inversion, and race in face recognition.
Quarterly Journal of Experimental Psychology A:
Human Experimental Psychology, 43, 161-
204.https://doi.org/10.1080/14640749108400966
Wingenbach, T. S. H., Ashwin, C., &Brosnan, M. (2016).
Validation of the Amsterdam Dynamic Facial
Expression Set – Bath Intensity Variations
(ADFES-BIV): A Set of Videos Expressing
Low, Intermediate,and High Intensity
Emotions. PLoS ONE, 11, e0147112.
https://doi.org/10.1371/journal.pone.0147112.
HUCAPP 2021 - 5th International Conference on Human Computer Interaction Theory and Applications
110
