
Assessing Project Progress Planning using Control Diagrams and
Neural Network Prediction for Shipbuilding Projects in an
Ecuadorian Shipyard
Gerardo Mena Caceres
a
Project Management Office, MSc. Global Production Engineering & Management,
Global Production Engineering & Management, AV 8ANO, Guayaquil, Ecuador
Keywords: Project Management, Data Analysis, Data Prediction, Planning.
Abstract: The planning and scheduling of new shipbuilding projects, as in other engineering disciplines require a certain
degree of experience and knowledge in order to provide progress planning of feasible works to achieve the
goals of the project and the managerial expectation. As is mentioned, although having experience is necessary;
according to current technologies, the use of data analysis and the certainty that in the medium-term future
artificial intelligence will be used in decision-making, it is necessary that not only manufacturing be according
to the approaches of industry 4.0 but also, project management from its start-up phase to closure uses
mechanisms for continuous improvement in a more successful way. This case study focuses on the data
analysis of planned and executed projects to estimate acceptable percentages of periodic progress of projects
using parameters of reliability engineering and neural network model from ISPP IBM software, in such a way
that the planning can be in accordance with the shipyard behaviour.
1 INTRODUCTION
Projects of any kind comprise different stages of
development, which go through initiation and
planning, execution, monitoring and control and
closure, and also have as parameters or "natural"
constraints the scope, time, quality, and cost (Project
Management Institute, 2017). However, at the time of
preparing the project, it's planning and schedule, it is
based more on the experience of the project manager
rather than on data recorded by the companies, this
experience makes this activity inherent to whoever
owns it, causing Project Managers (PMs) to estimate
project base line empirically or simply to what a
planning program says without examining data based
on similar previous projects or business behavior
even when they already exist.
Scheduling and progress planning are essential in
order to understand the base line of the project and in
order to figure out the managers’ intentions, that in
the end combined with the balance of the project will
determine if it was successful or not.
a
https://orcid.org/0000-0002-9169-6765
This document focuses on showing the current
importance for project managers the data analysis for
planning and thus making estimations or predictions
based on an analysis of data behavior, for progressive
project planning in a way more accurate, using the
registered data in the case of a specific company
dedicated to the new shipbuilding projects in Ecuador.
2 PROBLEM STATEMENT
Projects are characterized because they have a time
limit, that is, they have a beginning and a specific
duration (Lledó, Rivarola, Mecaru, & Cucchi D,
2006) given this, it requires an effort that is definitely
not constant and varies according to the type of
project, its scope, and available resources, also
considering the natural constraints mentioned above.
The shipbuilding industry in Ecuador is not too much
developed in terms of technology, innovation and
manufacturing techniques, so, generally speaking
these kinds of business needs to be assessed
according to the actual situation seeing their own
60
Caceres, G.
Assessing Project Progress Planning using Control Diagrams and Neural Network Prediction for Shipbuilding Projects in an Ecuadorian Shipyard.
DOI: 10.5220/0009993100600068
In Proceedings of the International Conference on Innovative Intelligent Industrial Production and Logistics (IN4PL 2020), pages 60-68
ISBN: 978-989-758-476-3
Copyright
c
2020 by SCITEPRESS – Science and Technology Publications, Lda. All rights reserved

constraints, strengths and weaknesses in order to
establish the best solution for them.
To execute any kind of project, the initial outline
or route to follow is required, so that those involved
in its development have full knowledge of the
expected scheduled progress, this is obtained through
planning, which can be developed in some existing
software (Excel, Project, etc.), but how could we
determine if the planned and desired progress is in
accordance with the business reality? This question
leads us to ask whether the experience alone
guarantees adequate planning and scheduling of
activities, and whether it is ultimately feasible or not
that the goals set are met according to a plan.
3 GENERAL CONCEPTS
3.1 Variability
Every system has variability, it is independently of
what kind of system it represents and the variability
is determined by the standard deviation of the data in
relation to its arithmetic mean (average), which
allows establishing in addition to the variance, the
form, or dispersion of the existing data. Variability
should not be seen as a problem in systems, as it can
be good or bad depending on the group or situation
being analyzed (Hoop & Spearman, 2008).
3.2 Standard Deviation
It is defined as the square root of the variance (Hines
& Montgomery, 2004), the standard deviation is the
measure of dispersion most used to determine the
variability of a system.
3.3 Project Planning and Scheduling
Planning and scheduling are different but related to
them. We can say that scheduling is the lower level of
the planning, it focuses on the action that people need
to do in specific time, and planning involves the tasks
that the project needs to occur and how to do.
3.4 Project Progress
Although projects, like any process, require keep in
mind the integrity of the components of the system,
the development of this work will take into
consideration the planning in terms of percentage that
include all the activities entailed to complete the
shipbuilding project.
In other words, it is related to earned value index
which is commonly used to assess planning and
progress for the projects.
3.5 Statistical Control
Statistical control of processes through the use of
troubleshooting tools, allows, among other things, to
establish whether a system is under control, the level
of variability of the system, which allows the
application of continuous improvement and the
correction of possible process “failures”.
4 METHODOLOGY AND
SOLUTION DEVELOPMENT
To analyze the feasibility of data-driven planning, it is
necessary to collect existing data which is based on
reports generated by each project manager and/or those
presented by the functional units of a company. From
them, the following work methodology will be applied:
• Sort the data according to each project executed
and planned.
• Calculate the planned and executed monthly
progress of each project, as a differential.
• Calculate the standard deviation, the arithmetic
mean, variance coefficient.
• Perform statistical control of the process by
applying control diagrams
• Analyze and make estimates of minimum times
and average percentages based on data from
control theory.
• Apply neural network prediction on the sorted
data
• Analysis of the results.
It is noticeable that shipyards, like other companies,
collect certain data according to their policy, however,
the technical staff should make recommendations
about the kinds of data that are needed.
4.1 Input Data
4.1.1 Accumulated Progress Data by Project
Before making any kind of calculation, it is required
to know if any technological change has been
implemented, if the process has changed or improved,
and look for the factors that may have altered the
current state of the company which can be translated
into variability. In the event that the system has not
been implemented or adjusted to new technologies
and methodologies, it is recommended to use as much
Assessing Project Progress Planning using Control Diagrams and Neural Network Prediction for Shipbuilding Projects in an Ecuadorian
Shipyard
61
data as possible, and in case new technologies have
been implemented, the evaluation should be based on
this new business reality.
In the present case, since the company has not
carried out any implementation, the data collected
comes from all the projects in which the shipyard's
own workforce has been required, which uses the
same construction, control, and similar process
methodologies.
The data shown in Table 1 is an extract and it
represents the percentages of the accumulated
progress planned (PP) and executed (EP) by the
different projects, in this particular case, the data
corresponds for the monthly progress (T). However,
the data collection will depend on the policy
implemented, if it exists.
For the study of the present case, ten executed
projects during the last 4 years have been considered,
it is worth mentioning that, although they are not all
projects executed within the shipyard, these projects
have a register.
Table 1: Example of cumulative progress data planned.
T PP2,1 PP2,2 PP2,3 PP2,4 PP2,5 PP2,6
0 0% 0% 0% 0% 0% 0%
1 23% 23% 23% 23% 23% 23%
2 48% 48% 48% 48% 48% 48%
3 59% 59% 59% 59% 59% 59%
4 69% 69% 69% 69% 69% 69%
5 85% 80% 80% 80% 80% 80%
6 100% 90% 84% 84% 84% 84%
7
100% 93% 88% 88% 88%
8
100% 94% 92% 92%
9
100% 96% 94%
10
100
%
97%
11
100%
Within the data observed for this case study, the
different projects have been differentiated by using
generic acronyms which have data on project
planning, execution, and re-planning that can show
the changes that the projects have had since their
initial planning (PPi, 1), and until the last adjustment
made (PPi, j ), this means that in many cases the
execution of the project (EPi) is equal to the latest
version of the planning readjustment. For instance,
the project number one would be P1, the first
planning for this project will be represent by PP1,1 at
the end if the project number one has four changes in
1
https://voices.berkeley.edu/business/deconstructing-
project-management-process
the planning the identification will be PP1,4. This
mechanism is used to identify all the projects. On the
other hand, the executed projects are identified just
for one number, for the same given example the
execution for the project number one will be EP1.
Likewise, it includes planned projects that are in
execution (PPAi, j) with the same re-planning
characteristics (if they exist), and the current
execution that they carry (EPAi). This variable
differentiation allows to establish initially:
• There is new planning of the projects since there
are deviations in the baseline.
• The baseline has not been kept constant for any of
the existing projects.
• None of the planning carried out by the project
managers and their teams has been reached or,
saying in other way, they have not been carried
out correctly.
• The production behavior of the shipyard has not
been included during the planning phase.
This can be evidenced if the different plans are
drawn up, where the initially planned progress curve
can be verified and how the actual execution of the
project was, which gives us the basis for raising the
need of this study.
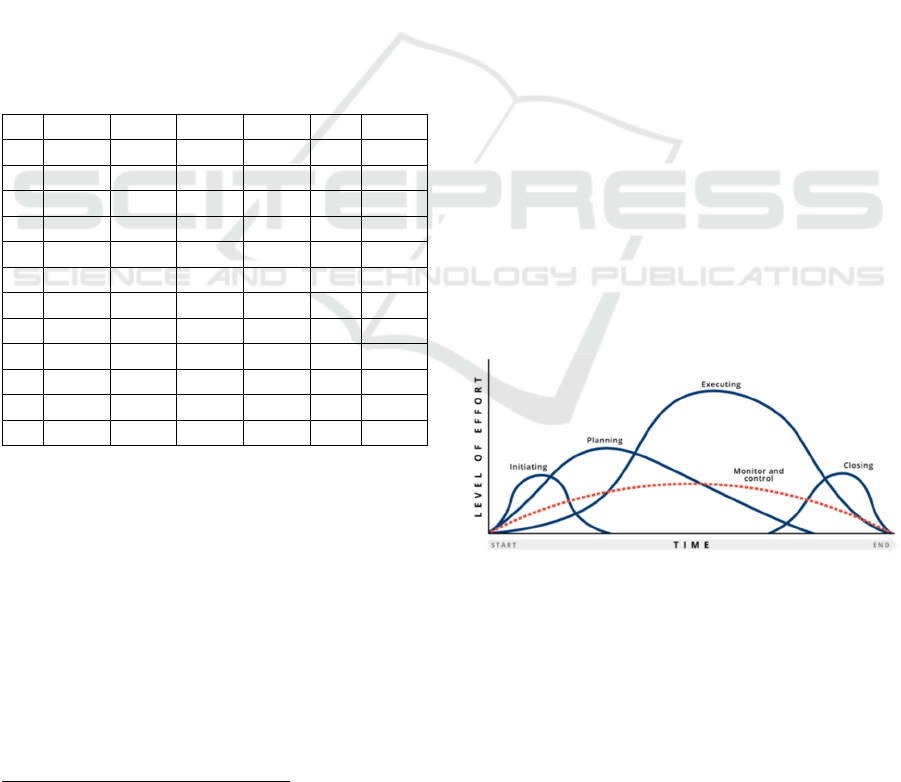
It is worth mentioning that, as in any project and
the stages of execution that each maintains, the
theoretically progressive proposed progress obeys a
Gaussian way as shown in Figure 1, therefore, it would
be expected that the plans have a similar relationship
where the effort is gradual both at the beginning and at
the end so that the project does not have excessive or
constant costs throughout its life-cycle.
Figure 1: Overlap between Project Management’s
Processes
1
.
The data collection is carried out by each project
manager and wrote down in excel document provided
by the project office. Nevertheless, each project
manager estimates the progress according to their
perspective. Shipbuilding is structured by different
IN4PL 2020 - International Conference on Innovative Intelligent Industrial Production and Logistics
62
components or disciplines: welding, auxiliary
systems, navigation, electrical and communication
system, carpentry, propulsion and steering system.
The data shown in this document is the summary of
all those shipbuilding components and the weight or
significance of each of them are not standardized.
Assign or determine a weight of each component is a
pending task not only for the Ecuadorian shipyards
(Arena, Birkler, Schank, & Riposo, 2005), but is a
task that production department or strategic one
should conduct.
4.1.2 Project Monthly Progress
To calculate the planned and executed monthly
progress of the projects, it is carried out simply by
subtracting terms, that is, these data are the
differential of those established in Table 1.
∆PPn = ∆PPi,j = PPi,j+1 – PPi,j (1)
Table 2: Example of progress data planned and executed by
projects.
PP2,1 PP2,2 PP2,3 PP2,4 PP2,5 PP2,6
23,0%
23,0%
23,0% 23,0%
23,0%
23,0%
25,0%
25,0%
25,0% 25,0%
25,0%
25,0%
10,5%
10,5%
10,5% 10,5%
10,5%
10,5%
10,5%
10,5%
10,5% 10,5%
10,5%
10,5%
16,0%
10,5%
10,5% 10,5%
10,5%
10,5%
15,0%
10,5%
4,00% 4,00%
4,00%
4,00%
10,0%
9,50% 4,00%
4,00%
4,00%
7,00% 6,50%
4,00%
4,00%
6,00%
4,00%
2,83%
4,50%
2,83%
2,84%
Remember that there must be N-1 elements as
data.
4.2 Statistical Control of the Process
Table 3: Example of dispersion measurement calculation
results.
Mean Var.
Std.
Dev.
Coef.
Var.
Std.Err.
PP1 0,1075 0,00202 0,0449 41,823 0,0159
EP1 0,1000 0,00130 0,0361 36,156 0,0114
PP2,1 0,1666 0,00377 0,0614 36,872 0,0251
PP2,2 0,1428 0,00444 0,0666 46,645 0,0252
PP2,3 0,1250 0,00557 0,0746 59,713 0,0264
PP2,4 0,1111 0,00604 0,0778 69,995 0,0259
PP2,5 0,1000 0,00632 0,0795 79,512 0,0251
The calculation of the dispersion´s measures
mentioned above, although they can be done
“manually”, for this work the same computer tool that
will be used to estimate the results is used with the
following data as a representation:
The presentation of the dispersion measurement of
the other variables are presented in the annex and the
control diagrams have the same structure as in the
Figure 2.
From the control diagrams, it can be established
whether the process was under control or not, and
because the projects presented have had a certain
degree of re-planning, it will be possible to show the
changes that the standard deviation, mean and the
coefficient of variability has one with respect to
another.
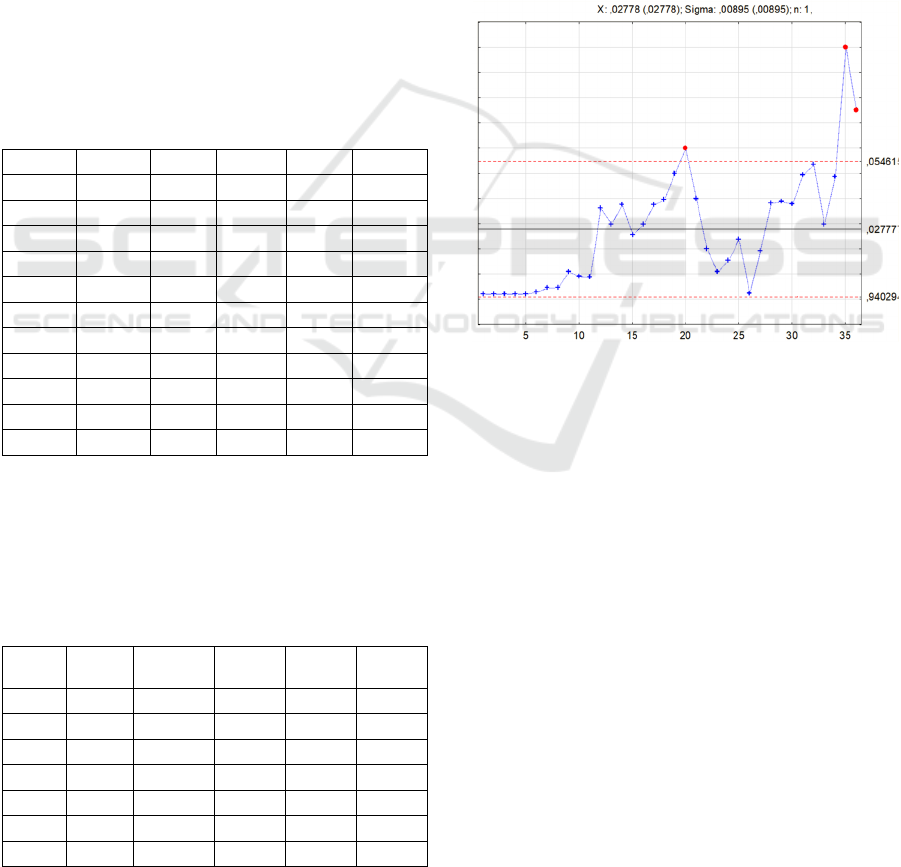
Figure 2: Control Diagram - variable EP3.
As can be seen in figure 2 for the case of the
variable EP3 that represents the execution of project
# 3, it can be said that the process was under control,
however, as part of the project management tasks, it
should be examined why three points were considered
"out of control", the fact that the points are outside the
limits of the process, although they give the alert that
something happened, will not always mean that
something was "wrong", and as was mentioned it is a
task of management of projects that must be included
in the lessons learned with their respective analyzes
that will allow continuous improvement of the
process.
As can be seen in Table 3, different coefficients of
variability are given for each of the parameters and it
can be seen that the variable EP5 has the highest value,
even when the variability of initial planning is less,
which translates into that not necessarily the entire
construction processes ended with a low variability due
to the lengthening of the execution period, but the
Assessing Project Progress Planning using Control Diagrams and Neural Network Prediction for Shipbuilding Projects in an Ecuadorian
Shipyard
63
average percentage of execution was less than
planning, this, in turn, varies the control limits.
4.3 Analysis of Variables and
Estimation of Percentages of
Progress
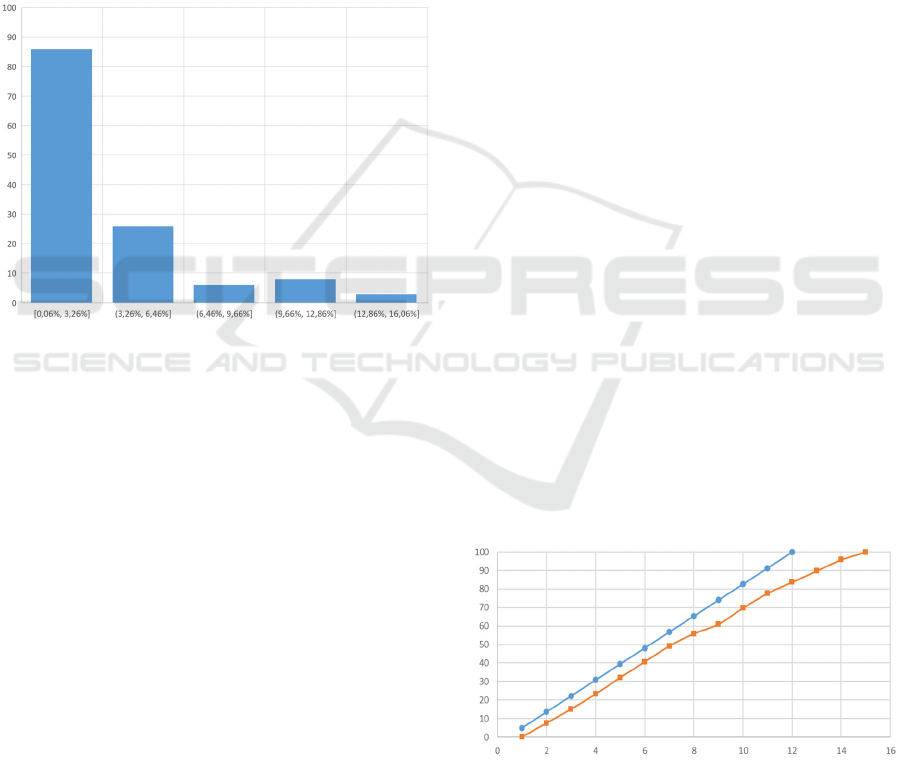
Among the analysis, the first point is the presentation
of the frequencies, which will allow establishing the
progress values within a "normal" working range of
the company, for example, in the shipyard, it can be
seen that the majority of the time used an effort of up
to 9.6% more frequently, so the values greater than
10% per month are not realistic.
Figure 3: Actual direct frequency diagram.
The first action to be taken is to define those
variables that will be included for the calculation of
the predictions, for a better understanding by way of
example, the following idea can be proposed:
• If the project is intended to be executed in a
planned time T, the projects to be chosen must
have at least T + 1 amount of data.
• The data of projects that are in execution, they can
be considered for the estimation as well as their
planning as long as the previous condition is met.
• The data pertaining to the actual execution
completed for each project will be selected, that
is, EPi.
Choosing the data is a vitally important task since
the regressions to calculate the number of X
approximations require the same amount of data as
the base, that is, it uses data one by one.
On the other hand, there is information regarding
project management concepts, such as the use of EV
which is closely linked to the costs and resources
used, although this is the standard methodology for
project evaluation, it is worth mentioning that the
percentages of Execution of shipbuilding projects
presented here are carried out with the joint
evaluation of the project management component and
the execution component (manufacturing).
The proposed methodology will be applied to two
similar shipbuilding projects that have different
schedules, different project managers, and different
execution times, showing the results of the proposed
data analysis numerically and graphically.
4.3.1 Estimated Monthly Percentages of
Progress
If we apply the neural network method or any other
existing tool, such as the tree regression method or
any other regression model, it will show us different
results. It is clear that the examination of these results
is crucial to know if they are adequate or not.
When neural networks are applied, the output data
is based on "weight" values before continuing to its
next phase of internal analysis, so the larger the data
for the dependent variables, the approximation and
mean error will decrease, however, as mentioned,
they act on dependent and independent variables or
factors, in this particular case and since the
percentages recorded are total values and there is no
data on the partial values that compose it, it will be
assumed that the dependent variables are the
schedules of the current projects to evaluate, and the
dependents will be the data recorded as actual or
executed progress of the projects.
The neural network based on Multi-layer
perceptron (MLP) was used to develop this case,
having a maximum number of hidden layer 50 and
“batch” training. Batch training is used in case where
the dataset is small, which is this case.
Applying neural networks in both projects and
superimposed on the total progress curves we will
have the following results:
Figure 4: Accumulated Progress Curve PPA7.2.
The orange line represents the MLP result, and the
blue one the baseline planned by the project manager.
IN4PL 2020 - International Conference on Innovative Intelligent Industrial Production and Logistics
64
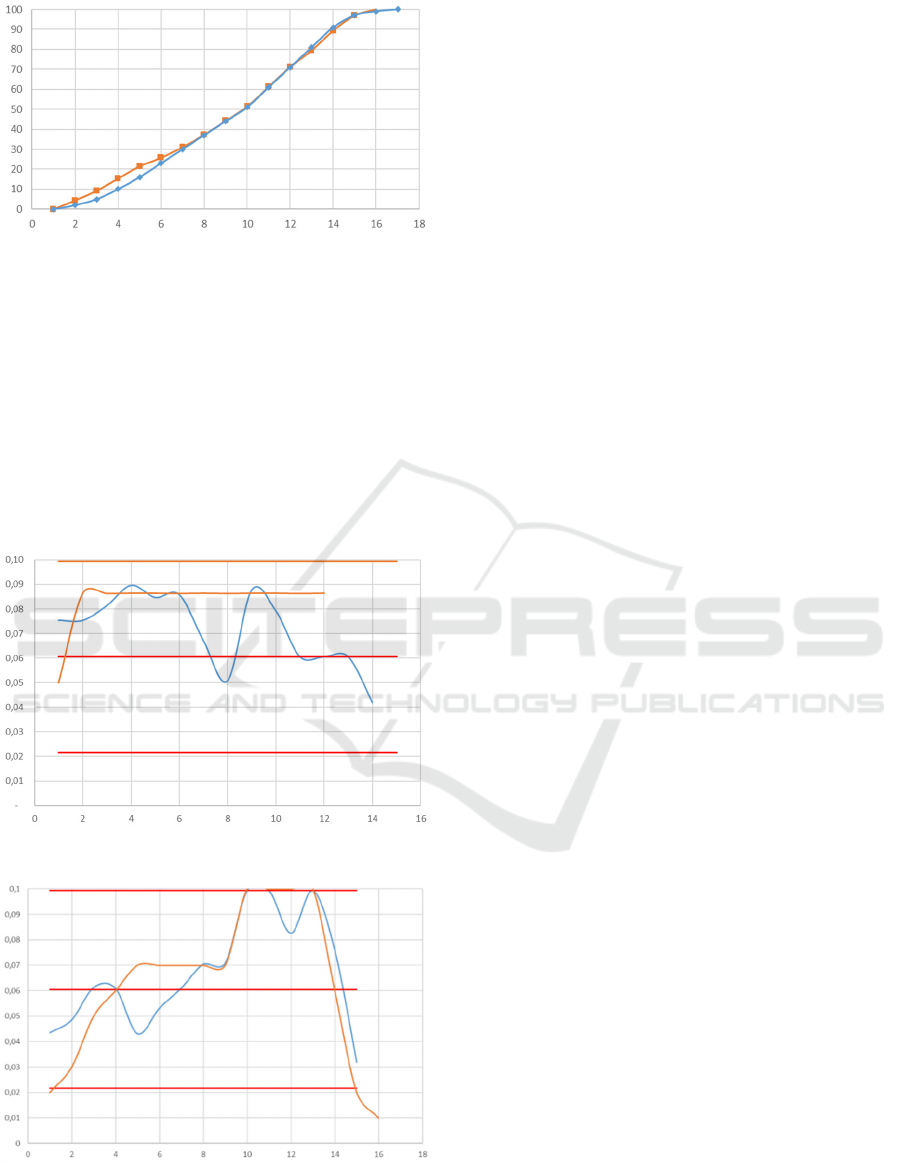
Figure 5: Accumulated Progress Curve PPA8.1.
On the other hand, although the accumulated
progress curves are important, the monthly progress
effort curves must be analyzed, this will give
information to validate or not the presented approach,
to easily observe the result, the aforementioned
control charts are shown where the curves overlap
and the confidence intervals can be seen.
Confidence intervals are determined by
calculating the mean and standard deviation. Figure 6
and 7 show the confidence interval, the mean, and the
respective curves for both cases.
Figure 6: Monthly Progress Curve PPA7.2.
Figure 7: Monthly Progress Curve PPA8.1.
Maintaining the reference of the proposed colors,
in both figures, it can be seen how the estimated
values that apply the neural network present a low
effort at the beginning and later reach their peak to
decrease, and in the same way, in the first project
despite Being within the control limits, the effort is
constant for 80% of the time and, according to the
forecast, it cannot be completed on time.
On the other hand, in the second graph, we see that
the trends are similar, and the project can even be
completed before the planned time and be within the
confidence limits.
4 CONCLUSIONS
While some data exists in the shipyard, they are not
used by project managers and the project office for
analysis, it can be verified because the projects show
multiple rescheduling.
Statistical control supports the decision-making
because it can show an “apparent effort” and if
production personnel is applying the needed effort to
achieve the objective.
The next stage is to examine the shipbuilding
activities and processes such as: welding, piping,
electrical, equipment, carpentry and painting process,
which make up the total percentages used in this
document in order to determine the critical process
and the significances for the projects.
Since the progress percentages are directly related
to the work effort; translated into the use of human
resources, this form of planning will allow a better
distribution of the shipyard's resources.
Neural network prediction can be applied in order
to support the initial baseline estimation.
Using control parameters and reliability
engineering concepts is useful in determining the best
lead percentage distribution options.
Analyzing business behavior patterns are
necessary to improve decision-making in the case of
the shipyard in order to carry out projects with short
completion times (6-8 months) of complexities
similar to those already executed, the shipyard's
production department should increase its capacity
and capability, for this, it is necessary to analyze the
productivity parameters of the shipyard and its KPIs.
If the shipyard applies data analysis, problems like
delays or incorrect planning could be corrected.
From personal experience and knowledge, only
one shipyard in Ecuador uses a project management
methodology and records data, so this document can
help shipyards or dry docks in Ecuador to realize the
importance of data collection and analysis.
Assessing Project Progress Planning using Control Diagrams and Neural Network Prediction for Shipbuilding Projects in an Ecuadorian
Shipyard
65

REFERENCES
Arena, M. V., Birkler, J., Schank, J. F., & Riposo, J. (2005).
Monitoring the progress of shipbuilding programmes:
How can the Defence Procurement Agancy more
accurately monitor progress? Santa Monica: Rand
Corporation.
Badiru, A., Badiru, A., & Badiru, A. (2008). En Industrial
Project Management: Concepts, Tools, and Techniques
(págs. 145-185). Boca Rato, FL: CRC Press.
Evans, J. (1959). Basic Design Concept. Naval Engineers
Journal, 671-678.
Harry, M. J., Mann, P. S., De Hodgins, O. C., Hulbert, R.
L., & Lacke, C. J. (2010). Practicioner’s Guide for
Statistics and Lean Six Sigma for Process
Improvement. Hoboken: John Wiley & Songs Inc.
Hines, W. W., & Montgomery, D. C. (2004). Probability
and Statistics for Engineering. México: CECSA.
Hoop, W. J., & Spearman, M. L. (2008). Factory Physics.
Long Grove, Illinois: Waveland Press, Inc.
Kim, B. C. (December de 2007). Forecasting Project
Progress and Early Warnig of Project Overruns with
Probabilistic Methods. PhD dissertation. Texas: A&M
University.
King, S. C. (2016). Unerstanding the Industrial Design. En
Chapter 1 (págs. 1-35). O'REILLY.
Lledó, P., Rivarola, G., Mecaru, R., & Cucchi D, E. J.
(2006). En Administración LEAN de proyectos
Eficiencia en la gestión de múltiples proyectos (págs. 1-
7; 10; 15-31; 148-149). México: Pearson Pentice Hall.
Project Management Institute. (2017). A Guide to the
Project Management Body of Knowledge (PMBOK®
Guide). Newtown Square, Pennsylvania: PMI, Inc.
Shrouf et al. (2014). Smart Factories in Industry 4.0: A
review of the Concept and of Energy Management
Approached in Production Based on the Internet of
Things Paradigm.
Sukholov, Y. A. (2018). Industry 4.0: Industrial Revolution
of the 21st Century. En The Notion, esscence, and
peculiarities of Industry 4.0 as a Sphere of Industry
(págs. 3-11). Moscow: Springer International
Publishing AG.
IN4PL 2020 - International Conference on Innovative Intelligent Industrial Production and Logistics
66

APPENDIX
Table 4: Dispersion Measurement Calculation Results.
Proj. Mean Variance Std.Dev. Coef.Var. Std.Err.
PP1
0,107500 0,002021 0,044960 41,8235 0,015896
EP1
0,100000 0,001307 0,036157 36,1566 0,011434
PP2,1
0,166667 0,003777 0,061455 36,8728 0,025089
PP2,2
0,142857 0,004440 0,066637 46,6458 0,025186
PP2,3
0,125000 0,005571 0,074642 59,7136 0,026390
PP2,4
0,111111 0,006049 0,077773 69,9955 0,025924
PP2,5
0,100000 0,006322 0,079512 79,5124 0,025144
PP2,6
0,090909 0,006477 0,080482 88,5307 0,024266
EP2
0,090909 0,006477 0,080482 88,5307 0,024266
PP3,1
0,038708 0,001054 0,032470 83,8853 0,006494
PP3,2
0,032258 0,000824 0,028705 88,9842 0,005155
PP3,3
0,031216 0,000519 0,022789 73,0064 0,004029
PP3,4
0,027778 0,000625 0,024992 89,9705 0,004165
EP3
0,027778 0,000533 0,023077 83,0755 0,003846
PP4,1
0,027778 0,000172 0,013117 47,2223 0,002186
PP4,2
0,021277 0,000067 0,008174 38,4175 0,001192
PP4,3
0,021277 0,000049 0,006987 32,8372 0,001019
EP4
0,021277 0,000049 0,006987 32,8372 0,001019
PP5,1
0,100000 0,003831 0,061892 61,8921 0,019572
PP5,2
0,100000 0,005612 0,074911 74,9109 0,023689
PP5,3
0,083333 0,006026 0,077626 93,1514 0,022409
PP5,4
0,071429 0,006008 0,077510 108,5141 0,020715
PP5,5
0,066667 0,005919 0,076933 115,3993 0,019864
PP5,6
0,062500 0,005802 0,076170 121,8714 0,019042
EP5
0,062500 0,005802 0,076170 121,8714 0,019042
PPA6,1
0,055556 0,001608 0,040094 72,1691 0,009450
PPA6,2
0,047619 0,001476 0,038418 80,6782 0,008384
EPA6
0,030543 0,000554 0,023542 77,0780 0,006292
PPA7,1
0,083333 0,000110 0,010497 12,5969 0,003030
PPA7,2
0,083333 0,001679 0,040973 49,1676 0,011828
PPA7,3
0,071429 0,000798 0,028245 39,5435 0,007549
EPA7
0,090000 0,000720 0,026833 29,8142 0,010954
PPA8,1
0,062500 0,000873 0,029552 47,2835 0,007388
PPA8,2
0,062500 0,000900 0,030000 48,0000 0,007500
EPA8
0,050000 0,000440 0,020976 41,9524 0,008563
PPA9,1
0,030303 0,000387 0,019670 64,9107 0,003424
PPA10,1
0,062500 0,001033 0,032146 51,4328 0,008036
Assessing Project Progress Planning using Control Diagrams and Neural Network Prediction for Shipbuilding Projects in an Ecuadorian
Shipyard
67

Table 5: Cumulative Progress Data Planned and Executed by Projects (Example of 02 Projects).
N Project N° 3 Project N° 4
T PP3,1 PP3,2 PP3,3 PP3,4 EP3 PP4,1 PP4,2 PP4,3 EP4
0
0,00% 0,00% 0,00% 0,00% 0,00% 0,00% 0,00% 0,00% 0,00%
1
0,20% 0,20% 0,20% 0,21% 0,21% 1,00% 1,00% 1,00% 1,00%
2
0,41% 0,41% 0,41% 0,42% 0,42% 2,00% 2,00% 2,00% 2,00%
3
0,63% 0,63% 0,63% 0,63% 0,63% 3,00% 3,00% 3,00% 3,00%
4
0,83% 0,83% 0,83% 0,84% 0,84% 4,00% 4,00% 4,00% 4,00%
5
1,04% 1,04% 1,04% 1,04% 1,04% 5,50% 5,00% 5,00% 5,00%
6
1,81% 1,81% 1,81% 1,33% 1,33% 7,00% 6,00% 6,00% 6,00%
7
2,36% 2,36% 2,36% 1,80% 1,80% 9,00% 7,00% 7,00% 7,00%
8
3,71% 3,71% 3,71% 2,27% 2,27% 11,00% 8,50% 8,50% 8,50%
9
5,10% 5,10% 5,10% 3,35% 3,35% 14,00% 10,00% 10,00% 10,00%
10
6,38% 6,38% 6,38% 4,26% 4,26% 17,00% 12,00% 12,00% 12,00%
11
7,55% 7,55% 7,55% 5,16% 5,16% 23,50% 14,00% 14,00% 14,00%
12
10,37% 10,37% 10,37% 8,76% 8,76% 27,00% 16,00% 16,00% 16,00%
13
13,26% 13,26% 13,16% 11,75% 11,75% 30,00% 18,00% 18,00% 18,00%
14
16,69% 16,73% 16,55% 15,52% 15,52% 34,00% 20,00% 20,00% 20,00%
15
21,86% 19,95% 19,73% 18,07% 18,07% 38,00% 23,00% 23,00% 23,00%
16
29,08% 23,20% 22,75% 21,04% 21,04% 42,00% 26,00% 26,00% 26,00%
17
36,48% 27,17% 26,49% 24,80% 24,80% 46,00% 29,00% 29,00% 29,00%
18
43,89% 31,59% 30,58% 28,77% 28,77% 51,00% 32,00% 32,00% 32,00%
19
50,65% 36,64% 34,84% 33,77% 33,77% 55,00% 35,00% 35,00% 35,00%
20
59,16% 44,50% 40,69% 39,77% 39,77% 59,00% 38,00% 38,00% 38,00%
21
67,16% 52,29% 48,19% 43,75% 43,75% 63,00% 41,00% 41,00% 41,00%
22
74,41% 59,87% 52,96% 45,74% 45,74% 67,00% 44,00% 44,00% 44,00%
23
82,32% 67,28% 58,51% 46,84% 46,84% 71,00% 47,00% 47,00% 47,00%
24
88,68% 75,54% 64,32% 48,39% 48,39% 74,00% 50,00% 50,00% 50,00%
25
96,77% 83,38% 71,19% 50,76% 50,76% 77,00% 52,00% 52,00% 52,00%
26
93,77% 90,30% 78,42% 51,00% 51,00% 80,00% 54,00% 54,00% 54,00%
27
98,64% 95,86% 85,52% 52,06% 52,91% 83,00% 56,00% 56,00% 56,00%
28
99,13% 98,41% 88,46% 57,24% 56,71% 86,00% 60,00% 60,00% 60,00%
29
99,61% 99,81% 91,65% 60,95% 60,60% 88,00% 62,00% 62,00% 62,00%
30
99,80% 99,99% 94,68% 68,39% 64,39% 90,00% 63,00% 63,00% 63,00%
31
100,00% 100,00% 97,72% 76,75% 69,32% 92,00% 65,00% 65,00% 65,00%
32
99,89% 86,26% 74,66% 94,00% 67,00% 67,00% 67,00%
33
10,00% 91,80% 77,63% 96,00% 69,00% 69,00% 69,00%
34
96,60% 82,50% 98,00% 71,00% 71,00% 71,00%
35
99,80% 92,50% 99,00% 73,00% 73,20% 73,20%
36
100,00% 100,00% 100,00% 75,00% 75,40% 75,40%
37
77,00% 77,60% 77,60%
38
79,00% 79,90% 79,90%
39
81,00% 82,10% 82,10%
40
83,00% 84,30% 84,30%
41
85,00% 86,60% 86,60%
42
87,00% 88,80% 88,80%
43
89,00% 91,00% 91,00%
44
91,00% 93,30% 93,30%
45
93,00% 95,50% 95,50%
IN4PL 2020 - International Conference on Innovative Intelligent Industrial Production and Logistics
68
