
Internal and External Factor Analysis in Bottleneck Detection in Shop
Sales: The Case of Grocery Shops in Lithuania
Detlef Hartleb
1,2
, Andreas Ahrens
1
, Ojaras Purvinis
3
, Jelena Za
ˇ
s
ˇ
cerinska
1,4
and Diana Micevi
ˇ
cien
˙
e
5
1
Hochschule Wismar, University of Technology, Business and Design, Wismar, Germany
2
ETSIST, Universidad Polit
´
ecnica de Madrid, Madrid, Spain
3
Kaunas University of Technology, Kaunas, Lithuania
4
Centre for Education and Innovation Research, Riga, Latvia
5
Panev
˙
e
ˇ
zys University of Applied Sciences, Kaunas, Lithuania
Keywords:
Buyers’ Burstiness, Cashiers’ Bottleneck, Payment Process, Buyers’ Waiting Time in the Queue to the Cash
Register, Payment Processing Time at the Cash Register.
Abstract:
The optimization of supermarket processes as well as the increase in productivity and profitability of shop sales
requires extensive knowledge of bottlenecks within the sales processes as bottlenecks limit the capacity of shop
sales. Bottlenecks refer to bursty processes in analogy to the occurrence of bit-errors in data transmission
systems. The aim of the paper is to analyse external and internal factors in shop sales underpinning the
examination of external and internal factors in shop sales based on the collected data of two supermarkets in
Lithuania. In this context, concentrated arrival of customers is identified as an external factor. By internal
factors, the buyers’ waiting time in the queue to the cash register as well as the payment processing time at the
cash register are meant. In this work the internal factors of the payment process are modelled by gap processes
where the obtained parameters such as the buyers’ concentration and the buyers’ probability allow a good
comparison of the payment related processes. This work aims at achieving customer quality improvement
through prevention of queuing. The obtained results show that the waiting time in the queue to the cash
register is quite bursty whereas the payment processing time at the cash register is quite regularly distributed.
Therefore, the conclusion can be drawn that at the cash register short periods of high activities are followed
by longer periods of inactivity.
1 INTRODUCTION
The optimization of supermarket processes as well
as the increase in productivity and profitability of
shop sales requires extensive knowledge of bottle-
necks within the sales processes. By bottlenecks, cus-
tomers that arrive at a rate that exceeds the processing
system rate are meant (Ahrens et al., 2019c). Bottle-
necks can appear due to external and internal factors.
A concentrated arrival of customers is defined as the
external factor. Buyers’ waiting time in the queue to
the cash register and the payment processing time at
the cash register are determined as the internal fac-
tors. Within the present work, by customers shop vis-
itors and buyers are meant. A shop visitor is someone
who visits the shop, but does not buy anything in this
shop, and a buyer is defined as one who has purchased
something in the shop.
Customer satisfaction is one of the key factors
strongly influencing the success or failure of a busi-
ness. It is important to track the customer satisfaction
in order to make the customers more loyal (Micevi-
ciene et al., 2018). Despite the efforts of scientists and
researchers to investigate the customer characteristics
(e.g. satisfaction, customer buying characteristic, re-
purchase behavior) (Mittal and Kamakura, 2001; Ku-
mar et al., 2016), this work is aiming to achieving
customer quality improvement through prevention of
queuing as waiting lines or queues are still a com-
mon phenomenon in life, and long waiting times at
the cash register are still an indicator of customer dis-
satisfaction.
When analyzing the customer flow through the
shop, it should be pointed out that bottlenecks can
emerge in any single process within the shop (e. g. at
the butcher station, at the bakery station or at the cash
register). Bottlenecks appear when the capacity of a
shop’s single process is less or equal than designed
Hartleb, D., Ahrens, A., Purvinis, O., Zaš
ˇ
cerinska, J. and Micevi
ˇ
cien
˙
e, D.
Internal and External Factor Analysis in Bottleneck Detection in Shop Sales: The Case of Grocery Shops in Lithuania.
DOI: 10.5220/0009983800530060
In Proceedings of the 10th International Conference on Pervasive and Parallel Computing, Communication and Sensors (PECCS 2020), pages 53-60
ISBN: 978-989-758-477-0
Copyright
c
2020 by SCITEPRESS – Science and Technology Publications, Lda. All rights reserved
53
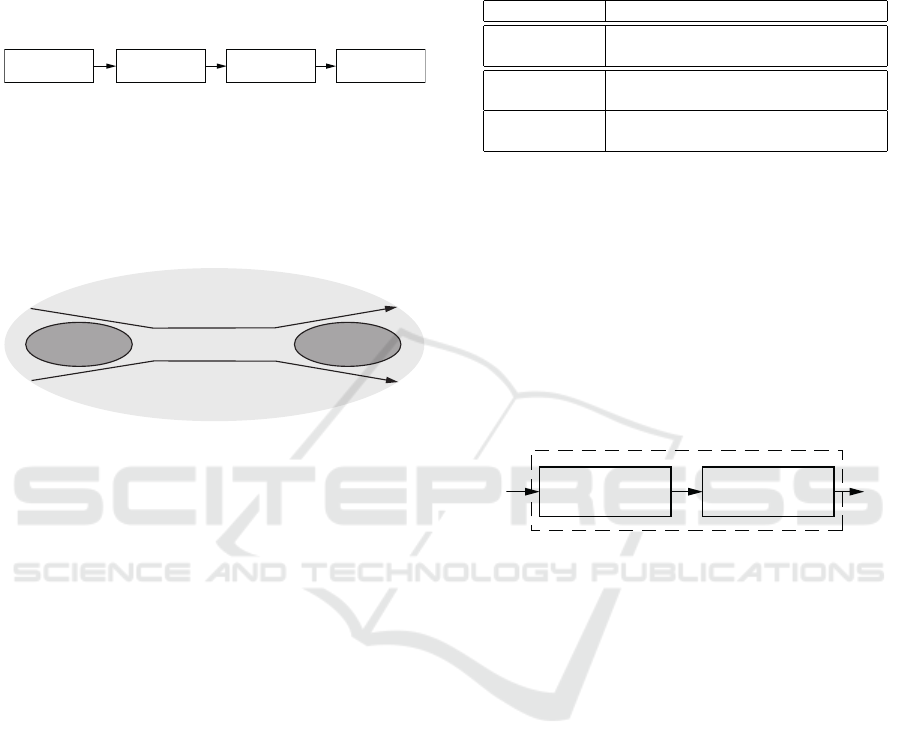
i. e. any single process, whose utilization is 100 %
or more, within the buying process chain. By buying
process chain, the customer arrival at the shop, the se-
lection of goods, the payment process which includes
both waiting in the queue to the cash register and the
payment processing at the cash register as well as the
customer departure is meant (see also Fig. 1).
Phase 1:
customer arrival
Phase 2:
selection of goods
Phase 3:
payment process
Phase 4:
departure
Figure 1: Phases of the buying process chain.
Therefore, any bottleneck will halt the continuous
flow of customers throughout the shop. Fig. 2 demon-
strates a bottleneck in shop sales created by internal
and/or external factors whereas in this work the focus
is put on studying and modelling internal factors only.
Phase 1+2: Shop
Visitor/Customers
Phase 3: Bottleneck
at the cash register
Phase 4: Shop
Buyers
Figure 2: Bottleneck in shop sales when analysing the pay-
ment process according to Fig. 1.
As bottlenecks refer to bursty processes in anal-
ogy to the occurrence of bit-errors in data transmis-
sion systems or the arrival of TCP packets in com-
munication networks (Kessler et al., 2003), the aim
of the paper is to analyse external and internal fac-
tors in shop sales underpinning the examination of
factors in shop sales based on the collected data of
two supermarkets in Lithuania. Factors introducing
burstiness as a means of bottlenecks in the shopping
process are given in Tab. 1. The literature reveals
three different approaches to factor analysis, namely,
PEST (Political, Economic, Social and Technolog-
ical) (Sammut-Bonnici and Galea, 2015), SWOT
(Strengths, Weaknesses, Opportunities and Threats)
(G
¨
urel, 2017) as well as external and internal factors
(Ahrens and Za
ˇ
s
ˇ
cerinska, 2014). Analysis of these
three approaches allows concluding that external and
internal factors are also part of PEST and SWOT.
Consequently, the approach of external and internal
factors is applied in the present work, whereas fac-
tor is defined as a reason of change of a phenomenon.
It should be noted that external factors refer to exter-
nal situations such as the concentrated arrival of cus-
tomers at the shop. In turn, internal factors are con-
ventionally regulated by a shop itself. It is worth not-
ing that bottlenecks within the process chain of sell-
ing and buying are limiting the capacity of shop sales.
Thus, a proper description of bottlenecks will help to
increase the productivity of shop sales.
Table 1: External and internal factors that influence bottle-
necks in shops.
Classification Description
external concentrated arrival of customers or
visitors at the shop
internal waiting time in the queue to
the cash register
internal payment processing time at
the cash register
In this work only the internal factors such as the
waiting time in the queue to the cash register and pay-
ment processing time at the cash register (further re-
ferred as buyers’ service time) are studied and mod-
elled as highlighted in Fig. 3. It should be pointed out
that, while the payment processing time is usually de-
termined by technological limits (scanning of the pur-
chased goods, the paying process itself) and the expe-
rience of the sales staff, bottlenecks can be identified
by analyzing the free time intervals between buyers at
the cash register.
waiting in the queue
to the cash register
payment
processing time
Phase 3: payment process
Figure 3: Elements of payment process (Phase 3).
Apart from that, the payment processing time
gives a good insight into the buyers’ behaviour, find-
ing out if the buyers consistently buy few articles or
many articles.
It should be pointed out that, in this work, the ex-
amination of the buyers’ waiting time in the queue
to the cash register is equivalent to the analysis of
cashier free time intervals between two buyers. Here,
it is expected that a high level of burstiness indicates
that long free time intervals at the cash register are
followed by many short free time intervals.
The question of the utilization of cash registers
plays a central role when optimizing the productivity
and profitability of shop sales. For example, buyers
may appear in a very concentrated (bursty) manner at
the checkout, which may result in short breaks (short
free times at the cash register) between the individual
payment processes followed by longer breaks (Fig. 4).
On the other hand, it is important to know whether the
buyers’ service time differs under the assumption of
bursty cashier free time intervals.
In this paper, gap-based models known from data
transmission systems are used for bottleneck identi-
fication in grocery shops in Lithuania. The obtained
PECCS 2020 - 10th International Conference on Pervasive and Parallel Computing, Communication and Sensors
54

time (in s)
buyers
service
free time
of
cash register
free time
of
cash register
buyers
service
Figure 4: Interplay of buyer free time intervals and buyer
service times at cash register.
parameters such as the buyers’ concentration and the
buyers’ probability allow a good analysis of the flow
of shop customers. The validation of the obtained re-
sults will be carried out using the data of two super-
markets of different sizes in Lithuania.
The novelty of this paper is given by the analy-
sis of internal factors in bottleneck detection through
a comparison of different approaches for measuring
burstiness in real shop processes. Internal factors are
investigated through the waiting time in the queue to
the cash register as well as the payment processing
time at the cash register. It is worth noting that this pa-
per is dedicated to the payment process by jointly de-
scribing and modelling the waiting in the queue to the
cash register as well as the payment processing time
at the cash register by gap processes. Describing each
process by gaps individually, the payment process can
be modelled by two independent gap-processes with
different parameters. Exemplary, gap parameters for
modelling and simulation are found by analyzing the
payment process of two supermarkets in Lithuania.
The remaining part of this paper is organized as
follows: Section 2 introduces the theoretical basis for
internal factors in bottleneck detection. The distribu-
tion of buyers within bursty environments for bottle-
neck analysis is given in Section 3 followed by ap-
proaches for measuring burstiness in bursty business
processes in Section 4. The associated results of an
empirical study of different grocery shops in Lithua-
nia are discussed in Section 5. Finally, some conclud-
ing remarks are provided in Section 6.
2 BURSTY BUSINESS
PROCESSES
In general, any process including the process of buy-
ing in which binary decisions are made can be de-
scribed by gaps as illustrated in Fig. 5 (Ahrens et al.,
2019b).
- x - - x - - x - - - x x - - - - x -
2 2 3 40
Figure 5: Modelling of the buying process by gaps (a buyer
(represented by ”x”) within a sequence of non-buying visi-
tors (represented by ”-”)).
When neglecting the payment processing times
(also referred as buyers’ service times), gap processes
appear when describing the free time intervals be-
tween buyers at the cash register as highlighted in
Fig. 5. The process of buying can be defined by buyer
probability p
e
as well as buyer concentration (1 − α)
(Wilhelm, 1976; Ahrens, 2000). A customer becomes
with the probability p
e
a buyer and remains with the
probability (1 − p
e
) a visitor. On the other hand, the
payment processing time at the cash register can be
modelled by gaps as well. Therefore the payment
process can be modelled by two independent gap pro-
cesses, namely the description of the waiting time in
the queue to the cash register and the payment pro-
cessing time at the cash register.
The distribution of the gaps (e. g. describing free
time intervals between two buyers) can be described
by a gap distribution function u(k) defining the prob-
ability that a gap Y between two buyers is greater than
or at least equal to a given number k, i. e.
u(k) = P(Y ≥ k) . (1)
A bursty behaviour could emerge, if u(k) is dif-
ferent from the exponential distribution function
(Kessler et al., 2003; Weisstein, 1999). Next to gap-
distributions described by one parameter such as the
beforehand mentioned exponential, distribution func-
tions such as Weibull (Weisstein, 1999; Kessler et al.,
2003) or Wilhelm (Wilhelm, 1976), which depend on
two parameters, allow a greater precision when de-
scribing bursty business processes known from bit-
errors in telecommunications (Ahrens, 2000) as well
as the characteristic of transmission control protocol
(TCP) connection arrivals (Feldmann, 2000; Kessler
et al., 2003) or when analyzing the internet traffic
(Zukerman et al., 2003; Kresch and Kulkarni, 2011).
The distribution function u(k), published by Wil-
helm (Wilhelm, 1976), is defined by the parameters,
namely buyer probability p
e
and buyer concentration
(1 − α ), and results for bursty business processes (in-
cluding shop sales) in
u(k) = [(k + 1)
α
− k
α
] · e
−β·k
. (2)
with the parameter β defined by
p
e
≈ β
α
. (3)
For independent buyers, the buyers’ concentration re-
sults in (1 − α) = 0, whereas for practically relevant
bursty buyers’ processes, a buyer concentration in the
range of 0 < (1 − α) ≤ 0,5 can be expected. The
gap distribution function defined in (2) is of a high
level of practical relevance as the function was found
by analysing bit-errors in short-wave communication
channels (Wilhelm, 1976) and confirmed by analyz-
ing packet arrivals in TCP connections (Kessler et al.,
2003).
Internal and External Factor Analysis in Bottleneck Detection in Shop Sales: The Case of Grocery Shops in Lithuania
55

3 DISTRIBUTION OF BUYERS
WITHIN BURSTS
Bottlenecks as a capacity constraint can appear if
more buyers, who require service, than expected are
in the shop. Customers might have to wait because
their number exceeds the number of expected ones.
In this way the buyers appear in a bursty nature i. e.
a high number of buyers appears within a given time
interval and the flow of buyers throughout the shop
is limited (Ahrens et al., 2019a). When modelling
the payment process by gaps, a burst is based on the
buyer-visitor relationship and is defined as a pattern
which begins with a buyer and ends with a buyer,
when at least a visitors (who do not buy anything)
follow. The parameter a is also called the distance pa-
rameter (gap) between two buyers. If the gap after a
buyer is greater or equal compared to the distance pa-
rameter (gap) a, the burst is considered as terminated.
Fig. 6 highlights the burst definition with a = 3. The
burst ends, when the gap after a buyer is greater than
or equal to the distance parameter a (here in the ex-
ample a = 3), the proportion of these gaps is given by
the parameter u(a), i. e. the gap-distribution function
u(k).
Burstgap ≥ a gap ≥ a
Figure 6: Burst definition the distance parameter a = 3.
The number of bursts z
B
with the distance param-
eter a in a sample with z
f
-buyers results in
z
B
= z
f
· u(a) . (4)
From (4) the average number of buyers g within a
burst is calculated as
E{g} =
z
f
z
B
=
1
u(a)
. (5)
Tab. 2 shows the obtained parameters for different
values of a. The values obtained by simulations using
(2) show a good agreement with the theory using (4).
Assuming that the sample contains z
f
= 1000 buyers,
with the distance parameter a = 5 in total 957 bursts
for the memoryless buyer scenario (defined solely by
the buyers’ probability), but only 560 bursts for a sce-
nario with memory can be registered. This shows that
the number of buyers per burst increased when the
buyers’ concentration raised.
Fig. 7 illustrates the calculation of the buyers
within bursts. The Markov chain is started from state
B
i
i. e. it is assumed that the burst is already started
with a buyer. The Markov chain remains in state B
i
Table 2: Bursts z
B
at a buyers’ probability p
e
= 10
−2
for
different parameters of the buyers’ concentration (1 − α)
assuming z
f
= 1000 buyers.
(1 − α) a Simulation Theory
0,0 10 901 895
0,1 10 662 660
0,2 10 473 474
0,0 5 957 951
0,1 5 752 736
0,2 5 560 560
A
B C D
Figure 7: Buyers’ distribution using Markov chain.
as long as the occurring buyers belong to the burst i,
i. e. the gap to the previous buyer is shorter than a.
When jumping to the next buyer, the burst can be fin-
ished when the gap k ≥ a. The Markov chain is then
in state B
i+1
i. e. in the next burst.
The number of buyers per burst can be calculated
by the weight distribution P(g) resulting in:
P(g = 1) = u(a)
P(g = 2) = u(a) · [1 − u(a)]
.
.
. =
.
.
.
P(g) = u(a) · [1 − u(a)]
g−1
.
The obtained results in Fig. 8 confirm that with the in-
creasing buyers’ concentration (1−α) more and more
buyers per burst appear.
4 MEASUREMENT OF
BURSTINESS
The optimization of underlying business processes
such as the cashier free time intervals at the cash reg-
ister as well as the payment processing time intervals
require the estimation of the level of burstiness in or-
der to find appropriate parameters for the simulation
when using the gap-distribution function u(k). With a
known gap density function v(k) = P(Y = k), denot-
ing the probability that a gap Y of length k appears, the
buyers’ concentration (1 − α) can be obtained, when
analysing the probability that after a buyer, in the dis-
tance of zero another buyer appears, i. e.
v(0) = u(0) − u(1) . (6)
With u(0) = 1 we get
v(0) = 1 − u(1) = 1 −
h
(2
α
− 1)e
−β
i
. (7)
PECCS 2020 - 10th International Conference on Pervasive and Parallel Computing, Communication and Sensors
56

1 2 3
SCALE
0
0.5
1
PDF
caseXXXXXXXXX
case1
case2
Figure 8: Buyers distribution P(g) within the bursts for dif-
ferent parameters of the (1 − α) at a buyer’s probability of
p
e
= 10
−2
and a distance parameter of a = 5.
The expression can be simplified for small values of
β as
e
−β
≈ 1 for β 1 (8)
and the parameter v(0) can be expressed as
v(0) ≈ 2 − 2
α
. (9)
From this equation, the buyers’ concentration (1 − α)
is estimated as
(1 − α) ≈ 1 − log
2
[2 − v(0)] (10)
for the proposed gap model when analyzing exem-
plary the free time intervals between buyers at the
cash register. Tab. 3 shows the obtained values when
using (10) and (2) for estimating buyers’ burstiness.
As shown in (Ahrens and Za
ˇ
s
ˇ
cerinska, 2017) the
probability v(0) can be obtained as
v(0) =
E{number of neighbouring buyers}
E{number of buyers}
. (11)
Therein, the parameter E{·} denotes the expectation
functional. The number of neighbouring buyers are
counted when after a buyer immediately the next
buyer appears, i. e. the distance k between two buyers
is k = 0 (also referred as neighbouring buyers).
Goh & Barabasi (Goh and Barab
´
asi, 2008) pro-
vided an alternative solution for estimating burstiness
in business processes independent of the selected pro-
cess by taking the mean value m
1
(average gap length
or average length of free time intervals between two
buyers at the cash register) as well as the standard de-
viation σ of the length of time intervals or gaps into
account and is defined as
B =
σ − m
1
σ + m
1
, (12)
with −1 ≤ B ≤ 1. Whereas regular (deterministic)
processes are described by negative parameters of B,
Table 3: Obtained values for the buyers’ concentration (1 −
α) at a buyer’s probability of p
e
= 10
−2
using (10).
Theory 0,0 0,1 0, 2
Estimation 0,0071 0, 104 0,202
Table 4: Comparison of the estimated level of burstiness at
a buyer’s probability of p
e
= 10
−2
.
(1 − α) 0, 0 0,1 0,2
B (Theory) 0,0025 0, 18 0,34
B (Praxis) 0,0018 0,17 0, 33
bursty business processes are described by positive
parameters of B.
Analysing (12), a value B = −1 can be obtained
for any m
1
if σ = 0 and describes a completely reg-
ular (deterministic) process. In this case the density
function degenerates to a discrete line at m
1
, and the
whole process becomes deterministic. On the other
hand, B = 0 is considered as a neutral burstiness as
here σ = m
1
holds. Bursty business processes appear
for 0 ≤ B < 1, whereas the parameter B = 1 can be ob-
tained for m
1
= 0 for any σ. However, in the case of
non-negative random variables, the parameter m
1
= 0
appears just when all values are equal to zero. There-
fore B = 1 cannot be obtained practically.
Next to u(k) a gap density function v(k) defining
the probability that a gap Y between two buyers is
equal to a given number k, i. e.
v(k) = P(Y = k) (13)
can be defined. Taking v(k) into account, the gap dis-
tribution function u(k) results in
u(k) = v(k) + v(k + 1) + v(k + 2) + · ·· (14)
and the gap density function v(k) can be defined as
v(k) = u(k) − u(k + 1) . (15)
By taking v(k) into account, the mean value m
1
and
the variance σ
2
result in
m
1
=
∞
∑
k=0
k v(k) and σ
2
=
∞
∑
k=0
k
2
v(k) − m
2
1
. (16)
Analysing a buying process with independent buyers,
i. e. (1 − α) = 0, the parameter B results as shown in
(Ahrens et al., 2019a) in
B =
σ − m
σ + m
=
e
p
e
/2
− 1
e
p
e
/2
+ 1
. (17)
Tab. 4 shows the obtained parameters for the esti-
mated level of burstines described by the parameter
B when using (2). When using the gap-distribution
function v(k) defined in (15), the obtained parameter
B follows the buyers’ concentration (1 − α) in theory
as well as when analysing real visitor-buyer intercon-
nections.
Internal and External Factor Analysis in Bottleneck Detection in Shop Sales: The Case of Grocery Shops in Lithuania
57

5 GROCERY SHOPS IN
LITHUANIA
In order to analyse the level of burstiness, the duration
of the service times of the buyers at the cash register
as well as the free time intervals at the cash register of
two different shops (grocery shop and supermarket)
in Lithuania is studied in order to get appropriate pa-
rameters of the underlying gap distribution functions.
The collected cash register data, obtained from a sin-
gle cash register of each shop, contain the operation
time, the amount of goods purchased, their codes and
the prices paid by each buyer. The data collection was
carried out in June 2018 and September 2018.
Unfortunately, the cash registers do not record the
start time of the operation. Therefore, the service
duration time was not available from the database.
To cope with this problem we observed buyers’ ser-
vice durations with different quantities of goods (see
Tab. 5). It appeared, that the service duration t
s
de-
pends not only on the quantity of the goods, but also
on the type of goods, individual characteristics of the
buyer and other random factors, i. e. the dependence
is statistical. The correlation coefficient between n
g
and t
s
equals 0,72, and the regression equation is
given by
t
s
= 1,9n
g
+ 22,8 . (18)
The equation yields that for one good about 1,9 sec-
onds and additionally about 22,8 seconds for each
buyer are required. The data were collected in the
grocery shop, and it is assumed that all grocery shops
as well as supermarkets have similar performance as
they are working with similar equipment of cash reg-
isters and salespeople who are working at a similar
intensity. Knowing the quantity of goods and (18),
the start and end times of each buyer can be calcu-
lated. This allows us to analyse the free time intervals
between two buyers’ service.
In this work the payment process is jointly de-
scribed and modelled by independent gap processes
taking the waiting time in the queue to the cash regis-
ter as well as the payment processing time at the cash
register into account. By describing each process by
Table 5: Duration of the service at the cash register.
Amount of Goods Service Time
n
g
t
s
(ins)
3 44
1 18
10 30
1 11
18 61
1 37
gaps individually, the payment process can be mod-
elled by two independent gap processes with different
parameters as highlighted in Fig. 9.
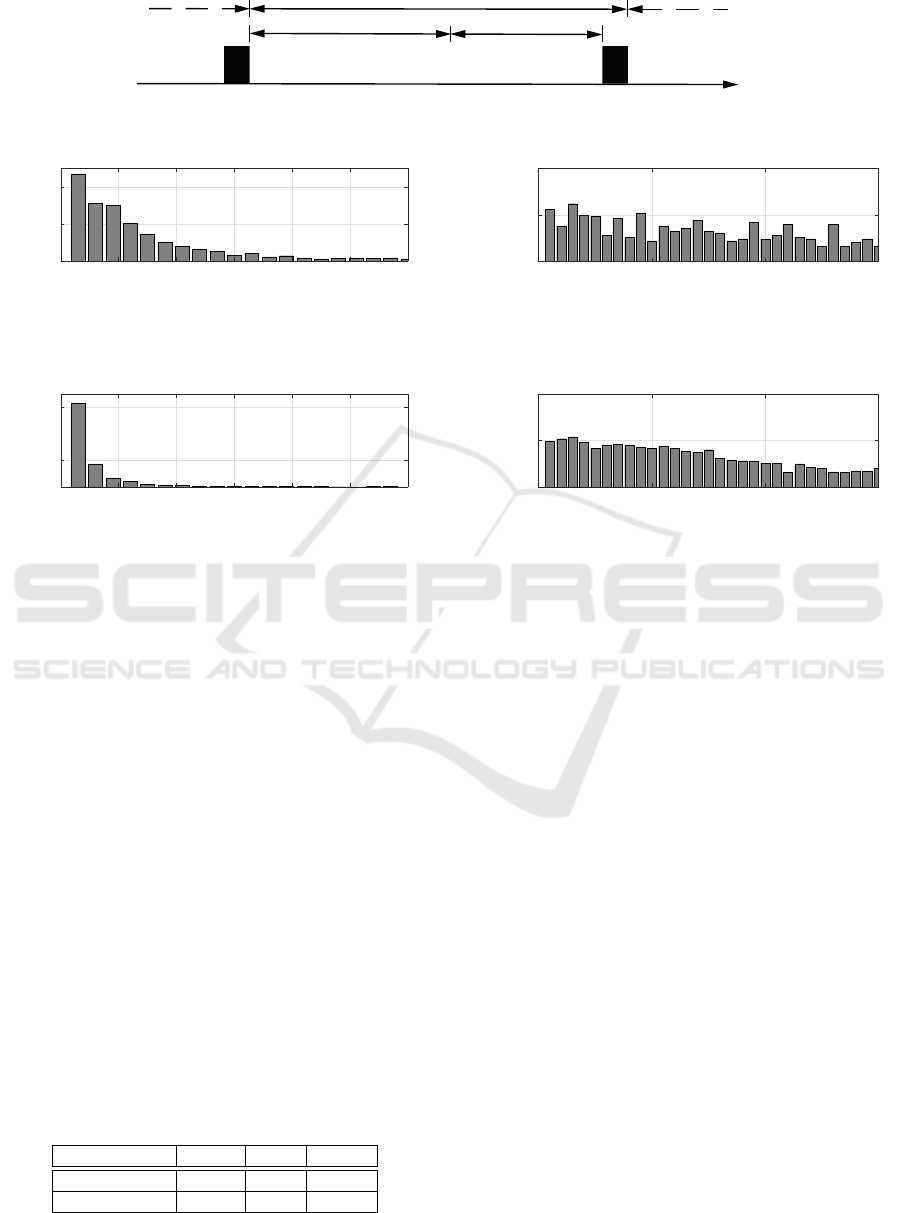
5.1 Free Times of Cash Register
The histograms of the free time intervals at the cash
register for the grocery shop are given in Fig. 10 and
for the supermarket in Fig. 11. Comparing both fig-
ures it turns out that the free times of cash regis-
ter are more bursty in the supermarket. Here, either
short free time intervals or significantly longer free
times intervals are recognized. Tab. 6 highlights the
calculated buyers’ burstiness for the two investigated
shops, described the burstiness parameter B. The ob-
tained data confirm a higher level of burstiness in the
supermarket compared with the grocery shop when
analysing the free time intervals between two buyers.
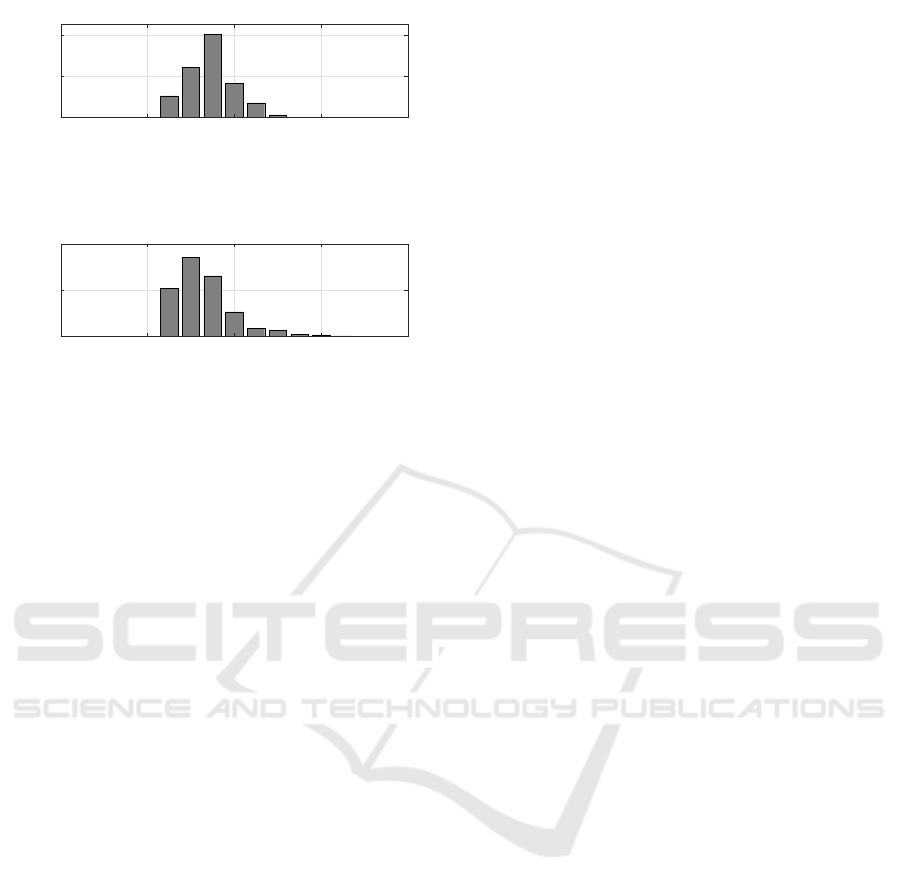
The probability of free times’ durations up to 30
seconds, i. e. half a minute, are shown in Fig. 12
for the grocery shop and in Fig. 13 for the supermar-
ket. Whereas these durations are quite similarly dis-
tributed in the case of the grocery shop, the durations
tend to be slightly exponentially distributed in case of
the supermarket. The obtained data of the buyer prob-
ability and buyer concentration confirm a higher level
of burstiness in the supermarket compared with the
grocery shop.
5.2 Buyers’ Service Time
Next to the free time intervals, the service times of
the buyers at the cash register are analysed. The cor-
responding service times are depicted in Fig. 14 for
the grocery shop and in Fig. 15 for the supermarket.
Tab. 7 highlights the levels of burstiness obtained by
analyzing the buyers’ service times for the two inves-
tigated shops.
It comes out that negative burstiness factor B of
the time t spent at the cash register shows a rather
predominantly neutral (deterministic) behaviour than
a burst-like behaviour. The burstiness parameters are
very similar comparing the two shops assuming that
the parameter depends on the consumer behaviour,
performance of cash register and of salesperson. It
confirms our initial assumption that all shops show a
similar performance as they work with similar equip-
Table 6: Buyer’s Burstiness when analyzing the free-time
intervals.
Shop m
1
σ B
Grocery Shop 234,1 s 620,1 s 0,45
Supermarket 96,9 s 408,7 s 0,62
PECCS 2020 - 10th International Conference on Pervasive and Parallel Computing, Communication and Sensors
58
time (in sec)
payment buyer
m
payment buyer
(m+1)
payment buyer
(m-1)
gap process I
(waiting time at cash register)
gap process II
(payment processing time)
Figure 9: Modelling the payment process by two independent gap processes.
0 100 200 300 400 500 600
SCALE
0
0.1
0.2
PDF
Figure 10: Distribution of free times of cash register
(grouped) at grocery shop.
0 100 200 300 400 500 600
SCALE
0
0.2
0.6
PDF
Figure 11: Distribution of free times of cash register
(grouped) at the supermarket.
ment as well as staff who received a standardized
training.
6 CONCLUSION
The work carried out within the present research al-
lows establishing the inter-connections between bot-
tleneck and burstiness. The theoretical analysis fa-
cilitated the creation of the model of shop sales pro-
cess in 4 phases. In this work the waiting times in
the queue to the cash register as well as the payment
processing times at the cash register were studied and
jointly modelled. The obtained results show that the
payment processing times at the cash register are quite
regular. However, analysis of the free time intervals at
the cash register allow drawing the conclusion on its
bursty behaviour. The bursty behaviour of the cashier
free time intervals implies long breaks that alternate
with many short breaks. The obtained parameters for
Table 7: Burstiness analyzing the buyers’ service times.
Shop m
1
σ B
Grocery Shop 32,1 s 5,1 s −0,73
Supermarket 30,8 s 7, 1 s −0, 62
0 10 20 30
SCALE
0
0.05
0.1
PDF
Figure 12: Distribution of free time duration up to 30 sec-
onds (grocery shop).
0 10 20 30
SCALE
0
0.05
0.1
PDF
Figure 13: Distribution of free time duration up to 30 sec-
onds (supermarket).
bottleneck description within the defined internal fac-
tors were verified by the empirical data collected in
grocery shops in Lithuania. The analysis of the col-
lected data resulted in the conclusion that the level of
burstiness depends on such factors as the consumer
behaviour, the waiting times in the queue to the cash
register, the payment processing time at the cash reg-
ister and the performance of salesperson or cashier.
The investigation carried out in this work results
in differentiation between external and internal fac-
tors in shop sales. The theoretical analysis highlights
three factors that influence shop sales, namely exter-
nal factor such as a concentrated arrival of customers
or shop visitors to the shop and internal factors such
as waiting times in the queue to the cash register and
payment processing time at the cash register.
The empirical study carried out in grocery shops
in Lithuania allowed concluding that the burstiness
parameter depends on consumer behaviour, perfor-
mance of cash register and performance of salesper-
son or cashier. Further research will focus on widen-
ing the dataset for empirical studies.
Internal and External Factor Analysis in Bottleneck Detection in Shop Sales: The Case of Grocery Shops in Lithuania
59
0 20 40 60 80
SCALE
0
0.2
0.4
PDF
Figure 14: Buyers service time (grocery shop).
0 20 40 60 80
SCALE
0
0.2
0.4
PDF
Figure 15: Buyers service time (supermarket).
REFERENCES
Ahrens, A. (2000). A new digital channel model suitable
for the simulation and evaluation of channel error ef-
fects. In Colloquium on Speech Coding Algorithms
for Radio Channels, London (UK).
Ahrens, A., Purvinis, O., Hartleb, D., Za
ˇ
s
ˇ
cerinska, J., and
Micevi
ˇ
ciene, D. (2019a). Analysis of a Business En-
vironment using Burstiness Parameter: The Case of a
Grocery Shop. In International Conference on Perva-
sive and Embedded Computing and Communication
Systems (PECCS), Vienna (Austria).
Ahrens, A., Purvinis, O., and Za
ˇ
s
ˇ
cerinska, J. (2019b).
Gap Distributions for Analysing Buyer Behaviour in
Agent-Based Simulation. In International Conference
on Sensor Networks (Sensornets), Prague (Czech Re-
public).
Ahrens, A., Purvinis, O., Za
ˇ
s
ˇ
cerinska, J., Micevi
ˇ
ciene, D.,
and Tautkus, A. (2019c). Burstiness Management for
Smart, Sustainable and Inclusive Growth: Emerging
Research and Opportunities. IGI Global.
Ahrens, A. and Za
ˇ
s
ˇ
cerinska, J. (2014). Factors that Influ-
ence Sample Size in Educational Research. In ATEE
Spring Conference ”Innovation and Challenges in Ed-
ucation”, pages 19–32, Klaipeda (Lithuania).
Ahrens, A. and Za
ˇ
s
ˇ
cerinska, J. (2017). Analysing Buyers
Burstiness in E-Business: Parameter Estimation and
Practical Applications. In International Conference
on e-Business (ICE-B), Madrid (Spain).
Feldmann, A. (2000). Characteristics of TCP Connection
Arrivals. In Park, K. and Willinger, W., editors, Self-
similar Network Traffic and Performance Evaluation,
chapter 15, pages 367–399. Wiley.
Goh, K.-I. and Barab
´
asi, A.-L. (2008). Burstiness and
Memory in Complex Systems. Exploring the Fron-
tiers of Physics (EPL), 81(4):48002.
G
¨
urel, E. (2017). Swot analysis: A theoretical review. Jour-
nal of International Social Research, 10:994–1006.
Kessler, T., Ahrens, A., Lange, C., and Melzer, H.-D.
(2003). Modelling of connection arrivals in Ethernet-
based data networks. In 4rd International Conference
on Information, Communications and Signal Process-
ing and 4th IEEE Pacific-Rim Conference on Multime-
dia (ICICS-PCM), page 3B6.6, Singapore (Republic
of Singapore).
Kresch, E. and Kulkarni, S. (2011). A poisson based bursty
model of internet traffic. In 2011 IEEE 11th Inter-
national Conference on Computer and Information
Technology, pages 255–260.
Kumar, A., Bezawada, R., Rishika, R., Janakiraman, R., and
Kannan, P. (2016). From Social to Sale: The Effects of
Firm-Generated Content in Social Media on Customer
Behavior . Journal of Marketing, 80(1):7–25.
Miceviciene, D., Purvinis, O., Glinskiene, R., and Tautkus,
A. (2018). Alternative Solution for Client Service
Management. Applied Research in Studies and Prac-
tice, 14(1):47–51.
Mittal, V. and Kamakura, W. (2001). Satisfaction, Repur-
chase Intent, and Repurchase Behavior: Investigat-
ing the Moderating Effect of Customer Characteris-
tics. Journal of Marketing Research, 38(1):131–142.
Sammut-Bonnici, T. and Galea, D. (2015). PEST Analysis,
pages 1–1. American Cancer Society.
Weisstein, E. W. (1999). The CRC Concise Encyclopedia of
Mathematics. CRC Press, Boca Raton and London.
Wilhelm, H. (1976). Daten
¨
ubertragung (in German).
Milit
¨
arverlag, Berlin.
Zukerman, M., Neame, T. D., and Addie, R. G. (2003). In-
ternet traffic modeling and future technology impli-
cations. In IEEE INFOCOM 2003. Twenty-second
Annual Joint Conference of the IEEE Computer and
Communications Societies, volume 1, pages 587–596
vol.1.
PECCS 2020 - 10th International Conference on Pervasive and Parallel Computing, Communication and Sensors
60
