On the Pareto Principle in Process Mining, Task Mining, and
Robotic Process Automation
Wil M. P. van der Aalst
a
Process and Data Science (PADS), RWTH Aachen University, D-52056 Aachen, Germany
Keywords:
Process Mining, Task Mining, Robotic Process Automation, Pareto Distribution.
Abstract:
Process mining is able to reveal how people and organizations really function. Often reality is very different
and less structured than expected. Process discovery exposes the variability of real-life processes. Confor-
mance checking is able to pinpoint and diagnose compliance problems. Task mining exploits user-interaction
data to enrich traditional event data. All these different forms of process mining can and should support
Robotic Process Automation (RPA) initiatives. Process mining can be used to decide what to automate and to
monitor the cooperation between software robots, people, and traditional information systems. In the process
of deciding what to automate, the Pareto principle plays an important role. Often 80% of the behavior in
the event data is described by 20% of the trace variants or activities. An organization can use such insights
to “pick its automation battles”, e.g., analyzing the economic and practical feasibility of RPA opportunities
before implementation. This paper discusses how to leverage the Pareto principle in RPA and other process
automation initiatives.
1 INTRODUCTION
The Pareto principle, also called the 80/20 rule, states
that for many phenomena, 80% of the outcomes (e.g.,
effects, outputs, or values) come from 20% of the
causes (e.g., inputs, resources, or activities). The prin-
ciple has been named after Vilfredo Pareto (1848-
1923), an Italian economist, who noted already in
1896 that about 80% of the land in Italy belonged
to 20% of the people (Pareto, 1896). The same
80/20 distribution was witnessed for other countries.
George Kingsley Zipf (1902-1950) witnessed a simi-
lar phenomenon in linguistics where the frequency of
a word is inversely proportional to its rank in the fre-
quency table for that language (e.g., 80% of the text in
a book may be composed of only 20% of the words)
(Zipf, 1949). Bradford’s law, power law, and scaling
law, all refer to similar phenomena.
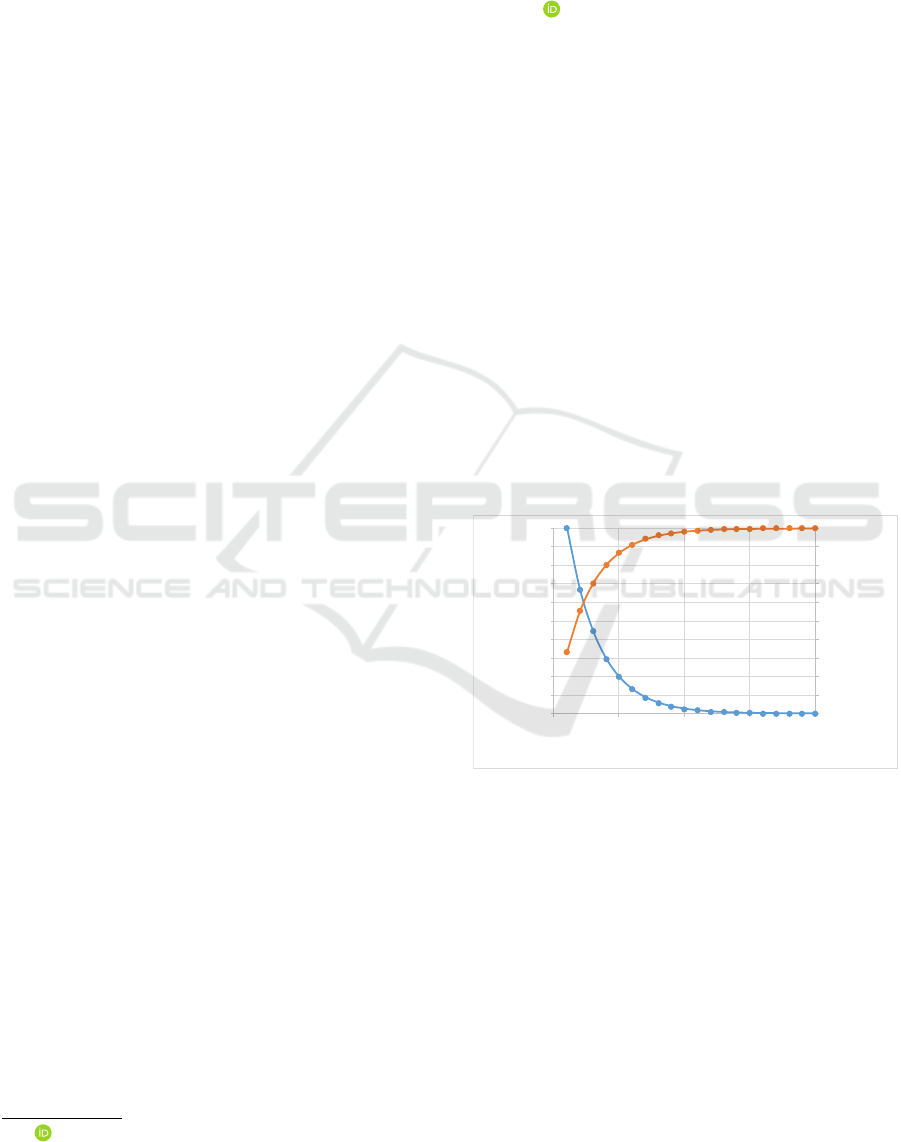
Real-life processes and the event data stored in in-
formation systems often follow the Pareto principle,
as illustrated in Figure 1. Events may have many at-
tributes, but should at least have a timestamp and refer
to both an activity and a case (i.e., process instance).
Examples of cases are sales orders, suitcases in an
airport, packages in a warehouse, and patients in a
hospital. Activities are executed for such cases, e.g.,
a
https://orcid.org/0000-0002-0955-6940
0.00%
10.00%
20.00%
30.00%
40.00%
50.00%
60.00%
70.00%
80.00%
90.00%
100.00%
0.00
500.00
1000.00
1500.00
2000.00
2500.00
3000.00
3500.00
4000.00
4500.00
5000.00
0 5 10 15 20
cumulative percentage
frequency
activities or process variants sorted by frequency
Figure 1: Illustration of the Pareto principle: 20% of the
most frequent activities or process variants account for 80%
of the observed behavior.
checking-in a suitcase, recording a patient’s blood
pressure, transferring money, or delivering a parcel.
Often a few activities may explain most of the events
seen in the event log. The same holds for the process
variants, i.e., unique traces of activities. The so-called
“happy path” in a process refers to the most frequent
process variants involving a limited number of activ-
ities. However, in real-life processes there are often
many different activities that are rare and cases that
are one-of-a-kind (i.e., no other case follows the ex-
act same path).
van der Aalst, W.
On the Pareto Principle in Process Mining, Task Mining, and Robotic Process Automation.
DOI: 10.5220/0009979200050012
In Proceedings of the 9th International Conference on Data Science, Technology and Applications (DATA 2020), pages 5-12
ISBN: 978-989-758-440-4
Copyright
c
2020 by SCITEPRESS – Science and Technology Publications, Lda. All rights reserved
5

desired undesired
frequent
infrequent
Figure 2: Classifying behavior into four categories.
Part of the variability is explained by unde-
sired behaviors of the actors involved (e.g., re-
work, procrastination, data entry problems, and mis-
communication). However, variability may also be
positive and point to human flexibility and inge-
nuity. Human actors are able to handle excep-
tional cases, solve wicked problems, and respond to
changes. Figure 2 shows four types of behavior: fre-
quent/desired, frequent/undesired, infrequent/desired,
infrequent/undesired. Many IT problems are caused
by focusing on frequent/desired behavior only, with-
out understanding and addressing the other three
quadrants. Infrequent behavior is not automatically
undesirable, and undesirable behavior may be fre-
quent, and at the same time entirely invisible to im-
portant stakeholder.
Process mining can be used to uncover and diag-
nose the different behaviors shown in Figure 2 (Aalst,
2016). This is important for making decisions on
what can and should be automated. Therefore, we
relate process mining to task mining and Robotic Pro-
cess Automation (RPA) (Aalst et al., 2018).
The remainder of this paper is organized as fol-
lows. Section 2 introduces process mining. Task
mining and RPA are briefly introduced in Section 3.
These provide the setting to define variability in Sec-
tion 4. We will show that the Pareto principle can be
viewed at different abstraction levels. These insights
are related to automation decisions in Section 5. Sec-
tion 6 concludes the paper.
2 PROCESS MINING: LINKING
DATA AND PROCESSES
Process mining provides a range of techniques to uti-
lize event data for process improvement. The starting
point for process mining is an event log. Each event
in such a log, refers to an activity possibly executed
by a resource at a particular time and for a particu-
Table 1: A small fragment of an event log.
case id activity timestamp costs ...
... ... ... ... ...
QR5753 Create PO 27-4-2020 230 ...
QR5548 Rec. Order 27-4-2020 230 ...
QR5754 Create PO 28-4-2020 230 ...
QR5758 Payment 28-4-2020 230 ...
QR5754 Send PO 28-4-2020 230 ...
QR5753 Send PO 28-4-2020 230 ...
QR5753 Rec. Order 29-4-2020 230 ...
QR5753 Rec. Inv. 29-4-2020 230 ...
QR5753 Payment 30-4-2020 230 ...
... ... ... ... ...
lar case. An event may have many more attributes,
e.g., transactional information, costs, customer, loca-
tion, and unit. Table 1 shows a (simplified) fragment
of a larger event log. Such event data are related to
process models expressed as Directly Follows Graphs
(DFGs), Petri nets (various types), transition systems,
Markov Chains, BPMN (Business Process Modelling
Notation) diagrams, UML activity diagrams, process
trees, etc. These diagrams typically describe the life-
cycle of an individual case (although object-centric
process mining techniques try to overcome this limi-
tation (Aalst, 2019)).
For a more complete description of the different
types process mining techniques we refer to (Aalst,
2016). Here we only mention the main types of pro-
cess mining:
• Process discovery: Automatically learning pro-
cess models to show what is really happening.
• Conformance checking: Identifying and diagnos-
ing deviations between a model and reality.
• Performance analysis: Identifying and diagnosing
bottlenecks, rework, blockages, waste, etc.
• Root-cause analysis: Data-driven explanations
for observed phenomena in the process.
• Process prediction: Using process models learned
from event data to predict dynamic behavior.
Most of the process mining techniques are inter-
active to provide a deeper understanding of the pro-
cess. Figure 3 shows how a discovery technique can
generate process models at different abstraction levels
(without any modeling). Activities are included based
on their frequency. The yellow dots refer to real or-
ders showing the connection to the underlying event
data.
Figure 3 shows only one of the 1500 ProM plug-
ins: the so-called Inductive Visual Miner (Leemans
et al., 2018). Next to open-source software like
ProM, there are over 30 commercial tools (e.g., Celo-
nis, Disco, ProcessGold, myInvenio, PAFnow, Minit,
DATA 2020 - 9th International Conference on Data Science, Technology and Applications
6
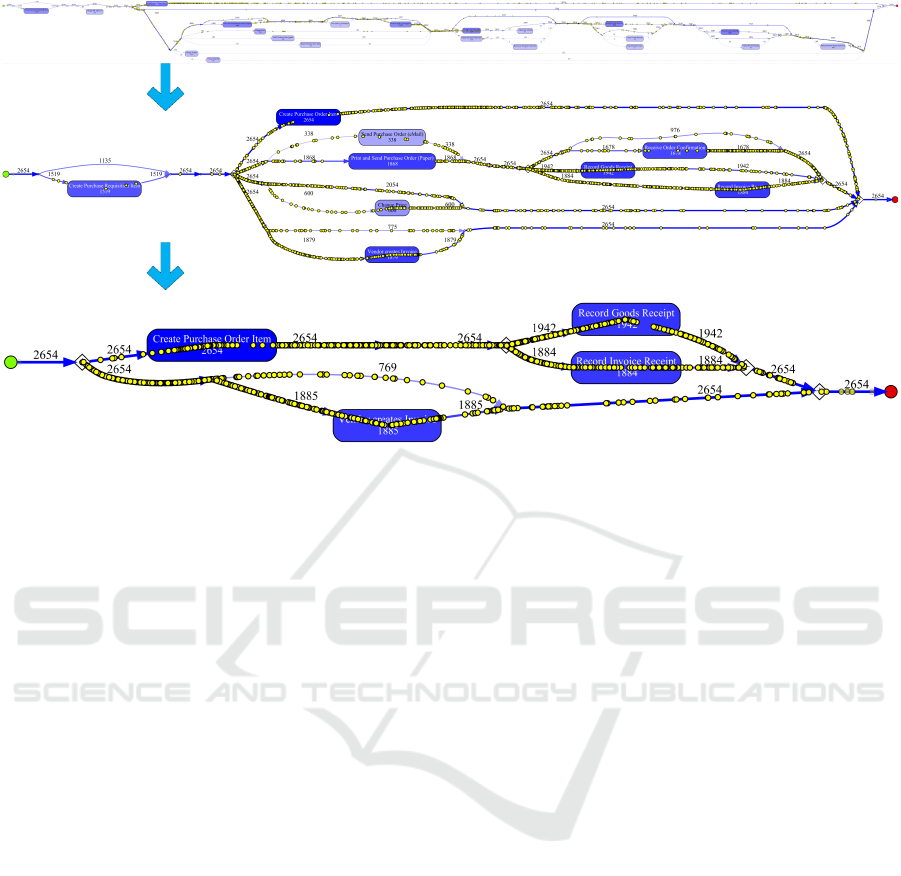
Figure 3: Seamless simplification of discovered process models using activity frequencies.
QPR, Mehrwerk, Puzzledata, LanaLabs, StereoLogic,
Everflow, TimelinePI, Signavio, and Logpickr) illus-
trating the adoption of process mining in industry.
3 TASK MINING AND ROBOTIC
PROCESS AUTOMATION
Process mining can be used to identify work done
by people that could or should be automated (Aalst,
2016). Note that this is just one of several pro-
cess mining use cases (there are many other ways to
improve performance and compliance in processes).
Robotic Process Automation (RPA) has lowered the
threshold for process automation. Repetitive tasks
done by people are handed over to software robots.
For RPA, there is no need to change or replace the
pre-existing information systems. Instead, software
robots replace users by interacting with the informa-
tion systems through the Graphical User Interfaces
(GUIs) that humans use.
Obviously, RPA is related to Workflow Manage-
ment (WFM), which has been around for several
decades (Aalst and Hee, 2004). In the mid-nineties,
the term Straight Through Processing (STP) was used
to emphasize the desire to replace humans by software
for repetitive tasks (Aalst, 2013).
The three leading RPA vendors are UIPath
(founded in 2005), Automation Anywhere (founded
in 2003), and Blue Prism (founded in 2001) have
been successful in lowering the threshold for automa-
tion. The key idea is that the back-end systems are
not changed; only the activities of people interacting
with these systems are automated. For the informa-
tion system nothing changes. This way, WFM and
STP may become economically feasible where tradi-
tional automation is too expensive. Therefore, the au-
thor sometimes refer RPA as “the poor man’s work-
flow management solution”. RPA aims to replace
people by automation done in an “outside-in” manner
(i.e., via the user interface rather than the backend).
This differs from the classical “inside-out” approach
to improve information systems (Aalst et al., 2018).
Although RPA companies often use the terms Ma-
chine Learning (ML) and Artificial Intelligence (AI),
automation projects highly depend on a manual anal-
ysis of the work being done. The focus is on iden-
tifying sequences of manual activities. For example,
starting an application, copying an address, and then
pasting the address into a form on some website. The
usage of AI and ML in the context of RPA is often
limited and only used as a “sales gimmick”, Optical
Character Recognition (OCR) and basic classification
problems (e.g., decision trees) are sold as new intelli-
gent solutions. Nevertheless, there is a clear relation
between RPA and process mining.
The synergy between RPA and process mining
was first discussed in (Aalst et al., 2018). This arti-
cle identifies the “long tail of work” and stresses that
humans often provide the “glue” between different IT
systems in a hidden manner and that this “glue” can
only be made visible using process mining. Process
mining is presented as a way to identify what can
be automated using RPA. However, process mining
should not only be used only in the implementation
On the Pareto Principle in Process Mining, Task Mining, and Robotic Process Automation
7

phase. By continuously observing human problem re-
solving capabilities (e.g., in case of system errors, un-
expected system behavior, changing forms) RPA tools
can adapt and handle non-standard cases (Aalst et al.,
2018). Moreover, process mining can also be used to
continuously improve the orchestration of work be-
tween systems, robots, and people.
In (Geyer-Klingeberg et al., 2018) it is shown
how Celonis aims to support organizations through-
out the whole lifecycle of RPA initiatives. Three steps
are identified: (1) assessing RPA potential using pro-
cess mining (e.g., identifying processes that are scal-
able, repetitive and standardized), (2) developing RPA
applications (e.g., supporting training and compari-
son between humans and robots), and (3) safeguard-
ing RPA benefits (e.g., identifying concept drift and
compliance checking). The “automation rate” can be
added as a performance indicator to quantify RPA ini-
tiatives.
In (Leno et al., 2020) the term Robotic Process
Mining (RPM) is introduced to refer to “a class of
techniques and tools to analyze data collected dur-
ing the execution of user-driven tasks in order to sup-
port the identification and assessment of candidate
routines for automation and the discovery of routine
specifications that can be executed by RPA bots”. The
authors propose a framework and RPM pipeline com-
bining RPA and process mining, and identify chal-
lenges related to recording, filtering, segmentation,
simplification, identification, discovery, and compila-
tion.
Several vendors (e.g., Celonis, myInvenio,
NikaRPA, UiPath) recently adopted the term Task
Mining (TM) to refer to process mining based on
user-interaction data (complementing business data).
These user-interaction data are collected using task
recorders (similar to spy-ware monitoring specific
applications) and OCR technology to create textual
data sets. Often screenshots are taken to contextualize
actions taken by the user. Natural Language Process-
ing (NLP) techniques and data mining techniques
(e.g., clustering) are used to enrich event data. The
challenge is to match user-interaction data based on
identifiers, usernames, keywords, and labels, and
connect different data sources. Note that the usage of
task mining is not limited to automation initiatives.
It can also be used to analyze compliance and
performance problems (e.g., decisions taken without
looking at the underlying information). Note that
screenshots can be used to interpret and contextualize
deviating behavior. For example, such analysis can
reveal time-consuming workarounds due to system
failures.
4 DEFINING VARIABILITY
The Pareto principle (Pareto, 1896) can be observed
in many domains, e.g., the distribution of wealth, fail-
ure rates, and files sizes. As shown in Figure 1, this
phenomenon can also be observed in process min-
ing. Often, a small percentage of activities accounts
for most of the events, and a small percentage of
trace variants accounts for most of the cases. When
present, the Pareto distribution can be exploited to dis-
cover process models describing mainstream behav-
ior. However, for larger processes with more activi-
ties and longer traces, the Pareto distribution may no
longer be present. For example, it may be that most
traces are unique. In such cases, one needs to abstract
or remove activities in the log to obtain a Pareto dis-
tribution, and separate mainstream from exceptional
behavior.
The goal of this section is to discuss the notion of
variability in process mining. To keep things simple,
we focus on control-flow only. Formally, events can
have any number of attributes and also refer to prop-
erties of the case, resources, costs, etc. In the context
of RPA, events can also be enriched with screenshots,
text fragments, form actions, etc. These attributes will
make any case unique. However, even when all cases
are unique, we would still like to quantify variability.
Therefore, the principles discussed below are generic
and also apply to other attributes.
As motivated above, we only consider activity la-
bels and the ordering of events within cases. Consider
again the simplified event log fragment in Table 1. In
our initial setting, we only consider the activity col-
umn. The case id column is only used to correlate
events and the timestamp column is only used to or-
der events. All other columns are ignored. This leads
to the following standard definition.
Definition 1 (Traces). A is the universe of activities.
A trace t ∈ A
∗
is a sequence of activities. T = A
∗
is
the universe of traces.
Trace t = hCreatePO,SendPO,RecOrder,RecInv,
Paymenti ∈ T refers to 5 events belonging to the same
case (case QR5753 in Table 1). An event log is a col-
lection of cases, each represented by a trace.
Definition 2 (Event Log). L = B(T ) is the universe
of event logs. An event log L ∈ L is a finite multiset
of observed traces.
An event log is a multiset of traces. Event
log L = [hCreatePO,SendPO, RecOrder, RecInv,
Paymenti
5
,hCreatePO,Canceli
3
,hSendPO, RecInv,
RecOrder,Paymenti
3
,] refers to 10 cases (i.e.,
|
L
|
= 10). In the remainder, we use single letters
for activities to ensure a compact representation.
DATA 2020 - 9th International Conference on Data Science, Technology and Applications
8

Trace variant distribution before activity-based
filtering: Since all 14992 variants are unique we
cannot filter in a meaningful way.
Trace variant distribution after activity-based
filtering: Now we can exploit the Pareto-like
distribution to filter trace variants.
0.00%
10.00%
20.00%
30.00%
40.00%
50.00%
60.00%
70.00%
80.00%
90.00%
100.00%
0.00
500.00
1000.00
1500.00
2000.00
2500.00
3000.00
3500.00
4000.00
4500.00
5000.00
0 5 10 15 20
cumulative percentage
frequency
process variants sorted by frequency
0.00%
10.00%
20.00%
30.00%
40.00%
50.00%
60.00%
70.00%
80.00%
90.00%
100.00%
0
1
2
3
4
5
6
7
8
9
10
0 5000 10000 15000
cumulative percentage
frequency
process variants sorted by frequency
Figure 4: The left diagram shows an event log where each trace variant is unique, i.e., each of the 14992 cases is unique.
Therefore, it is impossible to filter and it seems that the Pareto principle cannot be applied (the blue line is flat, showing
that frequency-based filtering is not possible). The right diagram shows the same data set after activity-based filtering. The
infrequent activities have been removed. Now there is a clear Pareto-like distribution that can be exploited in analysis and
separate the usual from the unusual behavior.
For example, L = [ha,b,c,di
7
,ha, c,b,di
3
]. L(t)
is the number of times trace t appears in L, e.g.,
L(ha,b, c,di) = 7.
We assume that the usual operators are defined for
multisets. L
1
] L
2
is the union of two multisets,
|
L
|
is
the number of elements, and L
1
\ L
2
is the difference.
L
1
∩ L
2
is the intersection of two multisets. [t ∈ L |
b(t)] is the multiset of all elements in L that satisfy
some condition b.
Definition 3 (Simple Variability Measures). For an
event log L ∈ L , we define simple variability measures
such as:
•
|
{t ∈ L}
|
, i.e., the number of trace variants,
•
|
{a ∈ t | t ∈ L}
|
, i.e., the number of activities,
• entropy(L), i.e., the entropy of traces,
1
and
• entropy([a ∈ t | t ∈ L]), i.e., the activity entropy.
For L
1
= [ha,b,c,di
70
,ha, c,b,di
30
]:
|
{t ∈ L
1
}
|
= 2,
|
{a ∈ t | t ∈ L
1
}
|
= 4, entropy(L
1
) =
−(0.7log
2
(0.7) + 0.3log
2
(0.3)) = 0.88,
entropy([a ∈ t | t ∈ L
1
]) = 2 (since all four ac-
tivities happen 100 times). The above measures can
be normalized, e.g.,
|
{t ∈ L}
|
/
|
L
|
yields a number
between 0 and 1. The latter value is reached when all
traces are unique, i.e., maximal variability.
L
2
= [ha,b,c, di
65
,ha, c,b,di
25
,he,a,b,c, di
2
,ha,
f ,b, c,di
2
,ha, b,g,c, di
2
,ha, b,c,h,di
2
,ha, b,c,d,ii
2
]
is another (intentionally similar) event log. Now
|
{t ∈ L
2
}
|
= 7,
|
{a ∈ t | t ∈ L
2
}
|
= 9, entropy(L
2
) =
1.47, and entropy([a ∈ t | t ∈ L
2
]) = 2.17. The
number of unique traces more than tripled and the
number of activities more than doubled. However,
event log L
2
is similar to L
1
, only 10 events were
added to the 400 events in L
1
.
1
For a multiset X, the information entropy entropy(X) =
−
∑
x∈X
(X(x)/
|
X
|
)log
2
(X(x)/
|
X
|
).
Assume now an event log L
3
based on L
1
, but were
randomly events are added until each trace is unique.
Then
|
{t ∈ L
3
}
|
= 100 and entropy(L
3
) = 6.64. These
numbers do not reflect that there is still a rather stable
structure. More advanced notions such as the Earth
Movers’ distance between logs (Leemans et al., 2019)
provide a better characterization. However, our goal
is to uncover a Pareto-like distribution.
Now consider Figure 1 again. Assume that trace
variants are sorted based on frequency. For L
1
we
would see h70, 30i (two variants), for L
2
we would
see h65,25,2,2, 2,2,2i (seven variants), and for L
3
we
would see h1,1, ,...,1i (100 variants). Event log L
2
is
closest to a Pareto distribution: 90% of the cases are
described by 33% of the variants.
The distribution in Figure 1 is h4999, 3332,2221,
1481,, 987,...,3,2i (20 variants), i.e., the four most
frequent variants cover 80% of the cases. Let’s refer
to this event log as L
4
. L
4
has 14992 cases.
If our event data has a Pareto-like distribution,
then filtering can be used to identify the regular main-
stream behavior. There are two types of filtering: re-
moving infrequent variants and removing infrequent
activities. These can be formalized as follows.
Definition 4 (Sequence Projection). Let A ⊆ A .
A
∈
A
∗
→ A
∗
is a projection function and is defined recur-
sively: (1) h i
A
= h i and (2) for t ∈ A
∗
and a ∈ A:
(hai ·t)
A
=
(
t
A
if a 6∈ A
hai ·t
A
if a ∈ A
Definition 5 (Filtering). Let L ∈ L be an event log.
• For any A ⊆ A: filter(A, L) = [t
A
| t ∈ L] only
keeps the events corresponding to the activity set
A.
• For any T ⊆ A
∗
: filter(T, L) = [t ∈ L | t ∈ T ] only
keeps the trace variants in T.
On the Pareto Principle in Process Mining, Task Mining, and Robotic Process Automation
9
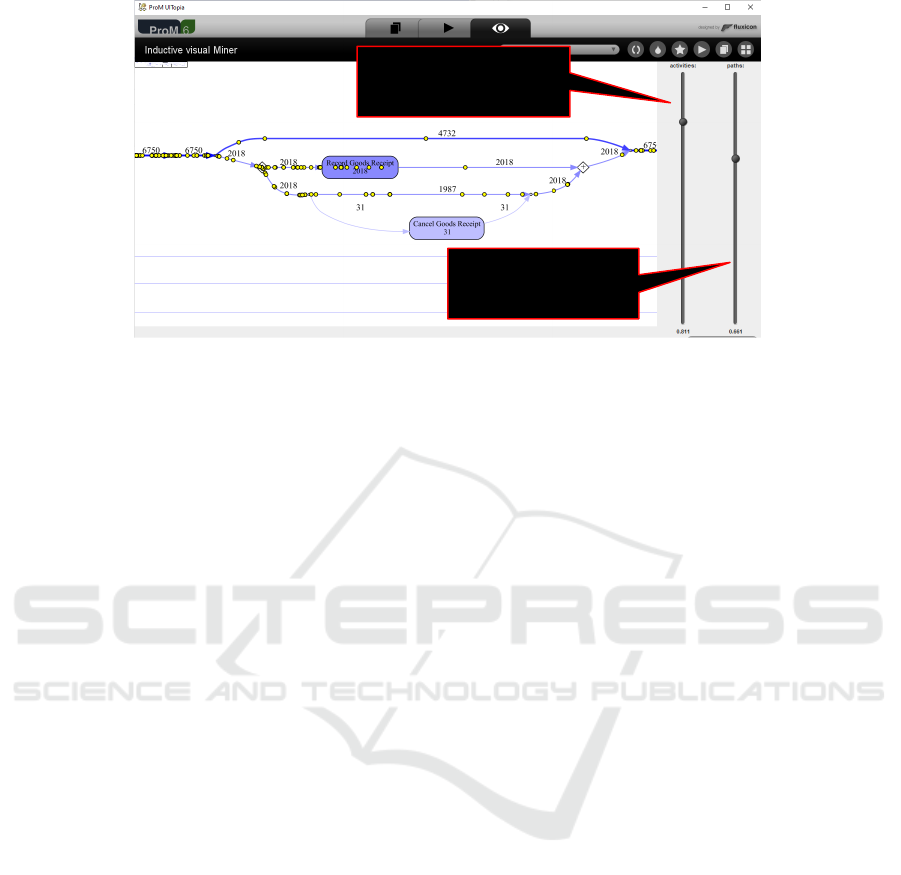
slider to filter based
on path frequencies
slider to filter based on
activity frequencies
Figure 5: Sliders used in the Inductive Visual Miner to search for a Pareto-like distribution.
• freqact(k, L) = {a ∈ A |
∑
t∈L
|
[x ∈ t | x = a]
|
≥ k}
are the frequent activities (k ∈ IN).
• freqtraces(k,L) = {t ∈ L | L(t) ≥ k} are the fre-
quent traces (k ∈ IN).
Definition 6 (Filtered Event Logs). Let L ∈ L be an
event log and k
1
,k
2
∈ IN two parameters.
• L
k
1
= filter(freqact(k
1
,L), L) is the event log with-
out the infrequent activities.
• L
k
1
,k
2
= filter(freqtraces(k
2
,L
k
1
),L
k
1
) is the event
log without the infrequent variants.
In Definition 6, there are three event logs: L is
the original event log, L
k
1
is the log after removing
infrequent activities, and L
k
1
,k
2
is the log after also
removing infrequent variants.
L
1
2
= L
2
= [ha, b,c, di
65
,ha, c,b,di
25
,he,a,b,
c,di
2
,ha, f , b,c, di
2
,ha, b,g,c, di
2
,ha, b,c,h,di
2
,ha,
b,c, d,ii
2
] (i.e., all activities happened at least once,
so no events are removed). L
10
2
= [ha,b, c,di
75
,
ha,c, b,di
25
] (i.e., the five infrequent activities are
removed). L
200
2
= [hi
100
] (i.e., none of the activities is
frequent enough to be retained). L
1,5
2
= [ha,b,c,di
65
,
ha,c, b,di
25
] (i.e., the five infrequent variants are
removed). L
10,30
2
= [ha, b,c,di
75
]. As mentioned
before, event log L
3
is based on L
1
but randomly
events are added until each trace is unique. This
implies that L
1,2
2
= [ ] (i.e., even for k
2
= 2, none of
the trace variants remains). However, if the randomly
added events all have a frequency lower than 10, then
L
10,2
2
= L
1
. This illustrates the interplay between both
types of filtering. If the trace variant distribution does
not exhibit a Pareto-like distribution, then it is good
to filter first at the level of activities.
Figure 4 illustrates the phenomenon just de-
scribed. It may be the case that all cases are unique
and that the variability is too high to see any struc-
ture. However, after abstraction (e.g., removing in-
frequent activities), a Pareto-like distribution may
emerge. Different forms of abstraction are possible.
We can remove infrequent activities, compose activi-
ties, cluster activities, etc. Whenever we are searching
for structure in event data, we should make sure that
the resulting distribution follows a power law.
Existing process discovery techniques ranging
from the Fuzzy Miner (G
¨
unther and Aalst, 2007) to
the Inductive Visual Miner (Leemans et al., 2018) al-
ready try to exploit this. However, they require the
user to set the thresholds. Future research should aim
at supporting the quest for “Pareto-like phenomena”
in a better way. For example, the activity thresh-
olds should be set in such a way that the resulting
trace variants indeed follow the 80-20 rule. More-
over, filtering should not be done using just frequen-
cies. There may be frequent activities that conceal
regular patterns among less frequent activities.
5 HOW TO PICK YOUR
AUTOMATION BATTLES?
In the previous section, we showed that variability can
be defined and measured. However, regular structures
may be hidden. Even when all cases follow a unique
path there may be dominant behaviors that are not vis-
ible at first sight. In most applications “Pareto-like
phenomena” are present, but one needs to look at the
right abstraction level.
Process mining can be used to quickly understand
the best automation opportunities. Based on the the-
oretical concepts presented before, we can sort be-
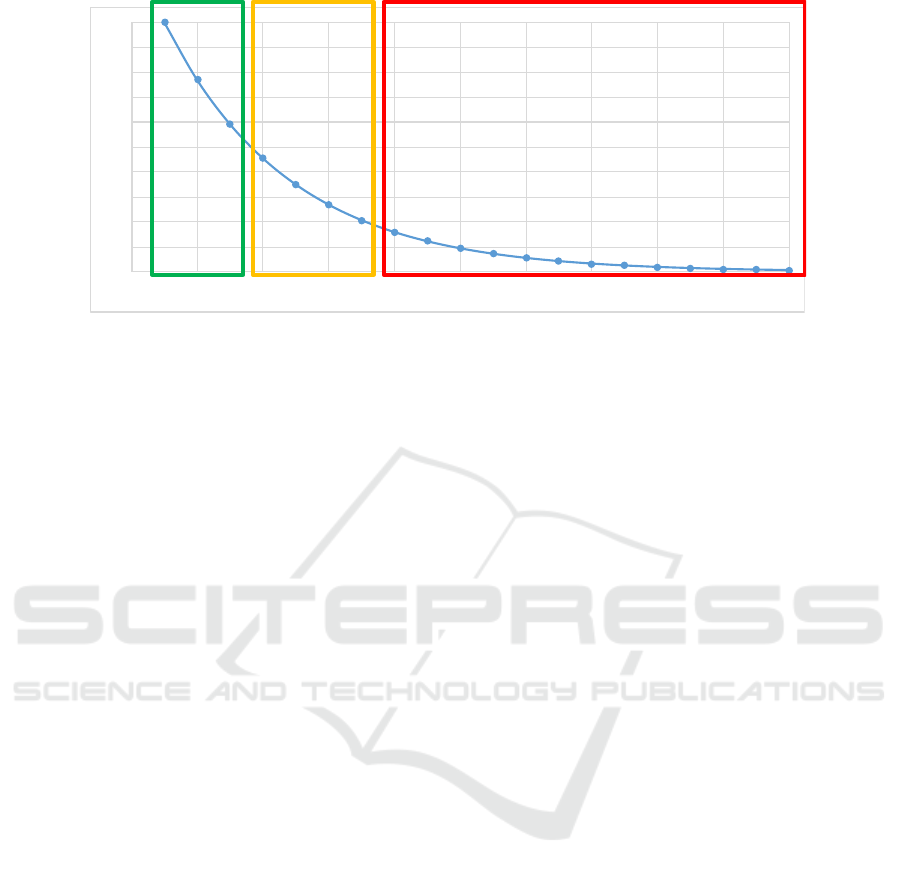
havior based on frequency. In Figure 6, behavior is
DATA 2020 - 9th International Conference on Data Science, Technology and Applications
10
frequency
process variants sorted by frequency
(1)
(2)
(3)
Figure 6: Based on the Pareto principle behavior can be classified in three groups: (1) regular high-frequent subprocesses
automated in the traditional way, (2) frequent standardized subprocesses taken over by robots, and (3) infrequent and/or
exceptional behaviors still handled by people.
split into three groups. The first group (green) rep-
resents standardized high-frequent behavior that is so
frequent and standard that it should be automated in
the traditional manner (i.e., not using RPA, but in
the information system itself). The third group (red)
represent non-standard behavior that requires human
judgment (e.g., based on context and ad-hoc commu-
nication). The frequency is too low to learn what hu-
mans do. Also, contextual information not stored in
the information system may play an important role in
making the decisions. Therefore, it is pointless to try
and automate such behaviors. RPA aims to automate
the second (i.e., intermediate) group of behaviors (or-
ange). These are the subprocesses that are rather fre-
quent and simple, but it is not cost-effective to change
the information system. For example, when people
are repeatedly copying information from one system
to another, it may still be too expensive to change both
systems in such a way that the information is synchro-
nized. However, using RPA, this can be done by soft-
ware robots taking over the repetitive work.
Figure 6 oversimplifies reality. There are activi-
ties that cannot be automated because a physical ac-
tion (e.g., checking a product) is needed or because
a human action is required by regulations (e.g., an
approval). Moreover, before making any automation
decision, the existing process behaviors need to be
mapped onto the four quadrants in Figure 2. RPA
should not be used to automate undesired behaviors.
This shows that any automation project will require
human judgment.
6 CONCLUSION
The recent attention for Robotic Process Automation
(RPA) has fueled a new wave of automation initia-
tives. In the 1990-ties, there was similar excitement
about Workflow Management (WFM) systems and
Straight Through Processing (STP). Many of the tra-
ditional WFM/STP initiatives failed because of two
reasons: (1) automation turned out to be too expen-
sive and time-consuming (see for example the longi-
tudinal study in (Reijers et al., 2016)) and (2) the real
processes turned out to be much more complicated
than what was modeled leading to failures and resis-
tance. Also many of the later Business Process Man-
agement (BPM) projects led to similar disappointing
results (expensive and disconnected from reality). As
a result, the term “process management” got a nega-
tive connotation and is often seen as synonymous for
process documentation and modeling.
The combination of process mining and RPA of-
fers a unique opportunity to revitalize process man-
agement and address the traditional pitfalls of pro-
cess modeling and process automation. RPA can
be more cost-effective because the underlying infor-
mation systems can remain unchanged. Many of
the transitional BPM/WFM initiatives require com-
plex and expensive system integration activities. RPA
avoids this by simply replacing the “human glue” by
software robots. As stated in (Aalst et al., 2018), RPA
uses an “outside-in” rather than the classical classi-
cal “inside-out” approach. Although RPA may be
cheaper, it is still important to carefully analyze the
processes before automation. Current practices need
to be mapped onto the four quadrants in Figure 2.
There is no point in automating non-compliant or in-
On the Pareto Principle in Process Mining, Task Mining, and Robotic Process Automation
11

effective behavior. Hence, process mining must play
a vital role in picking the “automation battles” in an
organization. It is possible to objectively analyze the
economic feasibility of automation by analyzing the
current processes. Next to business data, also user-
interaction data needs to be used to fully understand
the work done by people. The term task mining refers
to the application of process mining to such user-
interaction data. The application of process mining
is broader than RPA and does not stop after the soft-
ware robots become operational. The orchestration of
processes involving systems, robots, and people re-
quires constant attention. In this paper, we focused on
the Pareto principle in event data as a means to iden-
tify opportunities for automation. Currently, users can
use variant filtering or activity-based filtering. Often a
combination of both is needed to separate mainstream
from exceptional behavior. We advocate more sys-
tematic support for this. If there is no clear Pareto-
like distribution and all behaviors are unique, further
abstractions are needed. This also opens the door for
new discovery and conformance checking techniques.
Several studies suggest that many jobs will be
taken over by robots in the coming years (Frey and
Osborne, 2017; Hawksworth et al., 2018). This makes
the interplay between process mining and automation
particularly relevant and a priority for organizations.
ACKNOWLEDGEMENTS
We thank the Alexander von Humboldt (AvH)
Stiftung for supporting our research.
REFERENCES
Aalst, W. van der (2013). Business Process Management: A
Comprehensive Survey. ISRN Software Engineering,
pages 1–37. doi:10.1155/2013/507984.
Aalst, W. van der (2016). Process Mining: Data Science in
Action. Springer-Verlag, Berlin.
Aalst, W. van der (2019). Object-Centric Process Mining:
Dealing With Divergence and Convergence in Event
Data. In
¨
Olveczky, P. and Sala
¨
un, G., editors, Soft-
ware Engineering and Formal Methods (SEFM 2019),
volume 11724 of Lecture Notes in Computer Science,
pages 3–25. Springer-Verlag, Berlin.
Aalst, W. van der, Bichler, M., and Heinzl, A. (2018).
Robotic Process Automation. Business and Informa-
tion Systems Engineering, 60(4):269–272.
Aalst, W. van der and Hee, K. van (2004). Workflow Man-
agement: Models, Methods, and Systems. MIT Press,
Cambridge, MA.
Frey, C. and Osborne, M. (2017). The future of em-
ployment: How susceptible are jobs to computerisa-
tion? Technological Forecasting and Social Change,
114(C):254–280.
Geyer-Klingeberg, J., Nakladal, J., Baldauf, F., and Veit, F.
(2018). Process mining and robotic process automa-
tion: A perfect match. In Proceedings of the Industrial
Track at the 16th International Conference on Busi-
ness Process Management (BPM 2018), pages 124–
131.
G
¨
unther, C. and Aalst, W. van der (2007). Fuzzy Min-
ing: Adaptive Process Simplification Based on Multi-
perspective Metrics. In International Conference on
Business Process Management (BPM 2007), volume
4714 of Lecture Notes in Computer Science, pages
328–343. Springer-Verlag, Berlin.
Hawksworth, J., Berriman, R., and Goel, S. (2018). Will
Robots Really Steal Our Jobs? An International Anal-
ysis of the Potential Long Term Impact of Automa-
tion. Technical report, PricewaterhouseCoopers.
Leemans, S., Fahland, D., and Aalst, W. van der (2018).
Scalable Process Discovery and Conformance Check-
ing. Software and Systems Modeling, 17(2):599–631.
Leemans, S., Syring, A., and Aalst, W. van der (2019).
Earth Movers’ Stochastic Conformance Checking. In
Business Process Management Forum (BPM Forum
2019), volume 360 of Lecture Notes in Business Infor-
mation Processing, pages 127–143. Springer-Verlag,
Berlin.
Leno, V., Polyvyanyy, A., Dumas, M., Rosa, M., and
Maggi, F. (2020). Robotic Process Mining: Vision
and Challenges. Business and Information Systems
Engineering (to appear).
Pareto, V. (1896). Cours d’Economie Politique. Droz,
Gen
`
eve.
Reijers, H., Vanderfeesten, I., and Aalst, W. van der (2016).
The Effectiveness of Workflow Management Systems:
A Longitudinal Study. International Journal of Infor-
mation Management, 36(1):126–141.
Zipf, G. (1949). Human Behaviour and the Principle of
Least Effort. Addison-Wesley, Reading, MA.
DATA 2020 - 9th International Conference on Data Science, Technology and Applications
12
