
Influence and Evaluation of Potential Fractured Zone by
Surrounding Rockmass Deformation during Deep Tunneling Blasting
Excavation
Jixue Zhou
1,2
, Junhong Huang
1,3,4
, Yi luo
1
and Xinping Li
1
1
Hubei Key Laboratory of Roadway Bridge and Structure, Wuhan University of Technology, Wuhan, China
2
School of Civil Engineering and Architecture, Wuhan University of Technology, Wuhan, China
3
School of Safety Science and Emergency Management, Wuhan University of Technology, Wuhan, China
4
School of Resource, Environmental Science and Engineering, Hubei University of Science and Technology,
Xianning, China
Keywords: Deep Tunnel, Rockmass Excavation, Longitudinal Deformation Curve, Fractured Band, Settlement
Monitoring.
Abstract: Daliang tunnel on Lanzhou-Xinjiang high-speed railway is a typical tunneling project with adverse geological
conditions, especially fractured zones during blasting excavation. A major collapse disaster was caused due
to an unexpected fractured zone, which was excavated and supported improperly. Field test data of
surrounding rockmass displacement is analyzed for changes alone tunnel axis and with time. Deformation
curve versus time for tunnel sections with surrounding rockmass in consistent and relatively high integrity
shows one inflection point, where deformation rate changes from increase to decrease. It revealed by
numerical analysis that before exposed by blasting excavation, rockmass near fractured zone has shown much
deformation. Inflection point can always by observed on the total deformation curve, while it appears earlier
when nearer to the fractured zone. When the inclination angle of the fractured zone is small, the location of
inflection point on deformation-time curve is more sensitive to the change of inclination angle. Existence of
a fractured zone in vicinity ahead can be evaluated for choosing proper blasting excavation and support
method.
1 INTRODUCTION
With the continuous development of the Belt and
Road initiative, construction of Chinese
transportation projects have been further developed.
High-speed railway network are extending in West
China along the Silk Road and through Qinghai-Tibet
Plateau and Xinjiang, where geological conditions are
complex. Deformation and stability of deep-buried
tunnels in complicated geological conditions are
often controlled by fault fractured zone (Lenz et al,
2017), such as similar cases in the world-famous
Tauern Tunnel and the Arlberg Tunnel (Austria), and
the Enasan Tunnel (Japan), during excavation. Fault
fractured zone problems are also often encounter
during tunnel blasting excavation in recent years. Kun
and Onargan (2013) studied the influence of fractured
zone for Izmir Metro Tunnel, and determined risky
area in the tunnel. A Case Study on Nowsoud Tunnel
fractured zones would determine the stress
distribution in adjacent tunnel section, and predicted
squeezing potential for a critical zone (Fatemi et al,
2016). Zhao et al (2013) studied highly risky tunnels
in Guiyang-Guangzhou high-speed railway, and
developed a method for detecting fractured zone in
karst area. Zhang et al (2014) have focused on issues
in excavating the deep and long Taining tunnel, South
China, where several squeezing fault zones have to be
tunneled through, and large deformations were
frequently encountered during excavation. It is
demonstrated by previous studies that, fractured
zones have great influence on surrounding rockmass
integrity in vicinity, thus surrounding rockmass
deformation characteristic is different.
Lisjak et al (2015) argued that the characteristics
of rockmass have great influence on the characteristic
of near field deformation base on the analysis of the
monitoring data about deformation from Mont Terri
underground research laboratory. Moffat et al (2015)
studied the axial strain of roadway and distribution
law based on fiber grating equipment. Lin et al (2017)
Zhou, J., Huang, J., luo, Y. and Li, X.
Influence and Evaluation of Potential Fractured Zone by Surrounding Rockmass Deformation during Deep Tunneling Blasting Excavation.
DOI: 10.5220/0009968802790286
In Proceedings of the 10th International Conference on Simulation and Modeling Methodologies, Technologies and Applications (SIMULTECH 2020), pages 279-286
ISBN: 978-989-758-444-2
Copyright
c
2020 by SCITEPRESS – Science and Technology Publications, Lda. All rights reserved
279
investigated the characteristics of strike-slip faults
and displacement in Yanmenguan Tunnel, and
revealed that quality of surrounding rock masses
should be carefully identified, since it can be greatly
influenced by faults nearby and is critical to rockmass
deformation.
In the aspect of calculating the deformation
distribution of longitudinal profile, many scholars
have studied the deformation release coefficient
method and the support force coefficient method (Cai
et al, 2015; Lu et al, 2014). Alejano et al (2012)
calculated the numerical calculation of the rockmass
within a certain GSI (geological strength index) based
on the ideal elasto-plastic assumption, and proposed
a simplified formula for calculating the radius of the
plastic zone of the surrounding rockmass to optimize
the Calculation method of deformation distribution of
strain softening longitudinal section. Vlachopoulos
and Diederichs (2009) optimized the deformation
energy analysis calculation about the longitudinal
profile of surrounding rock, which is based on the
further study of the final radial plastic deformation
calculation method.
In the numerical analysis, Zhao et al (2015)
analyzed the variation of surrounding rockmass
deformation along with the tunnel axis during soft
rock tunneling based on numerical calculation.
Basarir et al (2010) considers the influence of rock
mass characteristics, tunnel size and force state of
surrounding rockmass of the face tunnels, and uses
the Three-Dimensional Finite Element Analysis to
calculate the deformation distribution of the
longitudinal profile of the tunnel and put forward the
fitted formula.
This paper is aiming at the fault fractured zone
with smaller thickness and strike perpendicular to the
axis of the tunnel, so as to explore the deformation
evolution characteristics of surrounding rockmass
caused by tunnel blasting excavation near a fault, by
analyzing field test data and numerical calculation of
surrounding rock deformation.
2 DEFORMATION
CHARACTERISTICS OF
DALIANG TUNNEL BLASTING
EXCAVATION
Lanzhou-Xinjiang high-speed railway (from Lanzhou
to Urumqi), also known as The "Iron Silk Road", is
the longest railway ever built in the world with full
length for 1776 km. Along this railway, Daliang
tunnel starts from DK328+820 and ends at
DK335+370, with length for 6550m. It’s a double-
line tunnel with large section,the excavation height is
13m and the excavation span is 15m. The track
gradient inside the tunnel lies between 6 ‰-9 ‰.
Apart from the entrance point located on the curve,
the rest are located on straight line. Tunnel goes
through the Qilian Mountain (elevation more than
4000m) ,with the maximum buried depth for more
than 600m.
At the time of assisting main tunnel construction,
the tunnel section in 465m depth has faced serious
large abrupt deformation due to blasting excavation.
The maximum deformation rate reached 41mm/d,
which led to cracking of initial support and dropping
of concrete. Deformation of surrounding rockmass is
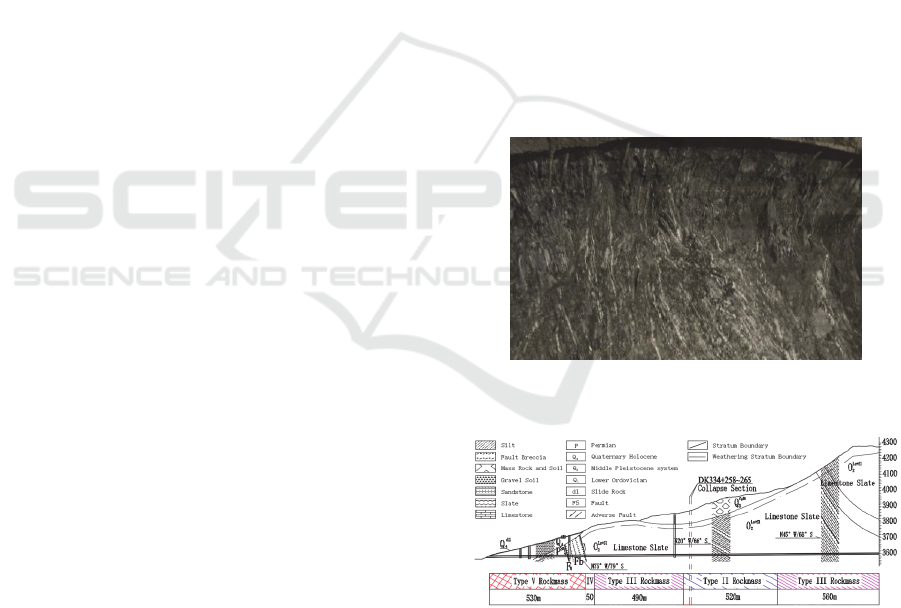
not convergent. Design reports show that surrounding
rockmass of this section should be Class IV, but in
fact it is crashed thin layer black slate with developed
joints. Surrounding rockmass has obvious tectonic
extrusion characteristic, and is in poor stability
(Figure 1). Large deformation was observed in
surrounding rockmass after application of original
construction design.
Figure 1: The actual surrounding rockmass exposed by
excavation.
Figure 2: Longitudinal section of exit section of Daliang
tunnel.
Maximum daily settlement of DK331+885
section is 56mm, maximum daily convergence value
is 30.8mm. Maximum settlement and convergence of
DK331+766 section values are up to 197.5mm and
151.3mm for 4 days, with maximum daily settlement
and convergence value of 45.8mm and 29.9mm.
SIMULTECH 2020 - 10th International Conference on Simulation and Modeling Methodologies, Technologies and Applications
280
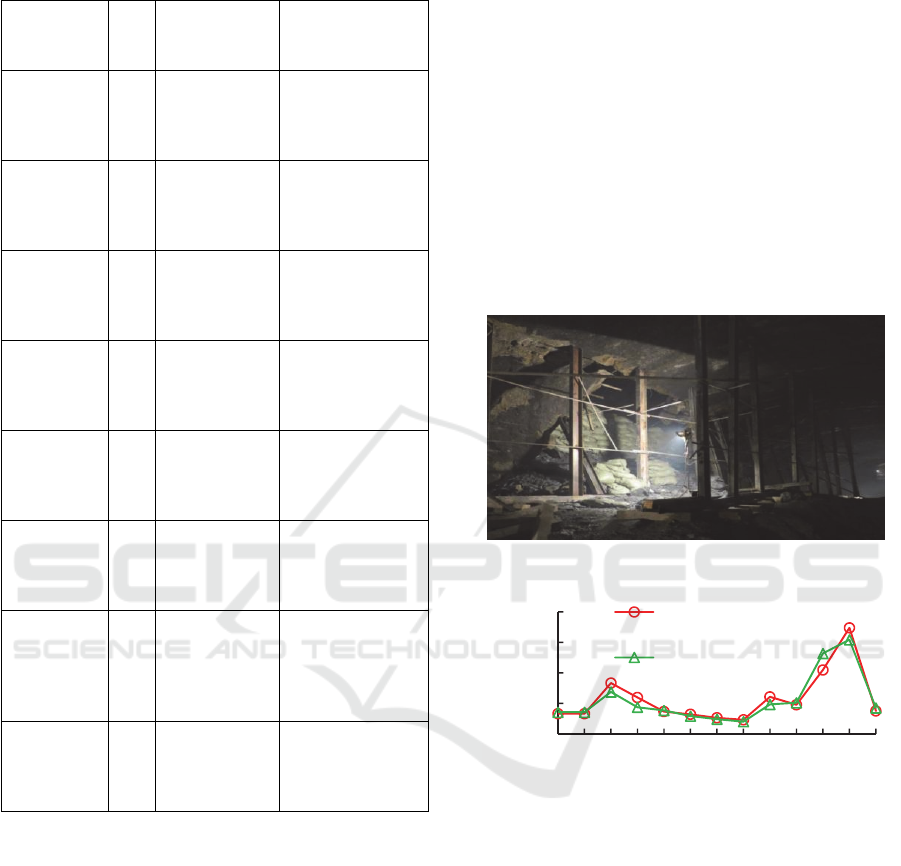
Table 1: Classification and design excavation method for
surrounding rockmass of Daliang tunnel (2010).
Tunnel
Section
Rock
Class
Geological
Feature
Excavation and
Support Method
DK332+040
~DK332+750
III
Deep buried
limestone slate
in good integrity
Bench blasting,
Grade III support
DK332+750
~DK333+250
III
Deep buried
limestone slate
in good integrity
Short bench
blasting. Enhanced
Grade III lining
DK333+250
~DK333+780
III
Deep buried
limestone slate
in good integrity
Bench blasting,
Grade III support
DK333+780
~DK334+300
II
Deep buried
limestone slate
in good integrity
Full-face blasting,
Grade II support
DK334+300
~DK334+590
III
Deep buried
limestone slate
in good integrity
Bench blasting,
Grade III support
DK334+590
~DK334+790
III
Deep buried
limestone slate
in good integrity
Short bench
blasting. Grade III
lining.
DK334 +790
~DK334+840
IV
Influenced by
Fault F5.
Limestone slate
rich of fractures
Three-bench
blasting in seven
steps. Grade IV
lining.
DK334+840
~DK335+370
V
Fractured zone
at Fault F5.
Fault breccia
CRD blasting
method. Grade V
lining.
As described in the Tunnel Risk Assessment
Report (Figure 2 and Table 1), the exit of Daliang
Tunnel at DK334+300 ~ DK333+780 was initially
designed for Middle Ordovician limestone sandwich
plate and Class II surrounding rockmass in good
integrity, using full-face method and Class II
rockmass lining. However, during the excavation
process, obvious loosening and broken rockmass is
found after blasting excavation. Even after adopting
bench method and Class III lining conservatively, it
still generated large deformation in surrounding
rockmass after excavation.
When blasting excavating to DK334+241 section,
collapse of surrounding rockmass took place in
17~24m distance to excavation face. The primary
supporting frame squeezed off, with about 185m
3
rockmass fragments swarmed into the tunnel (Figure
3), forming a cavity 3.5m in depth, 6m in height and
7m in length. The collapse section showed obvious
crushed carbonaceous slate layers formed by strong
tectonic movement, which constantly collapsed in an
unstable state. Within 10m distance to the collapse
area, shot concrete layer cracked in several locations,
including severe dropping off at the dome. The
maximum convergence value for side wall was 1m,
and primary support had intruded the limit.
Monitoring measurement on the sidewall shows that
collapse in surrounding rockmass had led to large
deformation. Settlement and the convergence value
raise up to 36.4mm and 57.6mm on the same day, 5m
distance to the collapse.
Figure 3: Collapse due to a fractured zone.
Figure 4: The surrounding rockmass deformation in vicinity
of the fractured zone.
From long-term observation of accumulative
settlement and convergence deformation values
around the surrounding rockmass in this section
(Figure 4), the accumulated deformation in
surrounding rock mass of this section is much larger
than that of other tunnel sections. Obviously, accurate
judgment on the type of rockmass and identifying
potential fractured zone ahead is significant in
choosing proper blasting excavation methods,
applying advanced support and controlling
surrounding rockmass deformation and stability.
0
100
200
300
400
DK334+244
DK334+260
DK334+270
DK334+280
DK334+390
DK334+400
DK334+410
DK334+420
DK334+430
DK334+440
DK334+450
DK334+460
DK334+460
Deformation / mm
Settlement
Deformation
Side Convergence
Deformation
Influence and Evaluation of Potential Fractured Zone by Surrounding Rockmass Deformation during Deep Tunneling Blasting Excavation
281

3 DEFORMATION
DISTRIBUTION
CHARACTERISTICS OF
TUNNEL EXCAVATION
3.1 Abrupt Deformation Mechanism
Induced by Integrity Change of
Tunnel Surrounding Rockmass
Previous studies on deformation distribution caused
by tunnel blasting excavation have more concern to
tunnel cross section. According to the Kastner
Equation 1 (Cui et al, 2014), plastic zone boundary
deformation u* and tunnel wall deformation u can be
calculated in Equation 2 and 3, if the shear expansion
of surrounding rocks is ignore.
)
sin2
sin1
(exp
cossin1
0
0
cctgp
ctgcc
R
R
i
p
(1)
cossin
1
0
*
cR
E
u
p
(2)
0
2
0
2
*
0
2
)(
R
RRK
u
R
R
u
pp
(3)
where, R
0
is tunnel radius, R
p
is plastic zone radius, σ
0
is initial in-situ stress, P
i
is support resistance, φ is
internal friction angle, μ is Poisson's ratio, E is elastic
modulus, and K is plastic zone shear coefficient.
It can be seen that tunnel wall deformation is
approximately proportional to the square of the radius
of the plastic zone, and the deformation of the
surrounding rock is larger when angle of internal
friction is small or in-situ stress is larger. During
tunnel excavation, the sudden encountering of a
fractured zone is actually a sudden change in
rockmass integrity in the longitudinal profile, thus
will induce a large and rapid increase in deformation.
3.2 Abrupt Deformation Mechanism
Induced by Integrity Change of
Tunnel Surrounding Rockmass
Studies on longitudinal deformation curve (LDC)
were mainly limited by the three-dimensional
characteristics of this subject. Studies on convergence
deformation induced by tunnel excavation were
mainly about radial deformation (Carranza-Torres
and Fairhurst, 2000). Under the assumption of linear
elastic assumption, the radial deformation of
surrounding rockmass of circular tunnel can be
expressed in polar coordinate equation:
2θcos
r
R
μ14λ1λ1
2Er
1+μRσ
U
2
2
1
r
(4)
where, λ is the lateral pressure coefficient, μ is
poisson's ratio, σ
1
is the maximum overburden
pressure, η is the constraint loss.
Panet (1995) put forward:
2
00
max
-1-1
RZm
m
U
U
r
(5)
Hoek (1988) proposed:
7.1
max
1.1
exp1
R
Z
U
U
r
(6)
Most empirical formulas for longitudinal
deformation variation were established based on a
large amount of monitored deformation data. They
can describe variation of radial deformation along
unsupported tunnels. However, after considering the
influence of a fractured zone in front of tunnel face,
the deformation distribution on longitudinal profile is
more complicated, thus numerical calculation method
is adopted to carry out a three-dimensional analysis
(Basarir, 2010).
4 ANALYSIS OF DEFORMATION
CHARACTERISTICS OF
SURROUNDING ROCKMASS
NEAR FRACTURED BAND
4.1 Physical and Mechanical
Parameters of Rockmass and
In-situ Stress Field
Laboratory tests of the sample of rock mass were
carried out. Results showed that the rockmass of
fractured band was mostly formed under tectonic
movement, of which the unit weight was 18.2~19.6
KN/m
3
. Rockmass in the fractured band has a
relatively uniform gradation. Its coarse particle size
filled with fine particles, thus has a higher internal
friction angle and cohesion force. So, in original
stable state, it can be regarded as equivalent
elastoplastic body, thus the Drucker-Prager yield
criterion is used to calculate the physical and
mechanical parameters of the rockmass as Table 2.
SIMULTECH 2020 - 10th International Conference on Simulation and Modeling Methodologies, Technologies and Applications
282
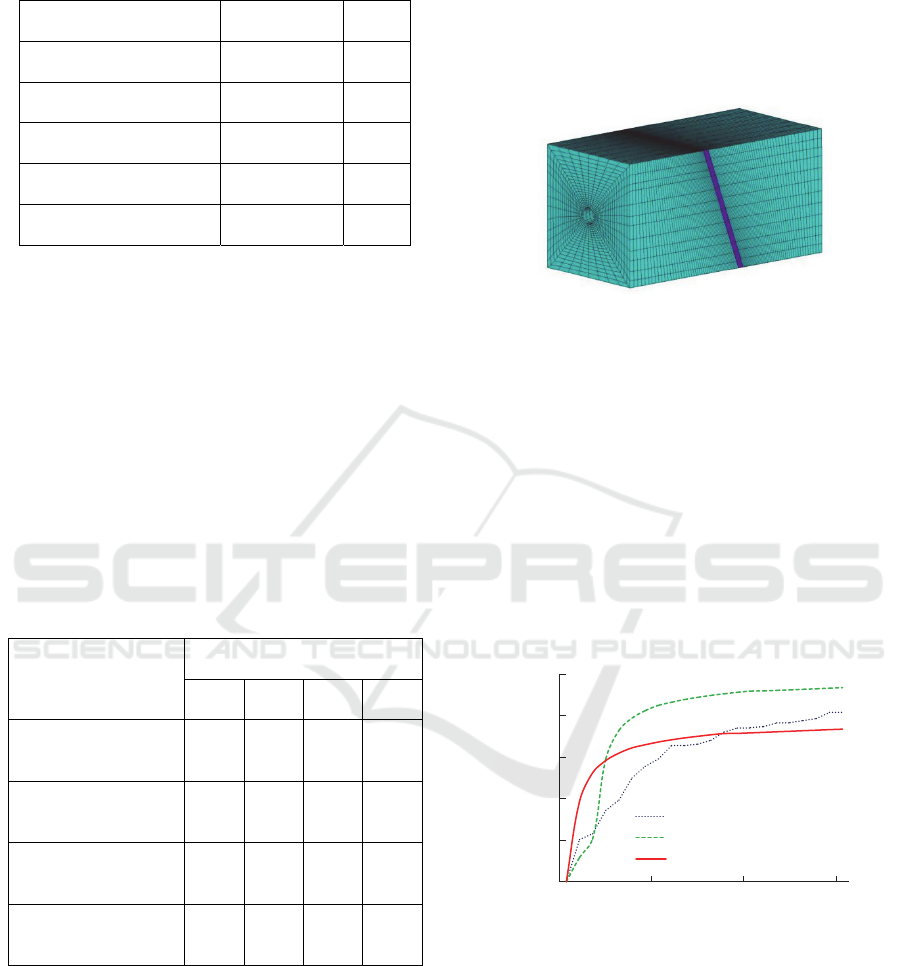
Table 2: Classification and design excavation method for
surrounding rockmass of Daliang tunnel.
Parameter Fractured zone Slate
Elastic Modulus / GPa 2.2 6.8
Poisson's Ratio 0.4 0.31
Cohesion / MPa 0.3 0.64
Internal Friction Angle / ° 27 47
Unit Weight / KN/m
3
18.9 26.2
Based on the field test, the effective in-situ stress
test data were obtained in the borehole at depth of
15.0m, 18.5m, 19.0m and 27.0m in the inclined shaft,
as shown in Table 3. It is shown that the maximum
value of maximum horizontal principal stress at the
measured depth is 25.14MPa, and is approximately
perpendicular to the borehole axis. The maximum
value of the minimum horizontal principal stress is
13.77MPa. The maximum vertical stress is 12.30MPa.
The lateral pressure coefficient is between 1.89 and
2.08, and is consistent to strata curvature observed on
tunnel face. The in-situ stress is applied to the
calculation model based on test results.
Table 3: Vertical drilling water pressure fracturing results
(2012).
Parameter
Test section depth / m
15 18.5 22 27
Maximum Horizontal
Principal Stress / MPa
23.55 25.14 23.04 24.81
Minimum Horizontal
Principal Stress / MPa
12.95 13.45 13.77 13.37
Vertical Principal
Stress / MPa
12 12.09 12.18 12.3
Lateral Pressure
Coefficient
1.96 2.08 1.89 2.02
4.2 The Finite Element Analysis and
Comparison of the Deformation
Due to Influence of Fractured Zone
A three-dimensional finite element calculation model
is established for practical engineering. The length of
the model is 100m and the width is 200m. The model
is meshed into 117,872 eight-node elements and
120,098 nodes. The fractured zone is meshed by
smaller elements as shown in Figure 5. Element live-
and-kill method is adopted in simulating excavation
process, with excavation footage of 1m. Deformation
evolution of surrounding rockmass at each measuring
points are calculated for the process of tunneling into
the fractured zone.
Figure 5: Finite element model.
Blasting excavation to the vicinity of the tunnel
collapse section is analyzed. Judging by collapse area
width and strata dip angle, the thickness of the
fractured band is about 7m, and the inclination is
about 66° inclination. The strike of the fractured zone
is perpendicular to the excavation direction, and dip
is in the same direction as excavation direction. Based
on the actual excavation process, the excavation rate
is 1m/d, the deformation and evolution of the
surrounding rockmass of each measuring point are
calculated in the process of heading into the fractured
zone and compared with the measured data, as shown
in Figure 6.
Figure 6: The calculative results compared with the
measured data.
Comparison between calculated results and the
measured data of the settlement of the top arch of the
distance crushing zone 38m shows small difference.
On the one hand, in the calculated deformation curve,
obvious deformation rate increases can be observed
about 1 days after the excavation of the measuring
section, showing obvious inflection point on the
deformation-time curve. However, no inflection point
can be observed on the monitored curve. On the other
0
10
20
30
40
50
2013/1/28 2013/2/4 2013/2/11 2013/2/18
Deformation at Arch / mm
Monitored Data
Calculation Result
Calculation Result with Delay
Influence and Evaluation of Potential Fractured Zone by Surrounding Rockmass Deformation during Deep Tunneling Blasting Excavation
283

hand, the accumulative deformation value of the two
curves show up to 10 mm difference on the 31st day.
However, in actual excavation, when the measuring
section has just been exposed, installation of
monitoring points could be very risky near tunnel face.
Therefore, the actual monitoring process usually
starts several days after the section was exposed.
Considering the above fact, the calculated excavation
curve is shifted leftwards. The new curve shows
consistence with the monitored curve in deformation
trend and value.
Figure 7: The accumulative settlement of the measured
points as tunneling proceeding.
Figure 8: Calculated values for accumulative subsidence
after exposure at different locations.
Variation of arch settlement of each measuring
point during tunneling into the fractured band is
further analyzed, and a three-dimensional surface
map is drawn as shown in Figure 7. The accumulated
settlement distribution of each measuring section is
plotted in as tunnel face is advancing. The negative
value in distance between the monitored section and
the fractured zone indicates that the monitored section
is located behind the fractured zone. The distance
between tunnel face and the fractured zone varies
from 48m to 0. Result shows that when the tunnel face
is constantly advancing to the fractured zone, the
settlement of surrounding rockmass is quite different
on each monitoring section.
Given the ideal situation in the actual monitoring,
in which monitoring starts once the section is exposed
by excavation, the settlement variation of the
monitored sections in different distance to the
fractured zone are plotted as separate curves.
Accumulative settlement deformation of each
monitoring section is shown in Figure 8. Observation
shows the accumulative deformation value of the
monitored section 51m away from the fractured zone
is the largest, while that 21m away from the fractured
zone is the smallest. As shown in Figure 7, the total
accumulative deformation of the monitored section
closer to the fractured zone is larger (including the
deformation before the monitored section is exposed).
On the other hand, the complete deformation time
curve of the monitored section should have an
inflection point. In the deformation accelerating
period from the beginning of the deformation, the
deformation rate is increasing, while the deformation
rate will be decreasing, after the inflection point. If
the deformation curve of the monitored section at
different distances from the fractured zone is a
function of time as Equation 7.
txfx ,
(7)
When x is determined, the function should have
an inflection point at t > 0, and the inflection point
would not be monitored when there is a fractured
zone at a certain distance in front.
Figure 9: Statistical analysis of accumulative deformation
measured at different monitoring sections.
The relationship between monitoring date and
accumulative settlement deformation of different
sections is shown in Figure 9, from which
comprehensive analysis is carried out on the
monitored data of the tunnel sections between
DK330+029 and DK330+115. Rockmass quality
change is very small among there sections, while no
fractured zone was found. On February 18, 2013, the
0
10
20
30
40
50
0 5 10 15
Accumulated
Deformation / mm
Days after Exposure by Excavation / d
5
1
m
4
8
m
0
50
100
150
200
0 10203040506070
Accumulated
deformation / mm
Days Monitored / d
Accumulated Deformation/ mm
Cubic Polynomial Fitting
SIMULTECH 2020 - 10th International Conference on Simulation and Modeling Methodologies, Technologies and Applications
284

accumulative settlement value of the top arch has a
significant inflection point in the fitting curve.
Cubic polynomial is used to fit monitored
deformation, for further study on identifying the
inflection point on the deformation curve, as Equation
8, with correlation coefficient of 98.6%.
Y = -0.0012x
3
+0.1117x
2
+0.1866x (8)
Given the second derivative of Y(x) being 0, the
inflection point position X ≈ 31d. It means that on the
deformation curve, deformation rate changes from
continuously increasing to reducing on the 31st day.
However, compared with Figure 6, it is found that the
inflection point was not observed in the deformation-
time curve monitored after the section around the
fractured zone is exposed. It is indicated that the
deformation of this section has already been
influenced by the excavation area before this section
being exposed by excavation. Actual accumulative
deformation should be larger. It can also be seen from
Figure 7 that the inflection point in the deformation-
time curve on the section closer to the fractured zone
should occur before the section is exposed by
excavation, i.e. X
i
< 0.
4.3 Influence of Inclined Angle on
Deformation Curve of Surrounding
Rockmass
The deformation of the surrounding rockmass caused
by tunnel excavation through fractured zone in
different inclinations are analyzed. As analyzed by
similar method as shown in Figure 9, the position of
the inflection point on the settlement deformation
curves of sections in various axial distances to the
fractured zone are shown in Table 4.
As observed, under the influence of specific
inclination angle of the fractured zone, the inflection
point would appear sooner after the section is exposed,
when the section is closer to the fractured zone. The
change in inclination angle of the fractured zone has
a great influence on when the inflection point would
appear. When the inclination angle is small, the
inclination change has a greater effect on the change
of the inflection point position on time domain. When
the inclination angle is close to 90°, the inflection
position is not sensitive to inclination angle. However,
when the inclination angle is smaller, the location of
inflection point on the deformation-time curve is
much more sensitive. For example, when the
inclination angle is 100°, if the section is monitored
right after exposure, the inflection point can still be
monitored a few days later. So as to determine a
possible existence of a fractured zone several tens of
meters ahead the monitored section. Thus timely
adjustment can be applied to excavation and support
parameters, to avoid a potential large-scale
construction disasters.
Table 4: Inflection point position of different monitoring
sections due to inclination change of fractured zone.
Distance to
Fractured
Zone / m
Inclination angle of fractured zone / °
40 50 60 70 80 90 100 110 120 130 140
51 -6 -1 3 6 7 8 10 11 12 13 15
42 -9 -4 0 2 4 6 8 9 10 12 14
33 -13-8-40 1 3 5 7 8 1012
21 -18 -12 -7 -3 -1 1 3 5 6 8 11
5 CONCLUSION
Analysis of the collapse disaster during the blasting
excavation of the Lanzhou-Xinjiang high-speed
railway, due to the existence of a fractured zone. The
selection of reasonable blasting parameters is of great
significance to avoid the construction disaster caused
by fractured zone. Following conclusions can be
drawn based on theoretical and numerical analysis on
the monitored data of surrounding rockmass
deformation in different tunnel section.
(1) The deformation rate of surrounding rockmass
in increases first and then decreases along tunnel axis,
when rockmass integrity is high and even. And there
is an inflection point on the deformation-time curve.
By observing the occurrence date of the inflection
point after section exposure, the possibility of
fractured zone ahead can be estimated, and
reasonable adjustment can be applied to excavation
and support blasting excavation parameters to avoid
construction disasters.
(2) The deformation process of the surrounding
rockmass is obviously affected by fractured zone in
vicinity, which makes a sooner appearance of the
inflection point on deformation-time curve. Under the
same circumstance, the surrounding rockmass near
the fractured zone may even generate a large portion
of deformation before excavation, and the inflection
point may disappear in the monitored deformation
curve from the exposure of the section. And the
deformation rate might only be reducing after the
excavation.
Influence and Evaluation of Potential Fractured Zone by Surrounding Rockmass Deformation during Deep Tunneling Blasting Excavation
285

(3) When the inclination angle of the fractured
zone is small, the location of inflection point on
deformation-time curve is more sensitive to the
change of inclination angle. And it is much less
sensitive to the inclination angle, when it is close to
90°.
ACKNOWLEDGEMENTS
This work was supported by the Postdoctoral
Innovation Research Post in Hubei Province
(20201jb001), the Fundamental Research Funds for
the Central Universities (WUT: 2019IVA098), the
Youth Talent Project of Science and Technology
Research Program of Hubei Provincial Department of
Education (Q20192801), and the Fundamental
Research Funds for the National Natural Science
Foundation of China (
51779197, 51979208,
51774222
).
REFERENCES
Alejano, LR., Rodriguez-Dono, A., Veiga, M., 2012.
Plastic radii and longitudinal deformation profiles of
tunnels excavated in strain-softening rock masses.
Tunnelling and Underground Space Technology, 30:
169-182.
Basarir, H., Genis, M., Ozarslan, A., 2010. The analysis of
radial displacements occurring near the face of a
circular opening in weak rock mass. International
Journal of Rock Mechanics and Mining Sciences, 47(5):
771-783.
Cai, Y., Jiang, Y., Djamaluddin, I., Iura, T., Esaki, T., 2015.
An analytical model considering interaction behavior of
grouted rock bolts for convergence-confinement
method in tunneling design. International Journal of
Rock Mechanics and Mining Sciences, 76: 112-126.
Carranza-Torres, C., Fairhurst, C., 2000. Application of the
convergence-confinement method of tunnel design to
rock masses that satisfy the Hoek-Brown failure
criterion. Tunnelling and Underground Space
Technology, 15(2): 187-213.
China Railway First Surver and Design Institute Group CO.,
LTD. 2010. Risk Evaluation Report for Daliang Tunnel
of Gansu-Qinghai Section on New Second Lanzhou-
Urumqi Double-track Railway.
Cui, L., Zheng, J., Zhang, R., Zhang, W., 2014. Study of
support pressure and surrounding rock deformation of a
circular tunnel with an elastoplastic softening model.
Rock and Soil Mechanics, 35(3): 717-722+728.
Fatemi Aghda, S., Ganjalipour, K., Esmaeil Zadeh, M.,
2016. Comparison of Squeezing Prediction Methods: A
Case Study on Nowsoud Tunnel. Geotechnical and
Geological Engineering, 34(5): 1487-1512.
Hoek, E., 1988. In The Hoek-Brown failure criterion-a
1988 update, Proc. 15th Canadian Rock Mech. Symp,
'Ed.' Toronto, Dept. Civil Engineering, University of
Toronto, p: 31-38.
Institute of Rock and Soil Mechanics, Chinese Academy of
Sciences, 2012. High In-situ Stress and Surrounding
Rockmass Deformation Report for Daliang Tunnel of
Gansu-Qinghai Section on New Second Lanzhou-
Urumqi Double-track Railway.
Kun, M., 2013. Onargan T. Influence of the fault zone in
shallow tunneling: A case study of Izmir Metro Tunnel.
Tunnelling and Underground Space Technology, 33:
34-45.
Lenz, G., Kluckner, A., Holzer, R., Stadlmann, T.,
Schachinger, T., Gobiet, Gl., 2017. Prediction of fault
zones based on geological and geotechnical
observations during tunnel construction. Geomechanics
and Tunnelling, 10(4): 366-379.
Lin, D., Yuan, R., Shang, Y., Bao, W., Wang, K., Zhang,
Z., Li, K., He, W., 2017. Deformation and failure of a
tunnel in the restraining bend of a strike-slip fault zone:
an example from Hengshan Mountain, Shanxi Province,
China. Bulletin of Engineering Geology and the
Environment, 76(1): 263-274.
Lisjak, A., Garitte, B., Grasselli, G., Muller, HR., Vietor, T.,
2015. The excavation of a circular tunnel in a bedded
argillaceous rock (Opalinus Clay): Short-term rock
mass response and FDEM numerical analysis.
Tunnelling and Underground Space Technology, 45:
227-248.
Lu, AZ., Chen HY., Qin, Y., Zhang, N., 2014. Shape
optimisation of the support section of a tunnel at great
depths, Computers and Geotechnics, 61: 190-197.
Moffat, R., Sotomayor, J., Beltran, JF., 2015. Estimating
tunnel wall displacements using a simple sensor based
on a Brillouin optical time domain reflectometer
apparatus. International Journal of Rock Mechanics and
Mining Sciences, 75: 233-243.
Panet, M., 1995. Le calcul des tunnels par la méthode
convergence-confinement. 'Ed.' Presses ENPC.
Vlachopoulos, N., Diederichs, MS., 2009. Improved
Longitudinal Displacement Profiles for Convergence
Confinement Analysis of Deep Tunnels. Rock
Mechanics and Rock Engineering, 42(2): 131-146.
Zhang, G., Jiao, Y., Wang, H., 2014. Outstanding issues in
excavation of deep and long rock tunnels: a case study.
Canadian Geotechnical Journal, 51(9): 984-994.
Zhao, K., Bonini, M., Debernardi, D., Janutolo, M., Barla,
G., Chen, GX., 2015. Computational modelling of the
mechanised excavation of deep tunnels in weak rock.
Computers and Geotechnics, 66: 158-171.
SIMULTECH 2020 - 10th International Conference on Simulation and Modeling Methodologies, Technologies and Applications
286
