
Comparing Creativity, User-experience and Communicability Linked to
Digital Tools during the Fuzzy Phases of Innovation
Mille Charles, Christmann Olivier, Fleury Sylvain and Richir Simon
Arts & M
´
etiers Sciences et Technologies, LAMPA, HESAM Universit
´
e, F-53810 Chang
´
e, France
Keywords:
Creativity, Communicability, User Experience, Virtual Reality, Sketching, Computer Aided-Design, Ideation,
Immersive Sketching, Immersive CAD.
Abstract:
Innovation is defined by a range of activities having different goals but driven by the same purpose. For
example, in the ending phases, the aim will be to put forward precise concepts, while upstream of innovation,
the activities are defined by the will to investigate the subject and increase the area of knowledge and concepts
helpful for the conception of new products. This study takes place in the latter contexts because these are
the ones where tools are the most variable and de facto, the least normalised. Our aim was to study user
experience felt by the usage of these tools as well as their impact on creativity and ideas’ communicability. To
do this, we led an experimental study with 79 participants comparing four tools: pen & paper, Virtual-Reality
(VR) drawing, VRCAD, and traditional CAD. Thanks to the UEQ (Laugwitz et al., 2008) and judges method
of Cropley and Cropley (2008), we measured the user-exprience and the creativity. Then we compared the
level of creativity, user-experience and communicability induced by each tool. The results reveal that the user
experience arising from the tool influences the amount and the quality of the ideas. Moreover, we show that
the fewer standardises interactions the tools have, the greater the communicability of ideas.
1 INTRODUCTION AND
RELATED WORKS
Innovation is a succession of activities allowing to
bring new concepts coming from a knowledge base
that is refined as the project materialises (Le Masson
et al., 2006) and being realised by several persons
coming from different cultures (Dorta, 2004). The
Funnel model (Dunphy et al., 1996) of innovation de-
picts this refinement of knowledge to emit concepts
which can be in fine transmitted to design activities.
Upstream of innovation, activities will allow widen-
ing knowledge of the field to enable new concept pro-
posals; at the end of these activities, generated con-
cepts are more precise. Midler (1995) demonstrated
in his model that the supply of knowledge in a project
limits the proposal field’s freedom to transform it
into a concept. These activities of knowledge sup-
ply and evolution of ideas and models can be divided
and studied independently because they have specific
objectives. Lecossier and Pallot (2017) proposed a
three-fold segmentation of innovation: (i) ”strategy”
targets the angle of approach to produce new con-
cepts, (ii) ”ideation” creates new concepts and (iii)
”validation” selects the most concrete concept to give
to the design services. Ideation activities are those
that are the most equipped (Gabriel et al., 2016), but
there is no consensus on the design, experience, or
ergonomics of these tools. Amabile (1983) showed
that idea development is influenced by internal mark-
ers (e.g., competences, knowledge, motivation, etc.)
and external ones (e.g., allowed resources, environ-
ment, etc.). It seems important to evaluate the cre-
ative experience as it will allow to justify tool choice
according to ideation activity requirements. Assess-
ing the user experience will complete the evaluation
of the tools and help to understand the needs of the
users during creative activities. Several studies have
proposed tools to assess the ideation or creative po-
tential of an organisation (Lecossier and Pallot, 2017)
or a tool (Cherry and Latulipe, 2014), which can help
innovation managers in making their choice. How-
ever, these tools do not provide keys to measure the
transmission of ideas between stakeholders, which is
essential for innovation.
Still today, Computer-Aided Design (CAD) tools,
by their place in design activities, are frequently used
for the proposition of new models or concepts (Fucci,
2011). Nevertheless, Kosmadoudi et al. (2013) had
shown that professional digital tools have low creativ-
Charles, M., Olivier, C., Sylvain, F. and Simon, R.
Comparing Creativity, User-experience and Communicability Linked to Digital Tools during the Fuzzy Phases of Innovation.
DOI: 10.5220/0009894300870095
In Proceedings of the 4th International Conference on Computer-Human Interaction Research and Applications (CHIRA 2020), pages 87-95
ISBN: 978-989-758-480-0
Copyright
c
2020 by SCITEPRESS – Science and Technology Publications, Lda. All rights reserved
87

ity performance. These creative problems are due to
their complexity and level of abstraction that ”lock”
users into usage strategies. These tools do not en-
courage new initiatives, reduce risk taking and finally,
user creativity. The transition from ideas to a CAD
concept does not allow a perfect maturation of ideas.
It seems necessary to simplify tools and/or use game
mechanisms to provoke interest and wish to explore
tool possibilities. Adding steps, thanks to new tools,
might be the solution, if the tools have a benefit com-
pared to traditional tools (Dorta, 2004). To that ex-
tent, virtual reality tools seem to agree with these con-
straints, as several studies had demonstrated the in-
terest of virtual reality for innovation. For instance,
Rieuf (2013) demonstrated that his virtual drawing
application allowed users to better recognise the emo-
tions the designers had associated with their mod-
els. In their study comparing differences of creativ-
ity between a pen & paper drawing and virtual draw-
ing, Yang et al. (2018) demonstrated that the virtual
application allowed the proposition of more diver-
gent ideas. Feeman et al. (2018) compared CAD and
Virtual-Reality CAD (VRCAD) for creativity. Their
study highlighted the utility of virtual reality for quick
product conception during simple creativity tasks. Fi-
nally, Calderon-Hernandez et al. (2019) highlight that
immersive representations of a construction are more
comprehensible than a 2D drawing. Immersive tools
seem to have the potential to enhance conception
tasks by adding new features (Fleury et al., 2020).
Through this study, we want to demonstrate the po-
tential of immersive tools for creativity.
The present study allowed us to compare the ”cre-
ative potential” of four tools : pen & paper, CAD, VR-
CAD, and Virtual-Reality (VR) drawing. We chose to
compare these tools according to Dorta’s 2004 study
claiming that there are not enough steps between an
idea design with a simple tool, like a pen and paper,
and a CAD software. Thus, our study will allow us to
compare virtual-reality tools to traditional ones, based
on the quantity and the quality of ideas and user ex-
perience. We suppose that the stimulating, clear, and
hedonic aspect of a tool will enable a better idea pro-
duction (Rieuf, 2013; Feeman et al., 2018; Yang et al.,
2018). By contrast, we hypothesise that standardisa-
tion of interactions will enable users to present more
formalised ideas, which will be more understandable
and therefore will have better communicability.
To study relationships between user experience,
creativity and communicability, we designed a cre-
ative task with four different kinds of tools: a pen
& paper, VR drawing, VRCAD, and CAD. We mea-
sured, through a questionnaire, user experience and
communicability. Cropley and Cropley’s method was
used to assess creativity of ideas. Measured creativity,
and communicability were linked to user experience.
2 METHOD
For this study, 79 participants were recruited. They
were all trained in the use of CAD software. Par-
ticipants included 66 (82.5%) men and 14 (17.5%)
women. The median age was 22 years old for a stan-
dard deviation of 4.33. The youngest of our panel
group was 17 years old; and the eldest was 46 years
old. Our panel was composed of students coming
from engineering training.
2.1 Materials
To compare different tools, possibly used for creativ-
ity, we selected four of them. For the two extreme
ones, we chose pen & paper and CAD. The pen & pa-
per is a tool that everyone knows how to use to draw
freely and that does not present any constraint of use.
For CAD software, we chose Solidworks that allows
3D concept modelling through standardised interac-
tions, with a mouse and keyboard, which enable the
export of files to other platforms. Moreover our panel
used to work with Solidworks.
We selected two intermediate tools in order to val-
idate the benefits and impacts of virtual reality com-
pared to the aforementioned traditional tools. We
used the VR application Time2Sketch (see figure 1),
which works with an HTC Vive and computer with
Windows 10. This application allows the user to draw
in a 3D virtual environment. The user can find a
colour, size and tone palette on the right. By ap-
proaching a controller to the palette, the user can se-
lect a colour, and by pushing the trigger, the user can
draw freely in the environment. One button is placed
behind the user to save the drawing and reset the en-
vironment. A 3D model of an umbrella is disposed
in front of the user. The umbrella can be moved by
grabbing it with the controllers.
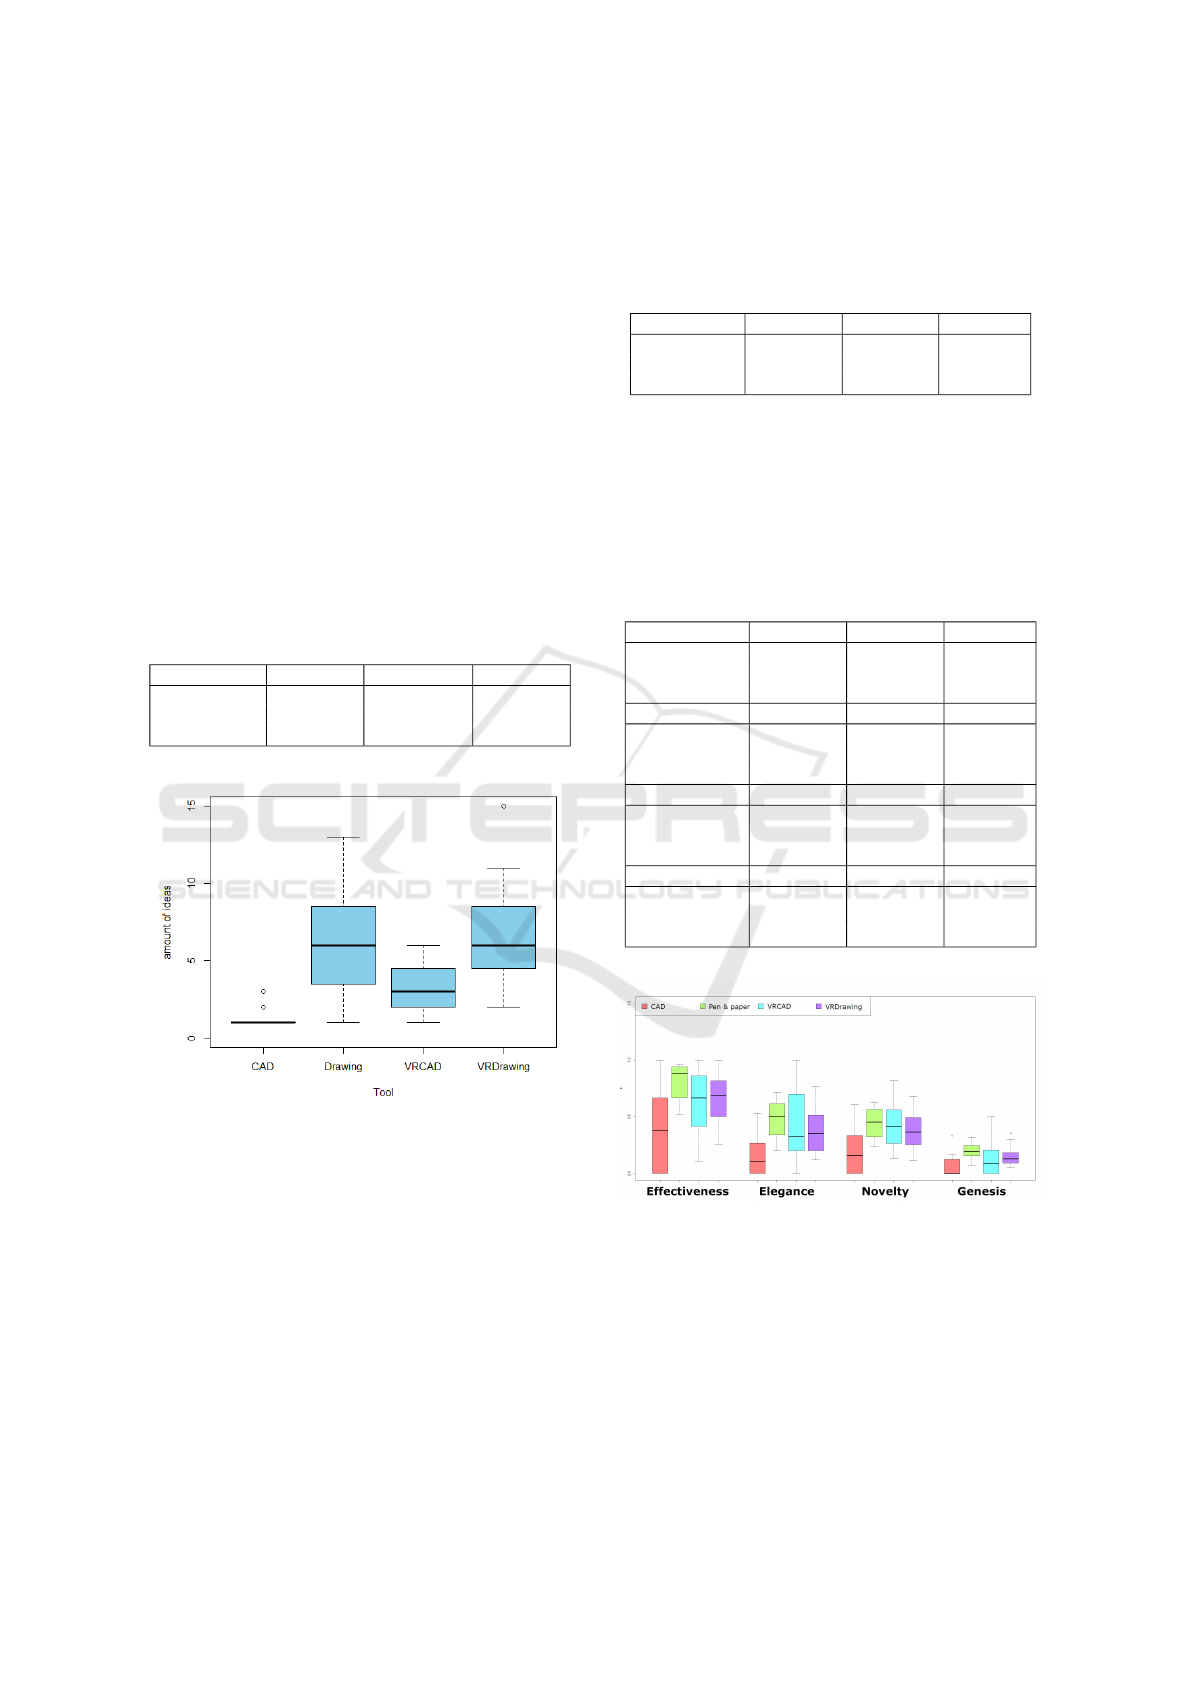
The last tool is the immersive CAD application
Blocks (see figure 2). This tool uses some CAD
paradigms while maintaining freedom of movement,
interaction and visualisation that virtual reality can of-
fer.
2.2 Procedure
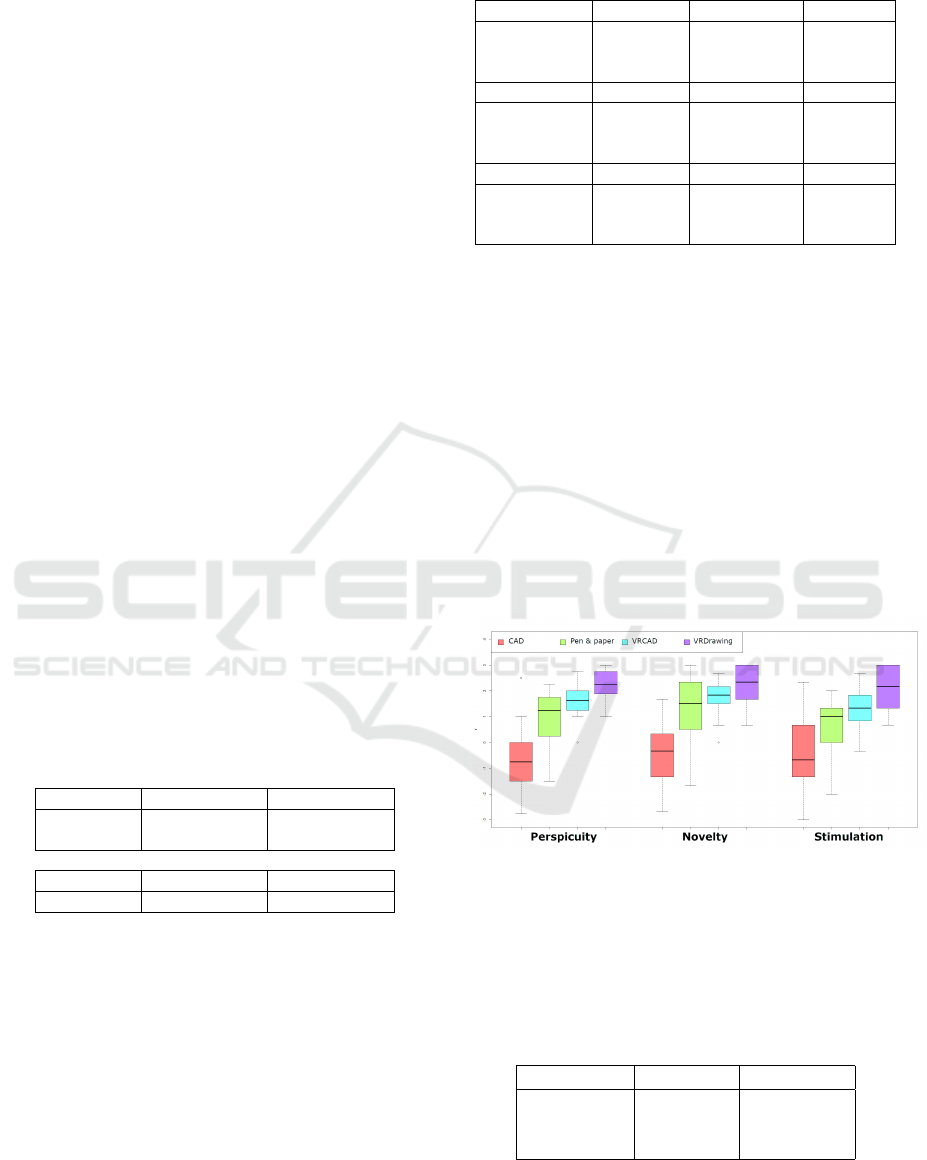
As figure 3 shows, the experiment has two parts: (i)
the first measures the impact the selected tools have
on creativity and (ii) the second assesses the gener-
ated ideas communicability for each tool. This study
CHIRA 2020 - 4th International Conference on Computer-Human Interaction Research and Applications
88
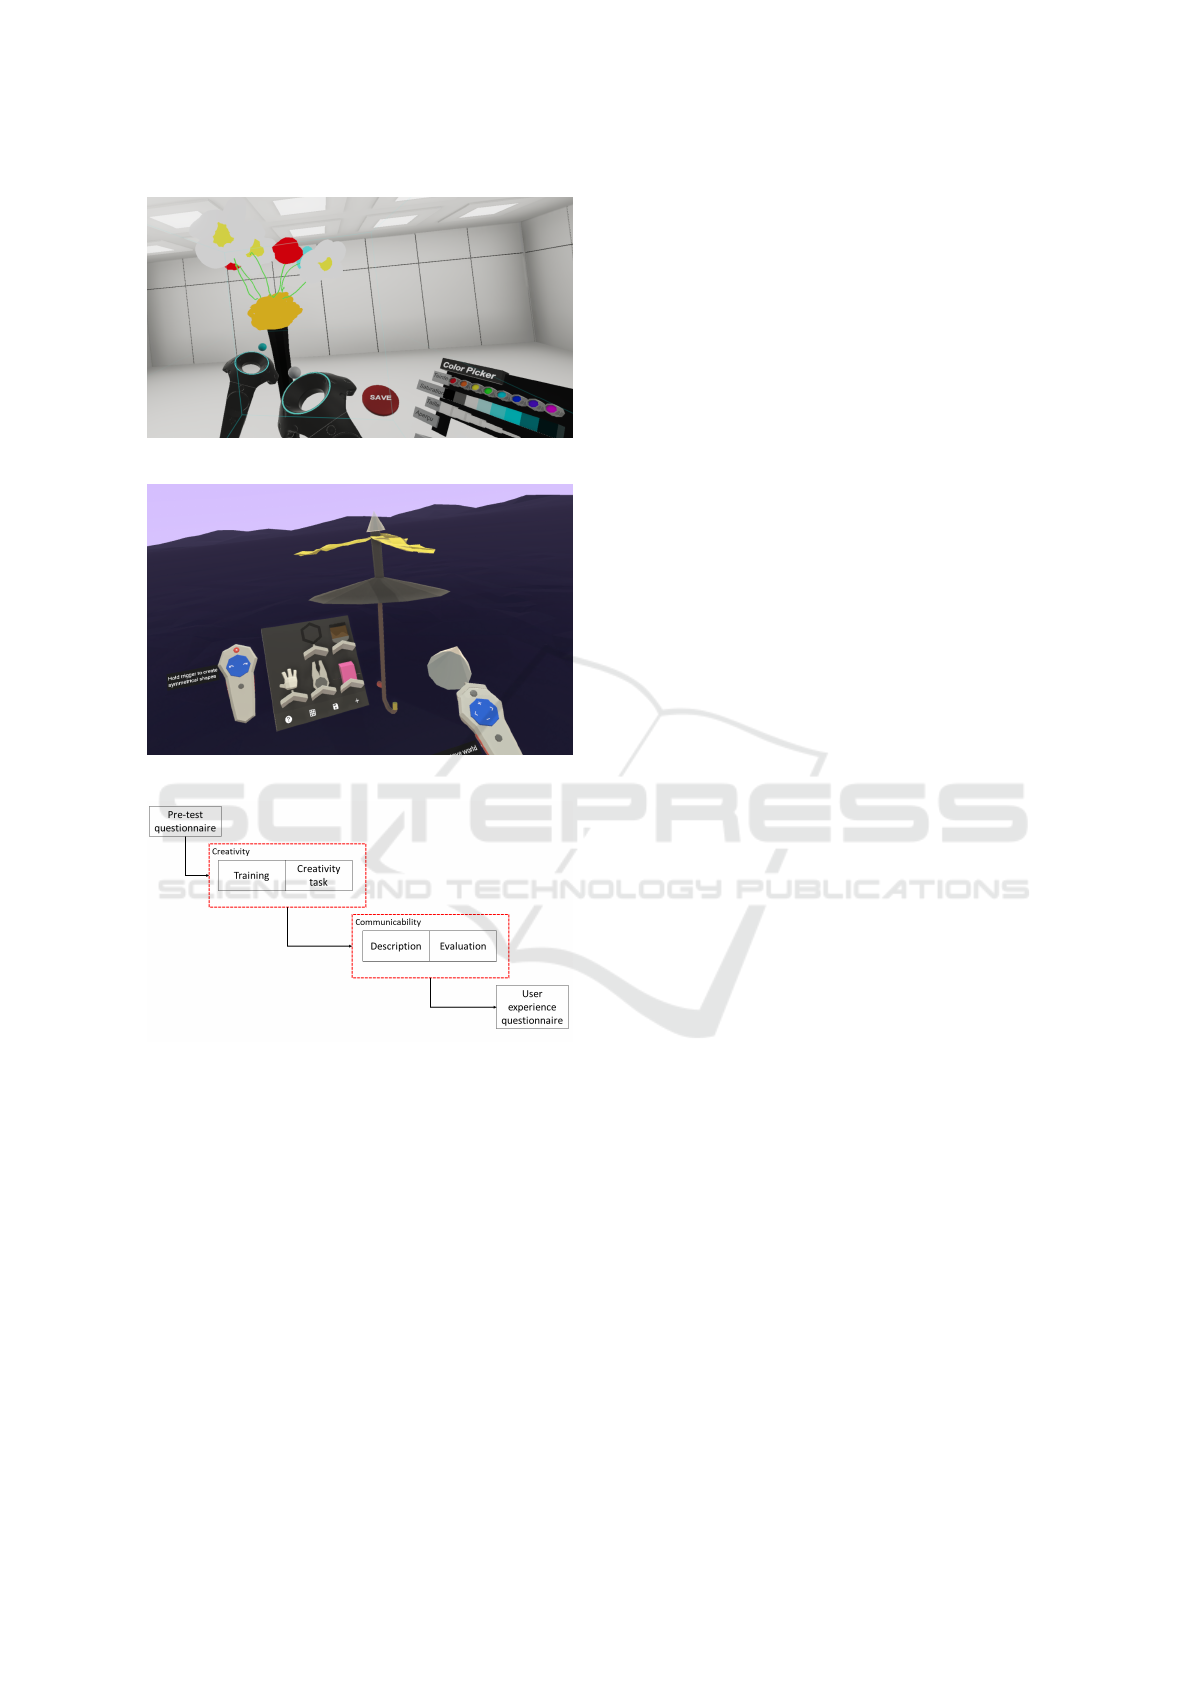
Figure 1: VR drawing application: Time2Sketch.
Figure 2: VR CAD application: Google Blocks.
Figure 3: Representation of the experiment proceeding.
follows a between-subject experimental design, with
four groups of participants, one per tool. Even if the
drawing task was done on their own, the communi-
cability part was done in pairs. Participants had to
describe the idea of their partner.
At the beginning of the experiment, participants
ware invited to complete the first questionnaire to col-
lect demographic data (gender, age), their ability to
use virtual reality and CAD software.
The first phase of experimentation was dedicated
to the task of creativity. A training of around five
minutes was proposed to participants to help them
to get familiar with the tool they will use regarding
their group. As aforementioned, participants were se-
lected for their ability to use CAD software. Then
participants were invited to carry out a creative task
for fifteen minutes which consisted in proposing as
many solutions as possible to add new functionalities
to an umbrella. Depending on the tool used, partici-
pants were given a non-editable 3D model or an A4
sheet paper with a representation of an umbrella from
different perspectives. Participants were asked to not
take into account any feasibility constraints. Ideas had
to be drawn and without text. After the creativity task,
participants were invited to complete the User Expe-
rience Questionnaire (Laugwitz et al., 2008). Follow-
ing this first phase, each participant was invited to in-
terpret the ideas drawn by the other participant and to
write what she/he understood. Finally, the author of
the idea evaluated the other participant’s interpreta-
tion by giving a score from 1 to 9, depending on how
well it matched the idea. This mark established our
measure of idea communicability.
2.3 Measures
The following measures allowed us to make links be-
tween a tool’s user experience, creative quality, and
ideas communicability :
• Creativity
– Number of ideas produced.
– Quality of the ideas (a jury of three persons
helped to evaluate the proposed ideas’ quality.
Their rating was based on four axes : effective-
ness, novelty, elegance and genesis, according
to the method of Cropley and Cropley (2008)
through 23 items).
• User Experience : We used the User Experience
Questionnaire (UEQ) that measures the attractive-
ness, perspicuity, efficiency, dependability, stim-
ulation, and novelty of the tool used through 26
items (Laugwitz et al., 2008).
• Communicability : This measure corresponds to a
mark, from 1 to 9, assessing how well the other
participant’s interpretation matches the original
idea.
3 RESULTS
Before starting the analysis of our results, we firstly
defined the characteristic of our data set. A Levene’s
test allowed us to verify the heteroscedasticity of all
the variables considered, imposing the use of non-
parametric tests.
We will first report the results concerning the
number of ideas and their creative quality, relatively
Comparing Creativity, User-experience and Communicability Linked to Digital Tools during the Fuzzy Phases of Innovation
89
to each tool. Then we will present the user experi-
ence analysis, and we will finish with the study of the
communicability of ideas.
3.1 Creativity in Accordance with the
Tool
3.1.1 Number of Ideas Produced
A Kruskal-Wallis test revealed a statistically signif-
icant difference in the number of ideas per partici-
pant according to the tool (χ
2
= 44.69; p < 0.01). Ta-
ble 1 summarises pairwise comparisons using Mann-
Whitney tests and figure 4 shows that the CAD soft-
ware has a lower median score than the three other
tools. The virtual CAD software has a lower median
score than a pen and paper.
Table 1: Pairwise comparisons of the amount of ideas per
participant for each tool.
CAD pen &paper VR CAD
pen & paper < 0.01 ∗ ∗ - -
VR CAD 0.04* 0.038* -
VR Drawing < 0.01 ∗ ∗ 0.908 < 0.01 ∗ ∗
∗p < 0.05; ∗ ∗ p < 0.01
Figure 4: Number of ideas per participant for each tool.
3.1.2 Creative Nature of Ideas
The idea quality analyses are based on the judge’s
method proposed by Cropley and Cropley (2008).
A Cronbach’s alpha test revealed acceptable internal
consistency (α = 0.802) between the rating of the
three judges.
First, we analysed the impact of tools on idea qual-
ity. A Kruskal-Wallis test (χ
2
= 29, 62; p < 0.01)
showed a significant statistical difference in the qual-
ity of ideas according to the tool. Pairwise compar-
isons of table 2 showed significant differences be-
tween CAD and each other tools, pen & paper and
each of the other tools. Figure 5 reveals that a pen &
paper have a higher score median than the other tools.
Table 2: Pairwise comparisons of global Cropley’s score
according to the tool.
CAD Pen/paper VR CAD
Pen & paper < 0.01 ∗ ∗ - -
VR CAD 0.012* 0.041* -
VR drawing < 0.01 ∗ ∗ 0.017* 0.99
∗p < 0.05; ∗ ∗ p < 0.01
We then conducted a detailed analysis by consid-
ering the scores for the dimensions of effectiveness,
novelty, elegance, and genesis. Results of pairwise
comparisons are summarised in table 3, and boxplots
are presented in figure 5, for each dimension.
Table 3: Pairwise comparison of Cropley’s scores according
to the tool.
Effectiveness CAD Pen/paper VR CAD
Pen & paper < 0.01 ∗ ∗ - -
VR CAD 0.038* 0.01* -
VR drawing < 0.01 ∗ ∗ 0.014* 0.894
Novelty
Pen & paper < 0.01 ∗ ∗ - -
VR CAD 0.011* 0.237 -
VR drawing < 0.01 ∗ ∗ 0.07 1
Elegance
Pen & paper < 0.01 ∗ ∗ - -
VR CAD 0.034* 0.029 -
VR drawing < 0.01 ∗ ∗ 0.067 0.854
Genesis
Pen & paper < 0.01 ∗ ∗ - -
VR CAD 0.956 < 0.01 ∗ ∗ -
VR drawing 0.21 0.126 0.176
∗p < 0.05; ∗ ∗ p < 0.01
Figure 5: Effectiveness, novelty, elegance, and genesis
scores in accordance with the tool.
For the effectiveness dimension, we observed a
statistically significant difference between the tools
(χ
2
= 31.597; p < 0.001). Table 3 and figure 5 show
CAD had a meaningfully lower median of effective-
ness than each other tools. Pen & paper had a signifi-
cantly higher effectiveness median than the VR draw-
ing.
CHIRA 2020 - 4th International Conference on Computer-Human Interaction Research and Applications
90
For novelty dimension, we noticed a statisti-
cally significant difference between the tools (χ
2
=
22.664; p < 0.001). Table 3 shows significant differ-
ences between CAD and each other tools. CAD has a
lower novelty median than the other tools (see figure
5).
For elegance dimension, we noticed a statisti-
cally significant difference between the tools (χ
2
=
22.489; p < 0.001). Table 3 shows significant differ-
ences between CAD and each other tools, pen & pa-
per, and VR CAD. Figure 5 shows CAD has a lower
median than the other tools, and VR CAD has a lower
median than pen & paper.
For the genesis dimension, we noticed a statisti-
cally significant difference between the tools (χ
2
=
21.546; p < 0.001). Table 3 shows a significant dif-
ference between CAD, and pen & paper, pen & paper
and VR CAD. Figure 5 shows that a pen & paper have
a higher median than CAD and VR CAD.
3.2 User Experience Analysis
We relied on the UEQ to measure the user experi-
ence induced by each tool. An initial analysis was
carried out on the different UEQ dimensions. Table
4 presents Cronbach’s alphas for the six UEQ dimen-
sions. To have significant consistency, we removed
one item of stimulation and novelty. We had accept-
able internal consistency for perspicuity, novelty, and
stimulation. However, the internal consistency of effi-
ciency, dependability and attractiveness was too weak
to analyse these items.
Table 4: Cronbach’s alphas for the differents UEQ cate-
gories.
Perspicuity Novelty Stimulation
0,76* 0,81 0,79
-0.19* 0.55*
Efficiency Dependability Attractiveness
-1,11* -2,9* -0,8*
* All items
A Kruskal-Wallis test revealed a statistically sig-
nificant difference for perspicuity (χ
2
= 41.38; p <
0.01), novelty (χ
2
= 30.745; p < 0.01) and stimula-
tion (χ
2
= 32.89; p < 0.01) according to the type of
tool. Then, we carried out pairwise comparisons for
these 3 dimensions between each tool.
For the perspicuity dimension, table 5 shows sig-
nificant differences between CAD tool and VR CAD,
VR drawing and CAD, pen & paper, and VR drawing.
Figure 6 shows that an immersive tool has a higher
median than the other tools for this UEQ dimension.
For the novelty dimension, table 5 shows signifi-
Table 5: Pairwise comparisons for the UEQ dimensions.
Perspicuity CAD Pen & paper VR CAD
Pen & paper 0.06 - -
VR CAD < 0.01 ∗ ∗ 0.29 -
VR drawing < 0.01 ∗ ∗ < 0.01 ∗ ∗ 0.19
Novelty
Pen & paper < 0.01 ∗ ∗ - -
VR CAD < 0.01 ∗ ∗ 0.835 -
VR drawing < 0.01 ∗ ∗ 0.16 0.616
Stimulation
Pen & paper 0.405 - -
VR CAD 0.012* 0.408 -
VR Drawing < 0.01 ∗ ∗ < 0.01 ∗ ∗ 0.078
∗p < 0.05; ∗ ∗ p < 0.01
cant differences between CAD and the drawing tools
(VR CAD, and VR drawing). CAD was perceived as
less novel than other tools (see figure 6). This nov-
elty evaluation relates to the profile and habits of us-
age of our participants, who mostly come from indus-
trial conception and engineering domains. Therefore,
CAD became the conventional tool, and the other
tools were perceived as more novel.
For the stimulation, table 5 shows significant dif-
ferences between CAD and VR CAD and VR draw-
ing. Also, between pen & paper and VR drawing.
Immersive tools seemed to be more inspiring during
their usage (see figure 6).
Figure 6: Scores for the perspicuity, novelty and stimulation
of UEQ’s dimension in accordance with the tool.
These results support correlations between the
number of ideas proposed per participant and the
UEQ dimensions we considered (see table 6).
Table 6: Correlations between UEQ dimensions and the
number of ideas per participant.
p Correlation
Perpicuity < 0.01 ∗ ∗ 0.42
Novelty < 0.01 ∗ ∗ 0.40
Stimulation < 0.01 ∗ ∗ 0.40
∗p < 0.05; ∗ ∗ p < 0.01
Comparing Creativity, User-experience and Communicability Linked to Digital Tools during the Fuzzy Phases of Innovation
91
To conclude this analysis, we tested the correla-
tion between Cropley & Cropley dimensions and the
UEQ dimensions. Pearson correlation test revealed
existing correlations between UEQ perspicuity and
Cropley and Cropley global score and each of its di-
mensions. Correlations were found between UEQ
novelty and Cropley & Cropley elegance and genesis
(see table 7).
Table 7: Correlation between UEQ dimensions and Cropley
& Cropley scores.
Perspicuity Novelty
Total 0.26* -
Effectiveness 0.23* -
Novelty 0.28* -
Elegance 0.27* 0.26*
Genesis 0.28* 0.28*
∗p < 0.05; ∗ ∗ p < 0.01
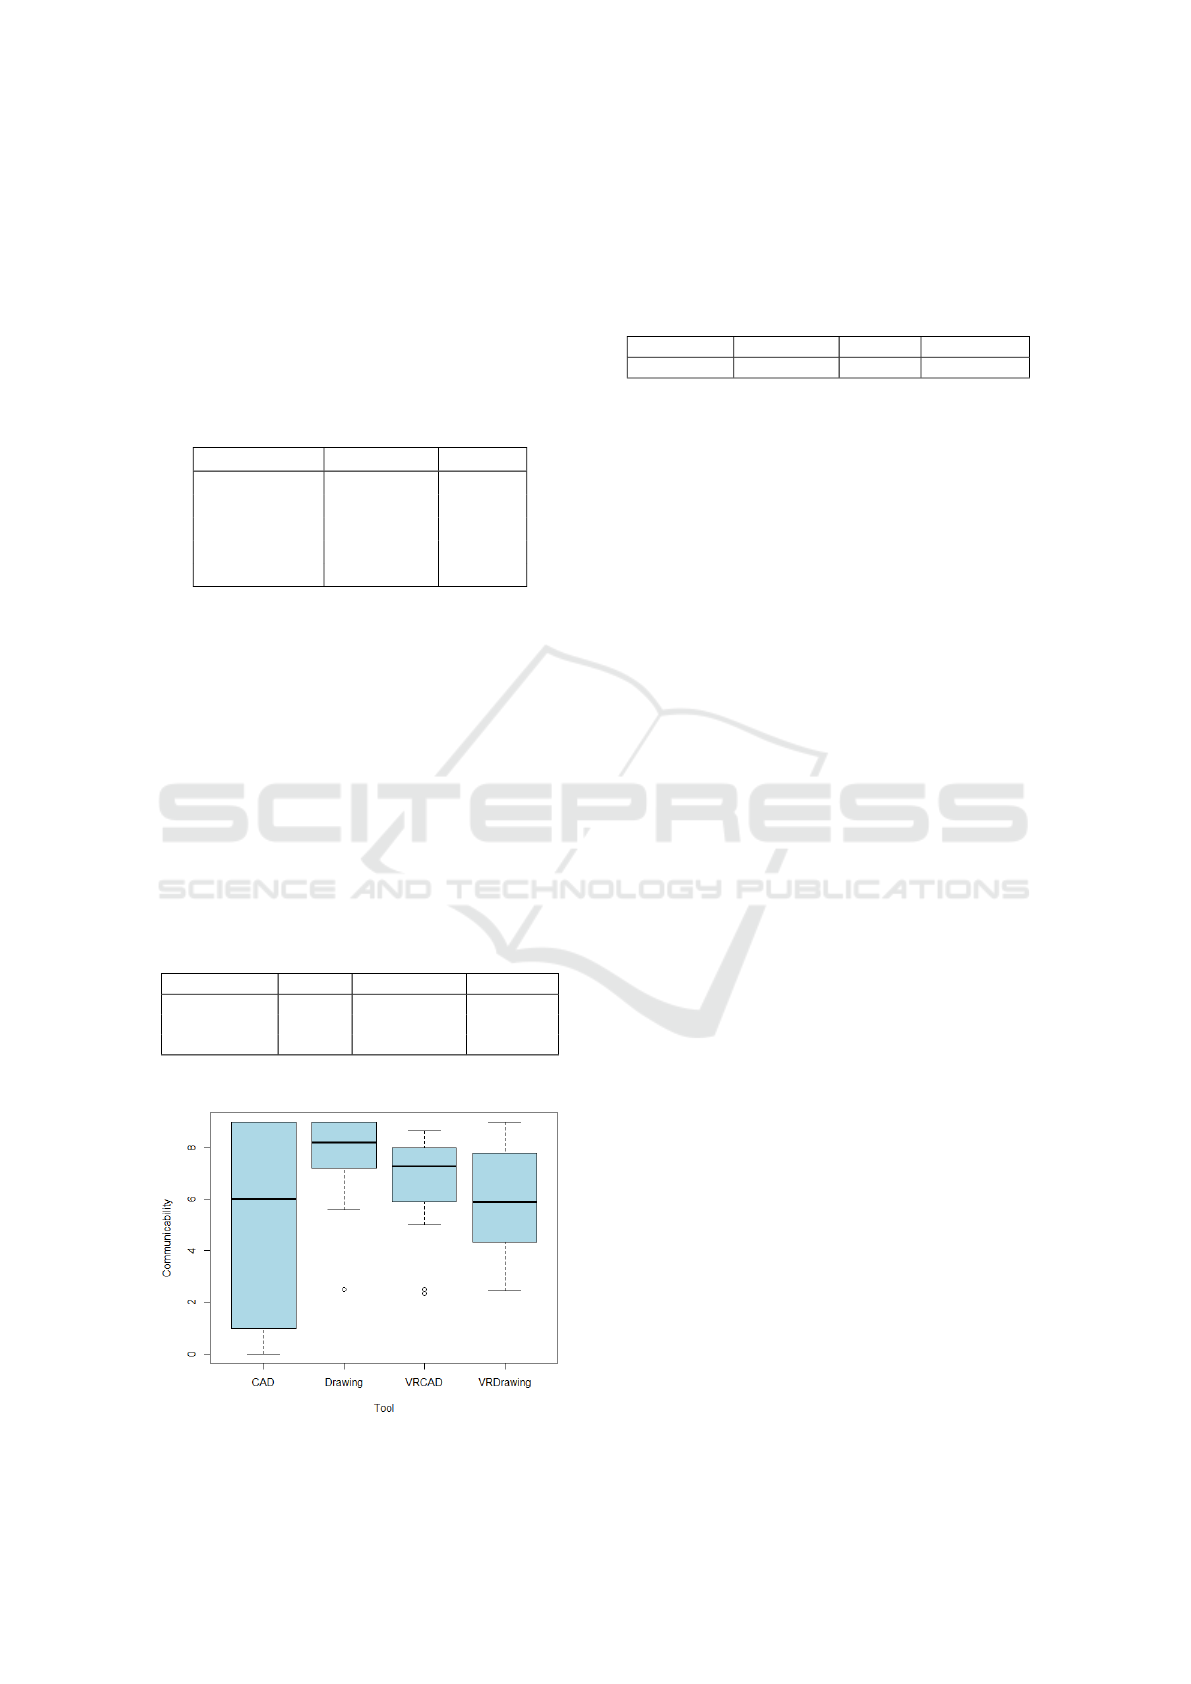
3.3 Communicability
Regarding the communicability of the ideas gener-
ated, a Kruskal-Wallis test (χ
2
= 11.335; p = 0.01)
revealed a statistically significant difference between
the tools. Table 8 shows substantial differences be-
tween pen & paper and CAD and between pen & pa-
per and VR drawing. Figure 7 revealed that a pen &
paper have a higher median than the CAD and VR
drawing and that a pen & paper and VR CAD have a
higher communicability level than the two other tools.
Table 8: Pairwise comparisons of communicability score in
accordance with the tool.
CAD Pen & paper VR CAD
Pen & paper 0.025* - -
VR CAD 0.807 0.187 -
VR Drawing 1 0.016* 0.794
∗p < 0.05; ∗ ∗ p < 0.01
Figure 7: Communicability scores following the tools.
Finally, we analysed if links could exist between
user experience measured by the UEQ and communi-
cability. Correlations were not significant (table 9).
Table 9: Correlation between UEQ perspicuity, novelty and
stimulation, and communicability.
Perspicuity Novelty Stimulation
Correlation -0.057 0.18 0.036
∗p < 0.05; ∗ ∗ p < 0.01
4 DISCUSSION
The present study allowed us to compare possibili-
ties of creativity and communicability of four tools
(pen & paper, VR Drawing, VR CAD, CAD), each
one proposing a particular user experience or use case
during creative activities. The task was to sketch new
propositions of functionalities of an umbrella. We
chose to build a between-subject comparison in or-
der to compare the effect of a tool on creativity and
communicability of ideas.
4.1 Tools Influencing Creativity
Firstly, we measured the number of ideas generated
by the participants according to the tool used. Pen &
paper and VR drawing allowed participants to pro-
duce more ideas. This result can be explained by
their simplicity of use and the intuitiveness of their
different interactions. For both tools, the transition
from idea to drawing remains spontaneous and facili-
tates the production of multiple concepts. Indeed, the
VR drawing application enables the user to create 3D
sketches, thanks to VR controllers that can be used
as brushes, which makes the use simple and intuitive.
However, CAD software did not result in the produc-
tion of a large number of ideas. As an illustration,
participants of the CAD group said that a quarter of an
hour was too short to provide a single idea from a non-
editable model, despite their good knowledge of the
tool. In addition, several participants became stuck
without being able to produce a single idea. These
observations are in line with several studies proving
that CAD tools have a complicated interface that fa-
cilitates neither artistic creation nor creativity (Kos-
madoudi et al., 2013; Feeman et al., 2018; S
´
equin,
2005). It also confirms Dorta’s conclusion (2008) that
CAD software should be used when the concept to be
designed is sufficiently detailed.
These observations are also supported by the user
experience reported for these four tools. A lower level
is observed for the perspicuity, stimulation, and nov-
elty dimensions. The low level of novelty observed
CHIRA 2020 - 4th International Conference on Computer-Human Interaction Research and Applications
92

with the CAD software was related to the usage habits
of the participants. This is consistent with the work of
Limayem and Hirt (2003), who demonstrated that tool
usage habits can favour the development and adop-
tion of strategies and minimise creativity. The low-
est CAD scores for perspicuity and stimulation were
related to a heavy interface and standardised interac-
tions, which do not simplify clarity and do not encour-
age users to be more creative.
We observed correlations between the number of
ideas and UEQ perspicuity, stimulation, and novelty.
Thus, as a better user experience was measured for
the least standardised tools, we assumed that the ease
of use allowed participants to generate more ideas and
go into further detail. We conclude that to encourage
creativity, it is better to have unusual tools and a light
and stimulating interface. These results are in line
with the findings of Gonc¸alves et al. (2015).
In addition to the number of ideas produced, we
evaluated their quality, using the method of Cropley
and Cropley (2008). We observed that a pen & pa-
per allowed the participants to create more qualitative
ideas, contrary to the CAD software, which obtained
only low scores.
The correlation between the overall creativity
score and the UEQ perspicacity suggests that an easy-
to-use tool is conducive to the generation of uncom-
mon and divergent ideas. The interactions provided
by the VR tools remain simple and favoured and high-
quality ideas. We noted that the most creative ideas
were usually set in a context or a more detailed en-
vironment. This observation was linked to a corre-
lation between UEQ perspicuity and the different di-
mensions of the Cropley & Cropley rating method.
Indeed, ease of use encouraged users to detail their
ideas by providing a context of use or an environment
that made them easier to understand. For example,
figure 8 shows an idea drawn with the VR CAD tool;
it represents an umbrella which can be used to fly.
We also observed that the originality of the tool
favoured the elaboration and transposition of ideas to
other issues. The avant-garde and unexpected aspect
stimulated the users’ creativity and immersed them in
their task. Finally, it is interesting to note that a pen
& paper, by its simplicity, allowed users to be more
creative.
4.2 Idea’s Communicability
Beyond the quantity and quality of the ideas pro-
duced, we were interested in their communicability.
Through a brief description by another participant and
a rating of the fidelity of this description by the author
of the idea, we measured the communicability of each
Figure 8: Immersive CAD idea judged with a high creativity
score. It represents an umbrella with a jet engine attached
on it to allow it to fly.
idea in relation to the tool used. The results revealed
that a pen & paper allowed better communicability of
ideas. Also, VR tools had a higher level of commu-
nicability than the CAD tool. No link was found be-
tween UEQ dimensions and communicability. How-
ever, we believe that the context and details added to
the ideas promoted communicability. Further studies
would be required to investigate this hypothesis.
The superiority of a pen & paper can also be ex-
plained by the fact that the participants were working
on an A4 sheet whereas the VR software presented a
real-size model that required larger gestures and more
energy to draw an idea. To favour idea communica-
bility, tools must support users to design surroundings
and to design details. For VR tools, a simple interac-
tion to resize the object can help to minimise the effort
to contextualise the idea drawn.
5 CONCLUSION
This study revealed the existing links between user-
experience, creativity and communicability thanks to
four tools. It revealed that the number of ideas was
linked to perspicuity, novelty and stimulation driven
by the different tools. On the other hand, communi-
cability of an idea is determined by the ability of a
tool to give some background. In view of the results,
we can consider new fields of investigation for further
studies.
We demonstrated, in the context of a drawing task,
that the ease of use and the stimulating nature of a tool
had a positive effect on the user’s creativity. The ease
of use allows more time for thinking, allowing users
to propose more divergent ideas. In this respect, a link
Comparing Creativity, User-experience and Communicability Linked to Digital Tools during the Fuzzy Phases of Innovation
93

can be observed with the cognitive load described by
Sweller (1988) as we assume that tools with a com-
plex interface and interactions will increase the cog-
nitive load required to establish mental patterns for
translating the idea from a thought to a concept. It
seems important to reduce the cognitive load of users
to enable them to generate more ideas or to be able
to inhibit environmental stimuli that can interrupt the
flow of thinking. If the tools we proposed were devoid
of environment or run in a minimalist environment, it
would not be the same as in a work context where
there are elements which are more or less relevant.
One perspective of this work would be to measure the
impact of the environmental stimuli on cognitive load
in relation to the work of Amabile and Pratt (2016).
The second perspective of our work concerns the
communicability of ideas. We relied only on repre-
sentations to measure communicability. In a profes-
sional context, ideas can be communicated by view-
ing, reading, explaining, etc. In order to offer an inter-
face model dedicated to the communication of ideas,
it seems essential to conduct a study on the different
visualisations paradigms of 3D concepts generated in
an immersive environment.
ACKNOWLEDGMENTS
We would like to thank our lab, its teams, and its aca-
demic research chair for allowing us the opportunity
to achieve this work. We also thank the participants
mobilised during this long experiment for their in-
vestment and availability. We also thank the Arts &
M
´
etiers engineering graduate school and the R
´
eaumur
College for giving us the opportunity to achieve this
experiment with the participation of their students.
REFERENCES
Amabile, T. M. (1983). The social psychology of creativity:
A componential conceptualization. Journal of person-
ality and social psychology, 45(2):357.
Amabile, T. M. and Pratt, M. G. (2016). The dynamic com-
ponential model of creativity and innovation in organi-
zations: Making progress, making meaning. Research
in Organizational Behavior, 36:157 – 183.
Calderon-Hernandez, C., Paes, D., Irizarry, J., and Brioso,
X. (2019). Comparing Virtual Reality and 2-
Dimensional Drawings for the Visualization of a Con-
struction Project, pages 17–24.
Cherry, E. and Latulipe, C. (2014). Quantifying the cre-
ativity support of digital tools through the creativity
support index. ACM Trans. Comput.-Hum. Interact.,
21(4):21:1–21:25.
Cropley, D. and Cropley, A. (2008). Elements of a univer-
sal aesthetic of creativity. Psychology of Aesthetics,
Creativity, and the Arts, 2(3):155.
Dorta, T., P
´
erez, E., and Lesage, A. (2008). The ideation
gap:: hybrid tools, design flow and practice. Design
Studies, 29(2):121 – 141.
Dorta, T. V. (2004). Drafted virtual reality a new paradigm
to design with computers.
Dunphy, S. M., Herbig, P. R., and Howes, M. E. (1996).
The innovation funnel. Technological Forecasting and
Social Change, 53(3):279 – 292.
Feeman, S. M., Wright, L. B., and Salmon, J. L. (2018).
Exploration and evaluation of cad modeling in virtual
reality. Computer-Aided Design and Applications,
15(6):892–904.
Fleury, S., Agn
`
es, A., Vanukuru, R., Goumillout, E., Del-
combel, N., and Richir, S. (2020). Studying the effects
of visual movement on creativity. Thinking Skills and
Creativity, 36:100661.
Fucci, M. (2011). The Evolution of Digital Tools for Prod-
uct Design, pages 1–14. Springer London, London.
Gabriel, A., Monticolo, D., Camargo, M., and Bourgault,
M. (2016). Creativity support systems: A systematic
mapping study. Thinking Skills and Creativity, 21:109
– 122.
Gonc¸alves, F., Campos, P., and Garg, A. (2015). Under-
standing ui design for creative writing: A pilot evalu-
ation. In Adjunct Proceedings of the INTERACT 2015
Conference, pages 179–186.
Kosmadoudi, Z., Lim, T., Ritchie, J., Louchart, S., Liu, Y.,
and Sung, R. (2013). Engineering design using game-
enhanced cad: The potential to augment the user expe-
rience with game elements. Computer-Aided Design,
45(3):777 – 795.
Laugwitz, B., Held, T., and Schrepp, M. (2008). Construc-
tion and evaluation of a user experience questionnaire.
In Holzinger, A., editor, HCI and Usability for Ed-
ucation and Work, pages 63–76, Berlin, Heidelberg.
Springer Berlin Heidelberg.
Le Masson, P., Weil, B., and Hatchuel, A. (2006). Les pro-
cessus d’innovation: Conception innovante et crois-
sance des entreprises. Lavoisier Paris.
Lecossier, A. and Pallot, M. (2017). Ux-ffe model: An ex-
perimentation of a new innovation process dedicated
to a mature industrial company.
Limayem, M. and Hirt, S. G. (2003). Force of habit and
information systems usage: Theory and initial valida-
tion. Journal of the Association for Information Sys-
tems, 4(1):3.
Midler, C. (1995). “projectification” of the firm: The re-
nault case. Scandinavian Journal of Management,
11(4):363 – 375. Project Management and Temporary
Organozations.
Rieuf, V. (2013). Impact of the immersive experience on
kansei during the early industrial design. Theses,
Ecole nationale sup
´
erieure d’arts et m
´
etiers - ENSAM.
S
´
equin, C. H. (2005). Cad tools for aesthetic engineering.
Computer-Aided Design, 37(7):737 – 750.
CHIRA 2020 - 4th International Conference on Computer-Human Interaction Research and Applications
94

Sweller, J. (1988). Cognitive load during problem solving:
Effects on learning. Cognitive Science, 12(2):257–
285.
Yang, X., Lin, L., Cheng, P.-Y., Yang, X., Ren, Y., and
Huang, Y.-M. (2018). Examining creativity through
a virtual reality support system. Educational Technol-
ogy Research and Development, 66(5):1231–1254.
Comparing Creativity, User-experience and Communicability Linked to Digital Tools during the Fuzzy Phases of Innovation
95
