
Towards Self-adaptive Defect Classification in Industrial Monitoring
Andreas Margraf
1 a
, J
¨
org H
¨
ahner
2
, Philipp Braml
2
and Steffen Geinitz
1
1
Fraunhofer IGCV, Am Technologiezentrum 2, 86159 Augsburg, Germany
2
Institute for Computer Science, Augsburg University, Eichleitnerstr. 30, 86159 Augsburg, Germany
philipp.georg.braml@student.uni-augsburg.de
Keywords:
Unsupervised Learning, Image Processing, Stream Clustering, SVM, Carbon Fibres.
Abstract:
The configuration of monitoring applications is usually performed using annotations created by experts. Un-
like many industrial products, carbon fiber textiles exhibit low rigity. Hence, surface anomalies vary to a great
extend which poses challenges to quality monitoring and decision makers. This paper therefore proposes an
unsupervised learning approach for carbon fiber production. The data consists of images continously acquired
using a line scan camera. An image processing pipeline, generated by an evolutionary algorithm is applied to
segement regions of interest. We then cluster the incoming defect data with stream clustering algorithms in
order to identify structures, tendencies and anomalies. We compare well-known heuristics, based on k-means,
hierarchical- and density based clustering and configure them to work best under the given circumstances.
The clustering results are then compared to expert labels. A best-practice approach is presented to analyse
the defects and their origin in the given image data. The experiments show promising results for classifica-
tion of highly specialised production processes with low defect rates which do not allow reliable, repeatable
manual identification of classes. We show that unsupervised learning enables quality managers to gain better
insights into measurement data in the context of image classification without prior knowledge. In addition,
our approach helps to reduce training effort of image based monitoring systems.
1 INTRODUCTION
Enterprise databases that store large numbers of im-
ages require efficient algorithms to provide enough
insights for searching, classification and interpreta-
tion. In the field of production engineering, sensor
data is often stored for quality assurance, yet some-
times without defining their purpose in advance. This
leaves many open question to data scientists and qual-
ity managers who see themselves confronted with a
large source of information but equipped with lim-
ited tools for analysis. Given enough samples are pro-
vided, artificial neural networks (ANN) in general and
deep learning in particular outperform most related
classification algorithms to date. However, the rising
need for annotated samples shifts the effort from algo-
rithm design towards data collection and preparation.
Unsupervised learning instead aims for assigning data
points to classes without prior knowledge or user in-
put. We therefore combine AI with decision sup-
port by implementing an evolutionary programming
approach (CGP) to segment the image data acquired
a
https://orcid.org/0000-0002-2144-0262
by a camera sensor. In a second stage we then apply
clustering algorithms on the regions of interest (ROI)
in order to distinguish the defects by unique fea-
tures. Since we act without prior-knowledge, the ap-
proach can only approximate the classification. How-
ever, it is beneficial for decision makers in the con-
text of process and quality monitoring since it can be
applied without prior knowledge or time-consuming
data preparation.
1.1 Motivation
Many real-world applications, especially those in-
volving online process monitoring (OPM) with op-
tical sensors, call for classification of pre-processed
data. Given a camera system with an on-board
segmentation algorithm returns areas that potentially
contain anomalies but no expert knowledge is avail-
able, how can the data still be analyzed efficiently?
In order to answer this question we propose a clus-
tering based approach for unsupervised learning on
a representative industrial image dataset. The images
contain a top view of a carbon fibre surface (see figure
3). The data was acquired using a high resolution line
318
Margraf, A., Hähner, J., Braml, P. and Geinitz, S.
Towards Self-adaptive Defect Classification in Industrial Monitoring.
DOI: 10.5220/0009893003180327
In Proceedings of the 9th International Conference on Data Science, Technology and Applications (DATA 2020), pages 318-327
ISBN: 978-989-758-440-4
Copyright
c
2020 by SCITEPRESS – Science and Technology Publications, Lda. All rights reserved

scan camera mounted in the production environment
above the material. Further details on the experimen-
tal setting are given in section 5.
1.2 Relation to Organic Computing
The increasing complexity of multi-sensor systems
allows for new strategies to process data and derive
recommendations for actions. In this paper, we pro-
pose an unsupervised learning approach based on Or-
ganic Computing (OC) (M
¨
uller-Schloer and Tom-
forde, 2017) principles. OC is a recent paradigm
for engineering systems that exhibits so-called self-
x properties e. g., self-adapting, self-configuring or
self-learning. In the present study, we will discuss
strategies for 1) unsupervised model-learning and 2)
self-optimization in an online process monitoring con-
text. Furhermore, the proposed approach is inspired
by the Automated Design of Processing Pipelines
(ADPP) (Stein et al., 2018), a top-level concept which
illustrates the combination and implementation of dif-
ferent learning algorithms.
1.3 Structure
The remainder of this paper is structured as follows:
section 2 gives an overview of the state of the art in
unsupervised learning and clustering algorithms. It
is followed by the problem statement and description
in section 3. We then discuss our approach of unsu-
pervised model learning with stream clustering and
model training for the classification of carbon fibre
defects in section 4. Furthermore, we examine the ap-
plication scenario in an industrial context in section 5
and discuss the results in section 6 before closing by
summing up the scientific findings and giving a per-
spective on future research topics in section 7.
2 RELATED WORK
The following section will give an overview of pub-
lications and scientific work in related fields of re-
search.
In the field of carbon fiber monitoring, Geinitz et
al. and Margraf et al. implemented a testing device
for surface inspection and proposed a machine vision
algorithm in respective publications (Geinitz et al.,
2016), (Margraf et al., 2017a). Besides, Margraf et
al. presented a cartesian genetic programming (CGP)
approach for the design of image filters in monitor-
ing systems (Margraf et al., 2017b). Both works fo-
cus on image processing for the segmentation of de-
fects in carbon fibres whose results provide the data
used in this paper. Also, correlations between the
electric charging properties and the structure of non-
woven fabrics has been exaimed by (Teodorescu et al.,
2013). Unsupervised learning is preferred when per-
forming exploratory tasks with data. As such, Trivedi
et al. discussed the utility of clustering in prediction
tasks (Trivedi et al., ). Furthermore, Xu et al. (Xu
and Wunsch, 2005), Anil K. Jain (Jain, 2010) and
Grira et al. (Grira et al., 2004) examined the ben-
efits of data clustering in several application scenar-
ios. Based on this work, clustering algorithms like
DBSCAN or k-means++ have been introduced (Es-
ter et al., 1996; Arthur and Vassilvitskii, 2007; Schu-
bert et al., 2017). Based on data provided by (Margraf
et al., 2017b) and (Geinitz et al., 2016) this study ex-
plores the possibility to use clustering as suggested
by (Xu and Wunsch, 2005; Jain, 2010; Grira et al.,
2004) to generate interpretable classification models
for carbon fibre defects. Combining clustering with
other machine learning concepts has been examined
- among others - by Chester et al. and Quoc V. Le
(Chester and Ratsaby, 2013; Le, 2013; Ji et al., 2019).
Studies using SVM for classification rely on cluster-
ing algorithms to create the training set, such as (Fin-
ley and Joachims, 2005) or Clustered SVM (Gu and
Han, 2013). Likewise, Yu et al. used hierarchical
clustering (Yu et al., 2003) while Gan et al. applied
k-means (Gan et al., 2017) to train an SVM in the
context of unsupervised classificaiton. Furthermore,
the potential fo ensemble learners on SVM models in
the context of imbalanced data was examined by (Lee
and Lee, 2014). In contrast, stream data is generated
locally from e. g. different sensors and need to be pro-
cessed in short time frames since their value of infor-
mation declines with time. Unsupervised learning al-
gorithms allow for short-term exploration of patterns,
insights and tendencies in data streams. Well-known
heuristics comprise ‘BIRCH’, ‘StreamKM++’, ‘DB-
Stream’ and ‘evoStream’ (Zhang et al., 1996; Ack-
ermann et al., 2010; Hahsler and Bola
˜
nos, 2016;
Carnein and Trautmann, 2018). An overview on the
current state-of-the-art can be found in Carnein et al.
who recently published an extensive survey on stream
clustering (Carnein and Trautmann, 2019). Further-
more, several publications discuss training support
vector machines (SVM) incrementally on successive
subsets (Joachims, 1999; Chen et al., 2003; Laskov
et al., 2006). Furthermore, joining clustering with
ANNs has not been discussed in this study. However,
the authors are well aware of the potential.
Towards Self-adaptive Defect Classification in Industrial Monitoring
319

Table 1: CGP configuration for pipeline evolution.
Parameter Value
µ + λ 1 + 4
Mutation rate 0.38
Termination 200 generations
3 PROBLEM STATEMENT
In general, image processing comprises different
phases which vary from one application to another.
We define the following steps as common among vi-
sion systems: 1) image acquisition, 2) image pre-
processing, 3) filtering and segmentation, 4) classi-
fication and 5) interpretation. In this paper, we fo-
cus exlusively on phases 4 and 5, but still give an
overview on the context of the proposed approach.
In our application scenario, images are acquired
by a line scan camera mounted in a carbon fibre pro-
duction environment (for details see (Geinitz et al.,
2016)). The processing pipeline is generated by
an genetic algorithm denoted cartesian genetic pro-
gramming (CGP). This algorithm evolves image filter
pipelines for the segmentation of regions of interest
(ROI). The configuration is presented in table 1 and
is based on previous work by Margraf et al. (Margraf
et al., 2017b).
In contrast to conventional Genetic Programming
(GP), programs are evolved from nodes on a ge-
netic grid and represented by a directed acyclic graph
(DAG). The DAG constitutes both the genotype and
the phenotype. In CGP, the genetic operators are ap-
plied to a specific genotype representation – an integer
list encoding the DAG. The grid itself now represents
the phenotype. In our example, the genotype consists
of a collection of image filters.
The phenotype is represented by the image filter
pipeline. Therefore, the evolved pipeline consists a
sequence of fine-tuned thresholds, filters, morpholog-
ical and mathematical operators. All filter operators
are taken from the commercial library MVTec HAL-
CON (MVTec, 2018). This pipeline is applied on car-
bon fibre textile images acquired using the aforemen-
tioned line scan camera. As for this study, the result-
ing binary images serve as input data for the classi-
fication model. Figure 1 illustrates the overall work-
flow of our monitoring system.
However, ROIs allow for counting but not classi-
fying defects. The number of anomalies may serve
as a quality indicator. Still, shape and structure usu-
ally carry more information for error search and help
reveal problems with machine configurations. Train-
ing a supervised classifier would take a large amount
of annotated data. In addition, the classification of fi-
bre defects often leaves much room for interpretation.
Therefore, we propose a more independent, ‘neutral’
approach for defect classification with as little human
interference as possible.
3.1 Data Preparation
Unsupervised learning demands data preparation
which can be achieved best by following a proven and
tested workflow. Halkidi et al. suggest the following
order of actions (Halkidi et al., 2001): given a well-
defined dataset, we start by selecting features for the
different clustering heuristics. We follow by validat-
ing the clustering model and close by evaluating the
results.
Thereby feature selection is performed using cor-
relation coefficients (cf. figure 7) in order to iden-
tify parameters that best describe the characteristics
of each data point. As for carbon fibre defects, we
use the ROI to construct all features. The classifica-
tion model is defined as an algorithm that groups data
into partitions. All regarded clustering algorithms use
a proximity measure. However, their input parame-
ters vary from one to another. Validating the plaus-
ability and correctness of a cluster algorithm will be
performed using quality metrics as described in sec-
tion 3.2. These four phases are necessary to generate
plausible class assignments for carbon fibre defects.
3.2 Theoretical Foundations
Clustering can be generally divided into two major
areas:
1. Stationary data clustering (‘offline’)
2. Non-stationary data clustering (‘online’)
Algorithms for stationary data clustering are the more
wide-spread and well-known kind. In times of unla-
belled data streams with large databases in the back-
ground, clustering becomes more important in order
to understand and interpret big data and deduce de-
cisions. Application domains such as social media,
marketing or sales are among the most important ar-
eas in which stream clustering plays a key role. Of
course, there are further areas like the finance and IT
sector in which anomaly or fraud detection, IT secu-
rity, data security and intrusion detection are common
tasks. Furthermore, industries such as e-commerce,
banking or (tele)marketing make heavy use of clus-
tering techniques for transaction data. According
to (Carnein and Trautmann, 2019) stream clustering
algorithms can be gouped into the following cate-
gories: distance-based, grid-based, model-based and
projected
DATA 2020 - 9th International Conference on Data Science, Technology and Applications
320
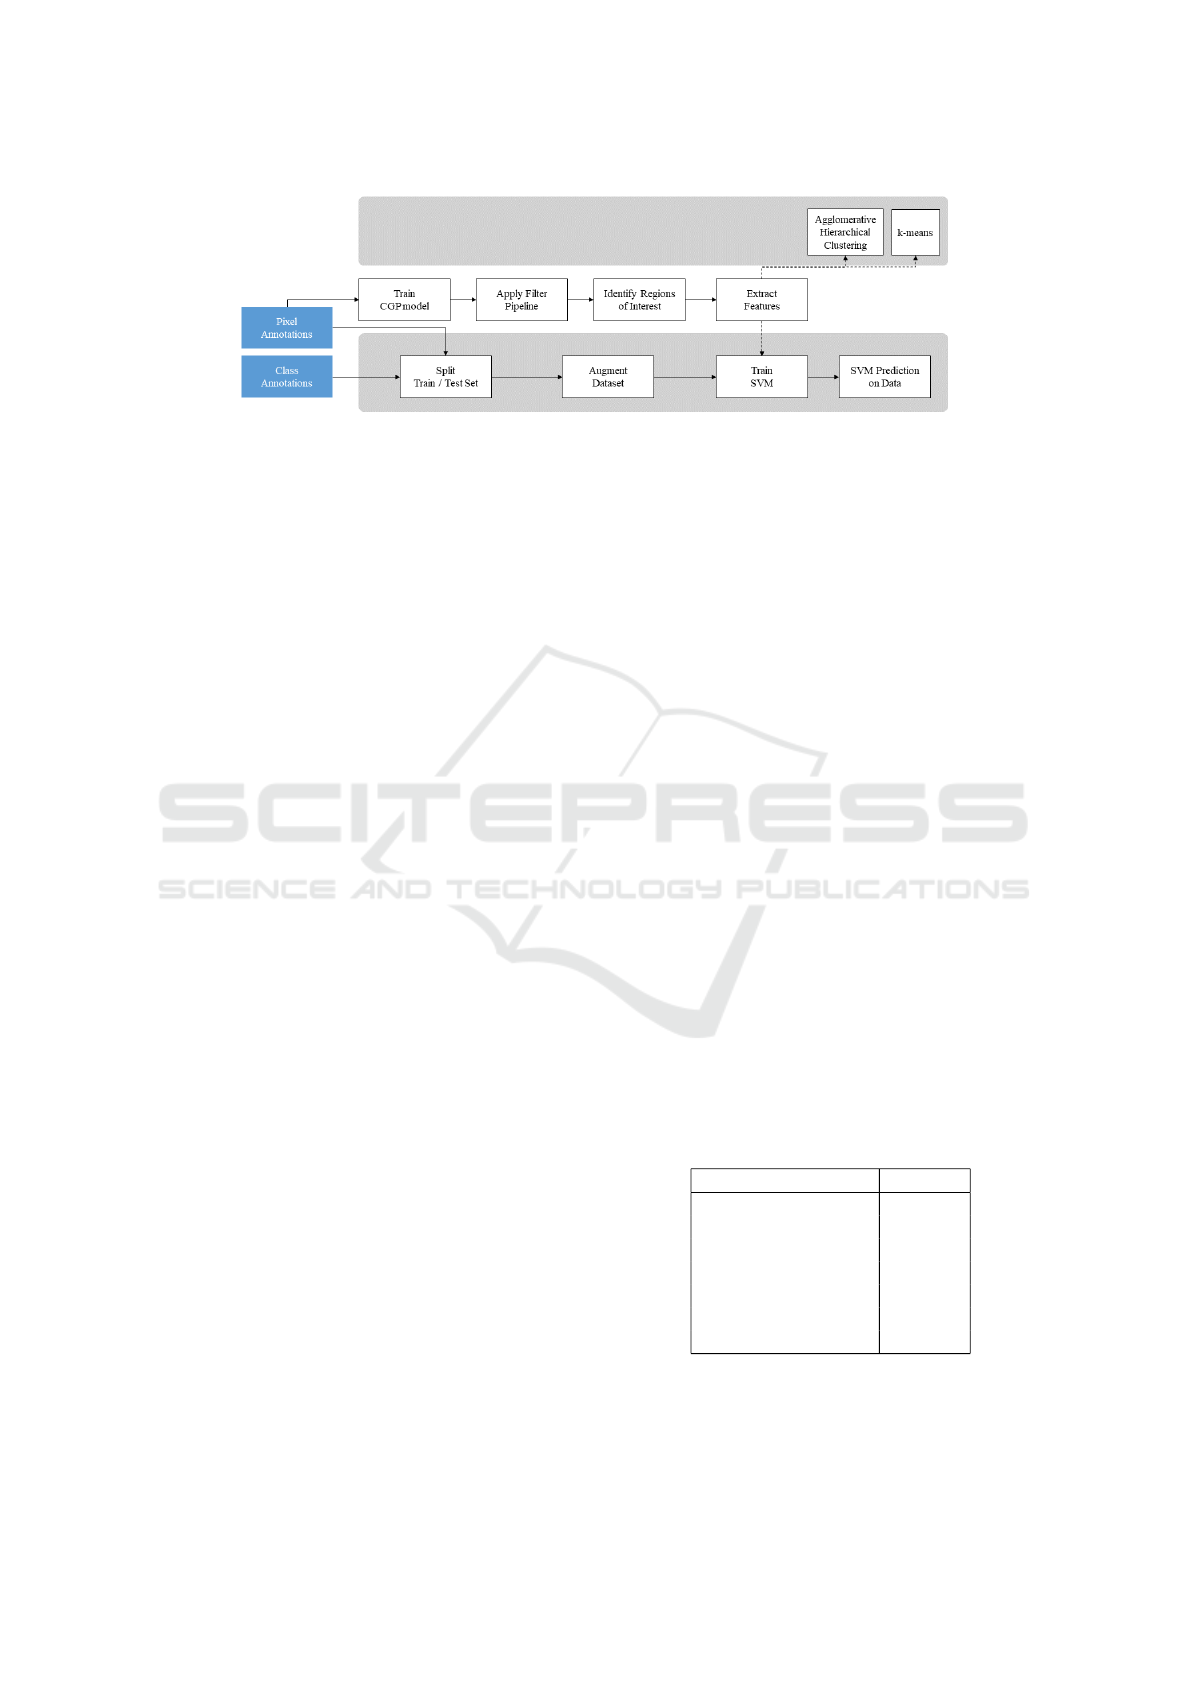
Figure 1: Flowchart of image processing tasks as usually performed for supervised learning.
One of the main aspects of these kind of algo-
rithms is their ability to incorporate concept drift.
Conventional clustering algorithms run periodically,
which means they are subsequently applied on data
batches which produces ever-changing clustering
‘rules’. Also, periodical repetition means they are
complex and computationally expensive. Stream
clustering, though, are optimized for fast computation
in a continuous flow of data. K-means is a distance-
based algorithm and stands out by its low complexity.
It only takes one parameter k as input. On startup,
k random cluster centres are chosen by selecting k
random data points as cluster centres. Based on the
minimal distance of each data point to a cluster cen-
ter, data points are added to a cluster c
i
. The eu-
clidean distance is used to compute the proximity. In
each iteration, k-means tries to optimize the within-
cluster sum-of-squares criterion (Huang, 1998). In
this study, we dedicate the most attention to k-means
as one of the core methods to process data fast. Hi-
erarchical clustering comprises a family of cluster-
ing algorithms that build clusters by merging or split-
ting partitions. This nested structure of clusters is
often represented in a so called dendrogram, a tree
like structure which plots the degree of merging of
clusters (Gan et al., 2007). Grid-based clustering is
an alternative to density-based approaches. However,
they tend to be more computationally expensive than
density-based clustering. For this reason they are not
further considered in this paper. The field of model-
based clustering is deemed less relevant to this study
and therefore will not be considered in detail.
3.3 The Benefits of Stream Clustering in
Production Monitoring
Stream clustering is used to process data pack-
ages. Production environments often provide a steady
stream of data just as it is the case for carbon fibre
monitoring. During the production process, the cam-
era system continuously acquires and transfers image
data to the vision computer. In a first instance, image
filters are applied so that only ROIs remain for feature
extraction. The complexity of fibre defects calls for
unsupervised data processing. In addition, the data
changes over time in unpredictable ways. Contrast,
shape and size of defects vary depending on the pre-
cursor (the incoming raw material), configuration or
possible malfunctions. This leads to expected anoma-
lies and unkown, therefore unexpected anomalies. It
should be possible to identify tendencies and actual
changes from data streams over time. However, the
outcome cannot be trained in a model, so data stream
clustering remains the most practical solution.
The authors are aware of the variety of available
stream clustering algorithms which potentially fit the
task described in this paper. For reasons of efficieny
we examine one of the most promising clustering al-
gorithms and apply it to the problem at hand. In addi-
tion, we propose a novel approach to create an inter-
pretable SVM model which is adapted over time.
4 APPROACH
As a start, the images are segmented using a series of
filters and morphological operations to derive regions
of interests (ROI). The classes are then used to clas-
sify the segmented regions with a variety of methods.
Table 2: Features computed from each ROI with corre-
sponding intervalls.
Feature Intervall
Aspect Ratio [0, ∞[
Extent [0, ∞[
Solidity [0, ∞[
Equivalent Diameter [0, ∞[
Orientation Angle [0, 360]
Perimeter [0, ∞[
Circularity [0,1.0]
After image filtering, we select the defect fea-
tures based on the extracted ROIs. The feature values
are used for later assignment to one of the categories
Towards Self-adaptive Defect Classification in Industrial Monitoring
321
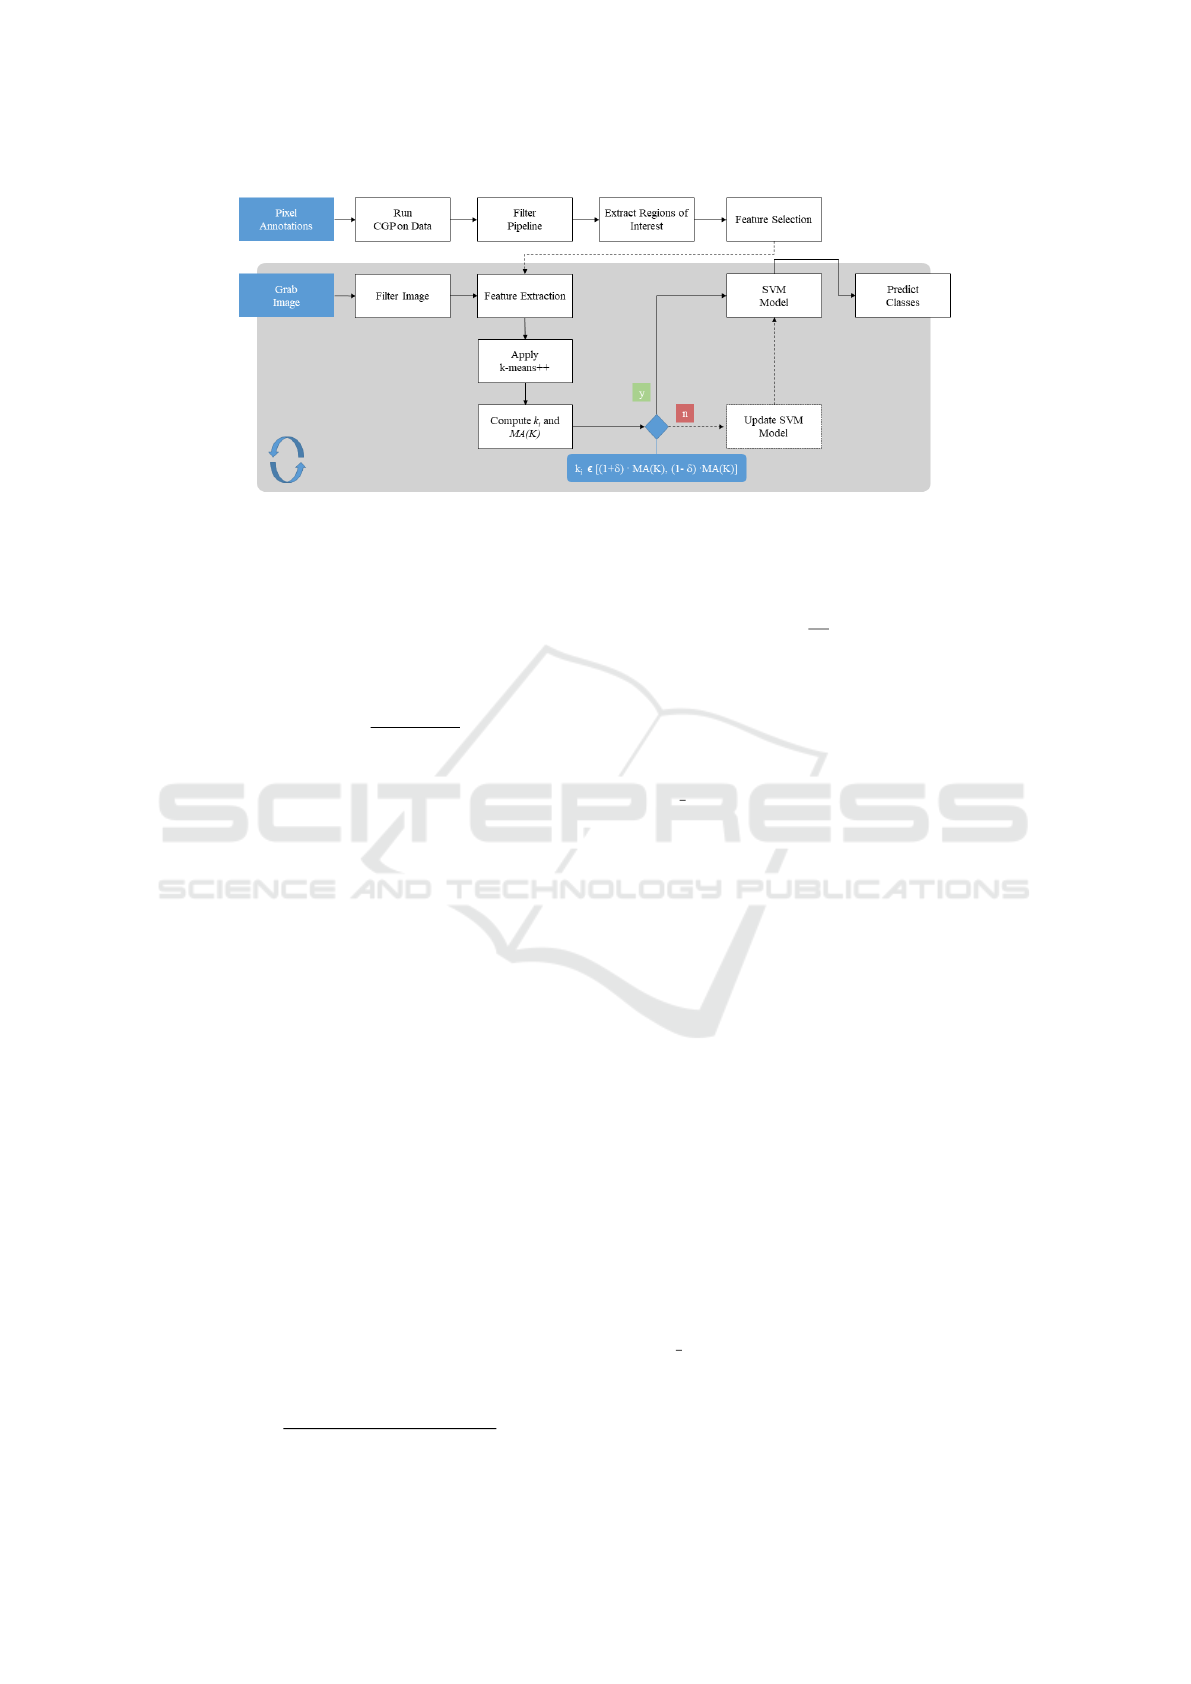
Figure 2: Flowchart of online clustering with updated SVM performed on the dataset.
which comprise fuzzball, filament crack, misaligned
filament, loop, contaminant, artefact and other. All
features are listed in table 2 with corresponding inter-
vals. Except for circularity, all features are based on
contour properties computed with functions from the
OpenCV framework. The circularity is computed as
follows:
circularity =
4 · π · area
perimeter
2
(1)
In earlier experiments, we found that defects
are difficult to distinguish reliably and consistently.
Among experts we noticed contradictions and incon-
sistencies when asked to classify fibre defects man-
ually. The study was conducted based on Gauge
Repeatability and Reproducability (Gauge R&R), a
method adopted from the six sigma standard (Baner-
jee et al., 1999). The results are discussed in section
6. The need to classify data without a priori knowl-
edge finally encouraged the implementation of unsu-
pervised learning techniques.
4.1 Definition of KM-SVM
The algorithm is defined as follows: a score is com-
puted and compared against a predefined threshold to
determine the number of clusters created by a cluster-
ing algorithm. The number of clusters is recomputed
in constant intervalls. This value then serves as an in-
dicator for critical changes in the data structure, e. g.
occurrence of new anomalies.
For the determination of the number of clusters the
algorithm relies on the silhouette score s(o), a score
that varies between -1 and 1. It describes the the dif-
ference of distances of object o to cluster center A
(nearest cluster) and B (intra cluster distance) over the
maximum of the distance dist(A, o) and dist(B, o) and
is therefore defined as follows:
S(o) =
dist(A, o) − dist(B, o)
max{dist(A, o), dist(B, o)}
(2)
Furthermore, the silhouette coefficient s
C
represents
the arithmetic mean of all n
c
silhouettes of cluster C:
s
C
=
1
n
C
∑
o∈C
S(o) (3)
All subsequent data batches are then processed
using the new SVM model. The algorithm as pre-
sented in listing 1 is continuously run on the batch
to determine the best number of clusters under the
current condition. If the proposed number of clus-
ter best n deviates from the moving average MA(K)
with ±δ · MA(K) over N iterations, the SVM model
is recreated. By using the moving average as a ref-
erence, the effect of outliers on model training is
flattened. Only high impact changes in the series
of values for k over several consecutive iterations
will trigger an SVM model update. Experiments on
the dataset revealed, that the most stable curve was
achieved for N = 20. The deviation parameter δ is
set to 0.1. The SVM implementation used for the ap-
proach is based on the library libSVM and the python
library sklearn. The SVM is set to use rbf for the
kernel, a regularization parameter C = 1.0 and ‘scale’
for gamma. Furthermore, k-means++ is applied to
cluster the data from features on the first batch. The
incoming data stream is processed in batches of the
same size. For the experiments the batch size is set to
200 data points to be processed in each iteration. The
batch processing function is defined as algorithm 1.
The silhouette coefficient s(k) usually declines
with increasing k. However, a global maximum is
likely to be found for higher values of k. Therefore,
k is incremented as long as s(k) increases. Also, in
order to avoid an infinite loop, a termination criterion
of max k = 20 is defined. In addition, if s(k) drops
below a value of 0.7 or below 90% of the maximum
silhouette value to this iteration, the search is termi-
nated because no more improvements are expected.
The heuristic is implemented as described in the al-
DATA 2020 - 9th International Conference on Data Science, Technology and Applications
322
Algorithm 1: Process batch with KM and SVM.
Input: Batch, Model, δ
set K = {}, P = {} set M = {};
Determine the best number of clusters best k
for Batch;
Add k
best
to K;
if |M| > 1 then
Compute the Moving Average
MA(K, N, k) of K over N iterations and
insert it in M;
end
if n
i
! = k
i
∧ n
i
! = N
i−1
∧ MA(K, N, k)! =
MA(K, N, k
i−1
) then
Compute cl f
km++
with ‘k-means++’ of
Batch with best k;
Compute predictions Pred
km++
of Batch
with cl f
km++
;
end
if Model Is not Empty ∧
best k ∈ [(1 − δ) · MA(K), (1 + δ) · MA(K)]
then
Create predictions Pred
SV M
with
Model(Batch);
insert Pred
SV M
in P;
else
Train Model
SV M
with SVM(Batch,
Pred
c
);
end
return P, Model
gorithm listing 2.
For the time-critical environment we prefer
density-based algorithms over grid-based and model-
based approaches. They are computationally inexpen-
sive and suit the given clustering task well. This is the
main reason for choosing k-means++ for algorithm
2. Furthermore, implementations for the selected al-
gorithms are applicable with little effort. We therefore
denote this approach KM-SVM.
In summary, we deem the approach proposed in
this paper superior to traditional clustering in terms
of flexibility, reproducability and interpretability. The
experiments are designed to test this hypothesis. In
section 5, the experimental setup is explained in detail
while in section 6 the results are critically reflected.
5 EXPERIMENTS
The evolved image processing pipeline consists of
the following operators: sobel edge detector, gradi-
ent threshold, erosion using circle geometry and con-
nected component filtering. The camera was set to
Algorithm 2: Find best number of clusters.
Input: F, max iter = 20, min s = 0.7,
min delta = 0.9
set s(k) = 0, n = 2, best n = 2;
set Deltas = {}, Silhouettes = {};
while nb iter < max iter do
set Labels = ‘k-means++’ from F with
k = n;
Compute s(Labels) with
metric =
0
euclidian
0
;
Insert s(Labels) in Silhouettes;
if |Silhouettes| ≥ 3 then
∆s(i) = s(i) − s(i − 1) ;
insert ∆s(i) in Deltas;
for i ← 0 to |Deltas| do
if s(i) − max{s} > s(i − 1) then
set best n = n;
end
if s(i) − max{Deltas} <
min delta · max{Deltas} ∨
s(i) < min s then
return;
end
end
else
insert 0 in Silhouettes;
end
increment n;
end
return k, s(k)
scan the surface of carbon fibres. In result, the im-
ages showed a hetergenous structure of carbon fibres
aligned from top to bottom due to the tension from
the spooling system. Every time a single fibre cracks,
its tension rapidly declines which enables it to bounce
back and rest on the surface of the fibre carpet. Fur-
thermore, degenerated material from other rovings or
even alien material may form fuzzballs, a bulky col-
lection of textiles which also rest on the surface. An
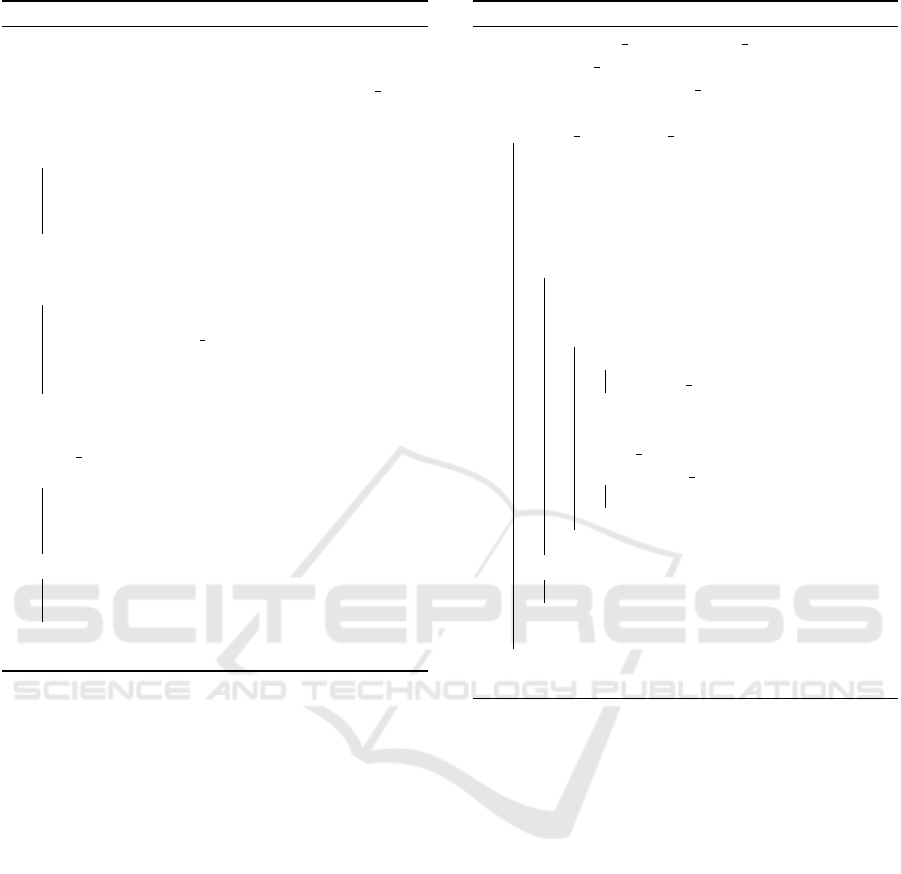
example of fibre defects as they occurr in the images
can be seen in figure 3.
5.1 Interrater Agreement Study
We conducted an interrater agreement study to test
the reliability of the measurement equipment for de-
fect classification. Five experts from our institution
who were not directly involved in the project kindly
agreed to manually classify defects from the test set.
The experiment was conducted as follows: 5
classes were defined prior to the study. Then 19 im-
ages acquired from the camera in which the defects
were already segmented by an image filter pipeline
Towards Self-adaptive Defect Classification in Industrial Monitoring
323
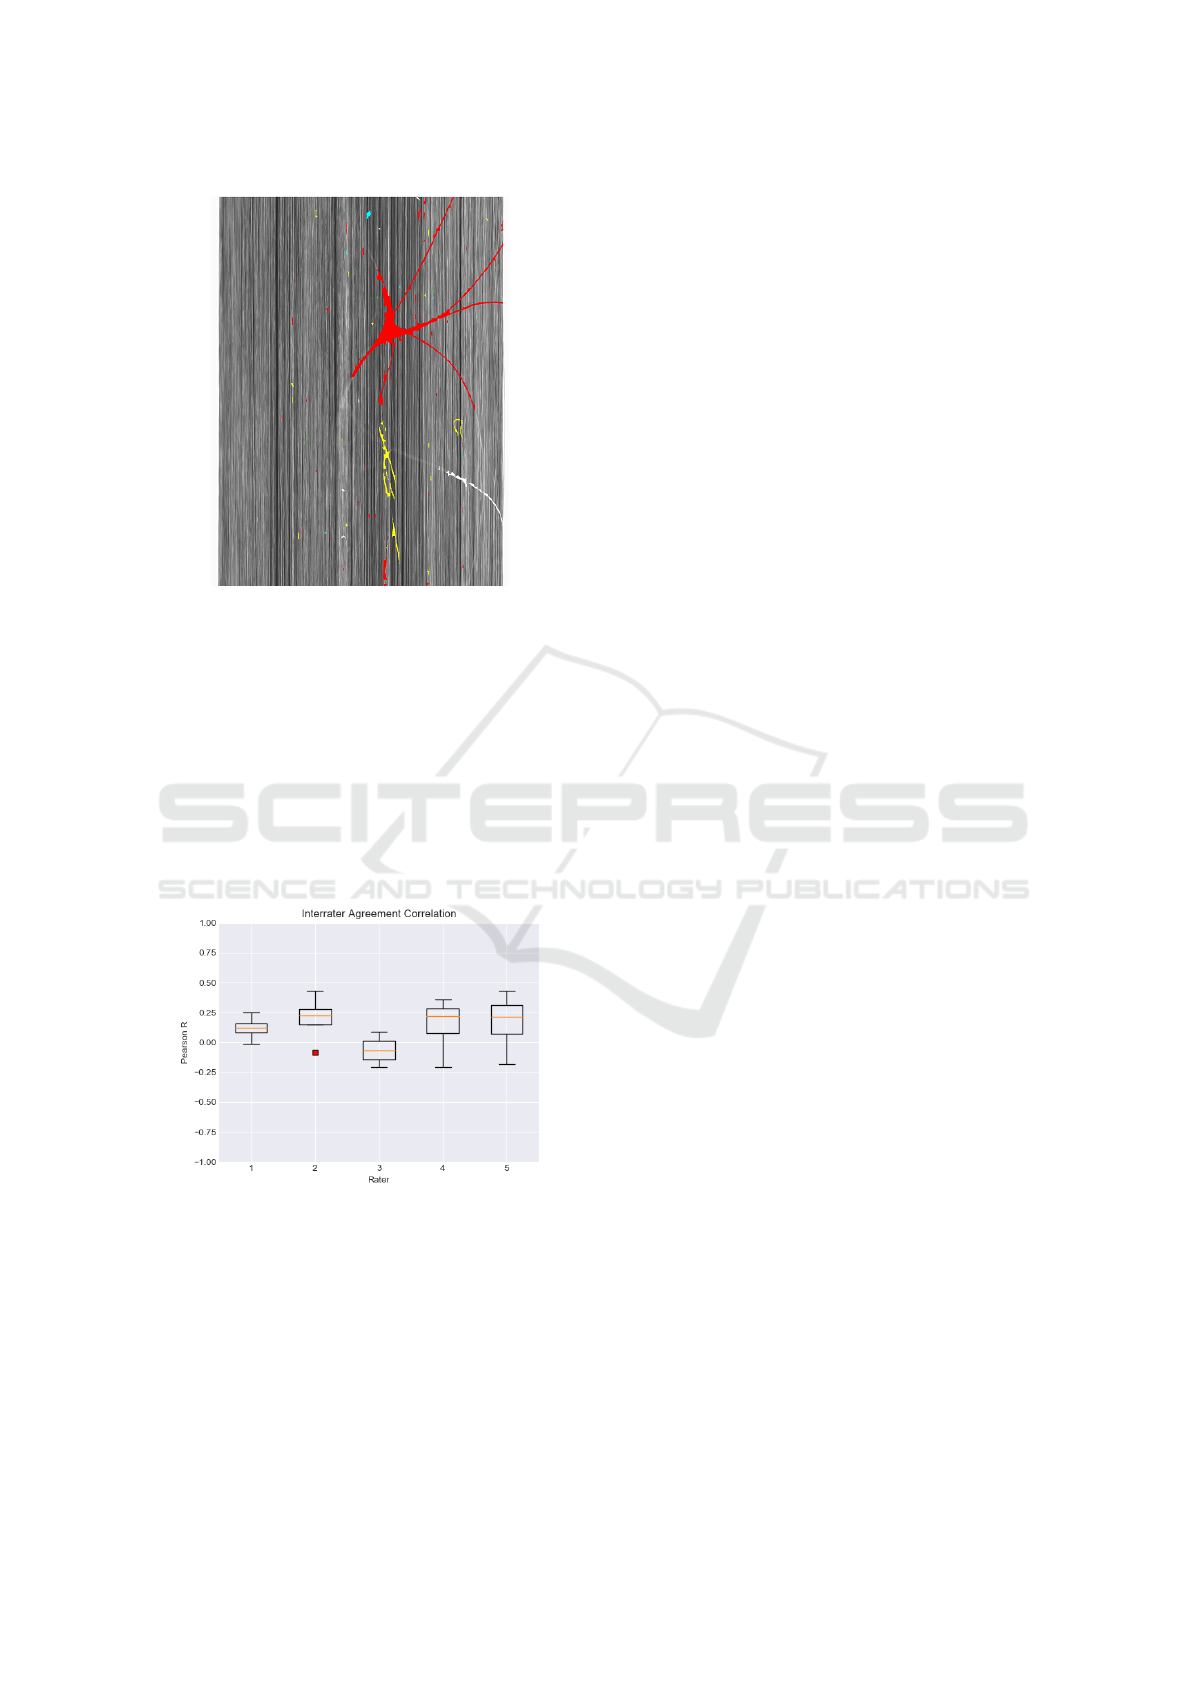
Figure 3: View of a carbon fiber roving sample with seg-
mented and clustered defects. The colored areas represent
regions of interest which are feed to the algorithm as binary
images.
were presented to 5 appraisers. Each appraiser was
asked to assign each defect to a given class without
exchanging information with the other appraisers nor
asking questions to the study supervisors. Each ap-
praiser had to repeat the manual classification three
times, each time without being allowed to view previ-
ous ratings. The level of agreement within the ap-
praisers, denoted interrater agreement, can be de-
duced from the statistical results given in figure 4.
Figure 4: Interrater agreement analysis showing the statisti-
cal spread of the pearson correlation value ρ for 5 indepen-
dent raters over 3 rounds.
In general, the pearson correlation coefficient
ranges between +1 and −1 where 1 represents lin-
ear correlation and high agreement, 0 is no linear cor-
relation and −1 indicates negative linear correlation,
therefore maximum disagreement. As can be seen in
figure 4, the correlation coefficient ρ never exceeds
0.4, but drops below 0 for 3 appraisers. Although the
mean ranges between 0 and 0.025, for one appraiser it
is slightly below 0. Two out of five, appraisers 4 and
5, show substantial statistical spread which suggests
contradictions in their own evaluation.
The Fleiss’ kappa calculation on interrater data
returned the following κ values for rounds 1 to 3:
κ
1
= −0.063, κ
2
= −0.061, κ
3
= −0.062. Over all
rounds, a total Kappa value of κ
total
= −0.060 was
returned.
In summary, all values of ρ are close to ρ = 0 and
all values of kappa are κ < 0 which shows little to no
correlation between appraisers and therefore poor in-
terrater agreement. This data raises the question how
even trained raters can be as inconsistent when assess-
ing carbon fibre defects. As mentioned before, shape,
structure and occurrence of fibre anomalies vary to
a large extent. Due to little redundancy, no defect
catalogue or golden sample could be collected so far.
This suggests that a reliable and reproducible classifi-
cation of defects cannot be guaranteed in this context.
We therefore strive for a transparent, independent and
automated approach to generate classification models
that can be used for decision support as provided by
our novel algorithm.
6 RESULTS AND DISCUSSION
After applying the k-means clustering algorithms on
the dataset, we evaluate the cluster quality and com-
pare it to expert annotations. Likewise, we then apply
KM-SVM. For better understanding, we plot the data
points of the most important features and illustrate the
cluster results by adding colors.
6.1 Evaluation of Clustering Algorithms
For deeper insights into the dataset, the similarity of
the clusters with the expert annotations from the ref-
erence dataset is computed. For this experiment, k-
means++ is run on the whole dataset. As a similarity
score, IoU is computed to measure the similarity as
defined in section 3.2. The similarity results of each
cluster compared to each of the manually annotated
defect class are presented in figure 5 for k = 4 since
this is the number of clusters returned by KM-SVM
for the majority of batches.
As figure 8 suggests, the silhouette coefficient s(k)
decreases from a value of 0.8 for k = 2 to a value
of 0.6 for k = 20. Not surprisingly, s(k) returns the
highest value at k = 2, but the second highest value
of 0.7 occurs for k = 4. This is a comparably high
density score for k > 2.
DATA 2020 - 9th International Conference on Data Science, Technology and Applications
324
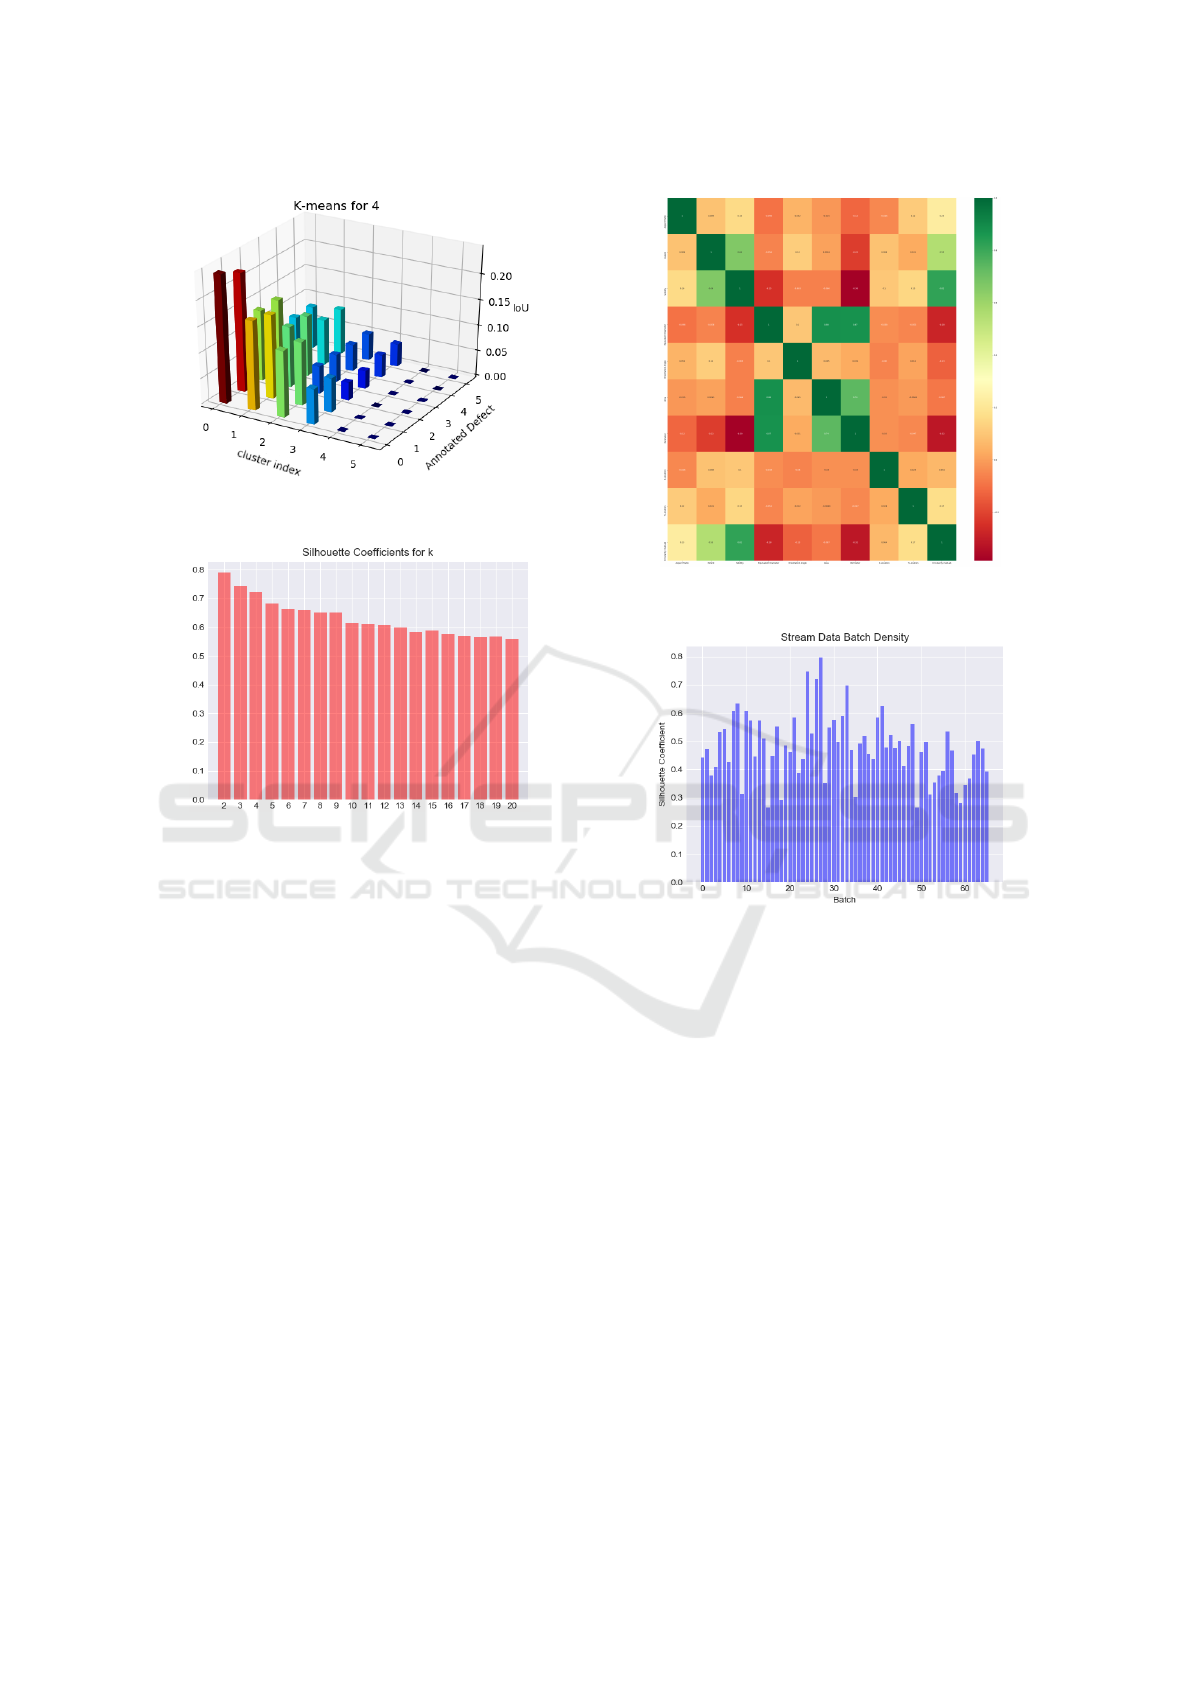
Figure 5: IoU for annotations on the carbon fibre dataset
and k-means clustering with k = 4.
Figure 6: Silhouette coefficients for 2 ≤ k ≤ 20 on the whole
dataset.
Figure 7 shows the correlation between the fea-
tures computed on the ROIs. The highest positive cor-
relation with ρ
X,Y
> 0.8 can be measured between the
following features: circularity and solidity, area and
equivalent diameter, perimeter and equivalent diam-
eter. The closest value to inverse correlation, which is
defined as ρ
X,Y
= −1.0, was computed for the follow-
ing features with ρ
X,Y
< −0.30: perimeter and solid-
ity, circularity and perimeter.
6.2 Batch Data Processing and
Clustering
For the batch processing we set a batch size of 50 de-
fects and a silhouette coefficient threshold of 0.7 as
suggested in section 4. The cluster density is mea-
sured using the silhouette coefficient s(b
i
) for each
batch b
i
as depicted in figure 8. The curve peaks
for batch i = 27 at a value of s(b
27
) = 0.8. In gen-
eral, s(b
i
) ranges between 0.27 and 0.8. 49 out of 66
batches reach a silhouette coefficient of s(b
i
) > 0.4,
17 out of 66 exceed a value of 0.5. This indicates
that overall the data points are well matched to their
cluster centres in the individual batches.
Figure 7: Correlation matrix for all high-level features ac-
quired from the image dataset.
Figure 8: Silhouette coefficient values for clusters of
batches 1 − 66.
The number of clusters peaks at batches 4 and 49
at k = 10 as can be seen in figure 9. For 25 out of
66 batches, the suggested value for k ranges between
5 and 8. For the remaining 39 batches the algorithm
suggests k = 4.
As can be seen in figure 9 the moving average
smoothes potential outliers and still reveals the over-
all trend. A model update is initiated for batches
{17, 30, 39, 40, 55, 65} as in these cases the moving
average exceeds the running value of k with MA(k) >
k + 1. Thereby, updating the SVM model is only trig-
gered if the general trend continues for several iter-
ations, therefore shows an underlying change in the
data distribution.
KM-SVM appears more flexible with little con-
figuration effort compared to neural network ap-
proaches or regular linear SVM. The algorithm read-
justs k only if a stable trend is detected. In real-
world environments where stream data needs to be
constantly processed, it might be beneficial to com-
pute feature extraction on GPU or FPGA processors
Towards Self-adaptive Defect Classification in Industrial Monitoring
325
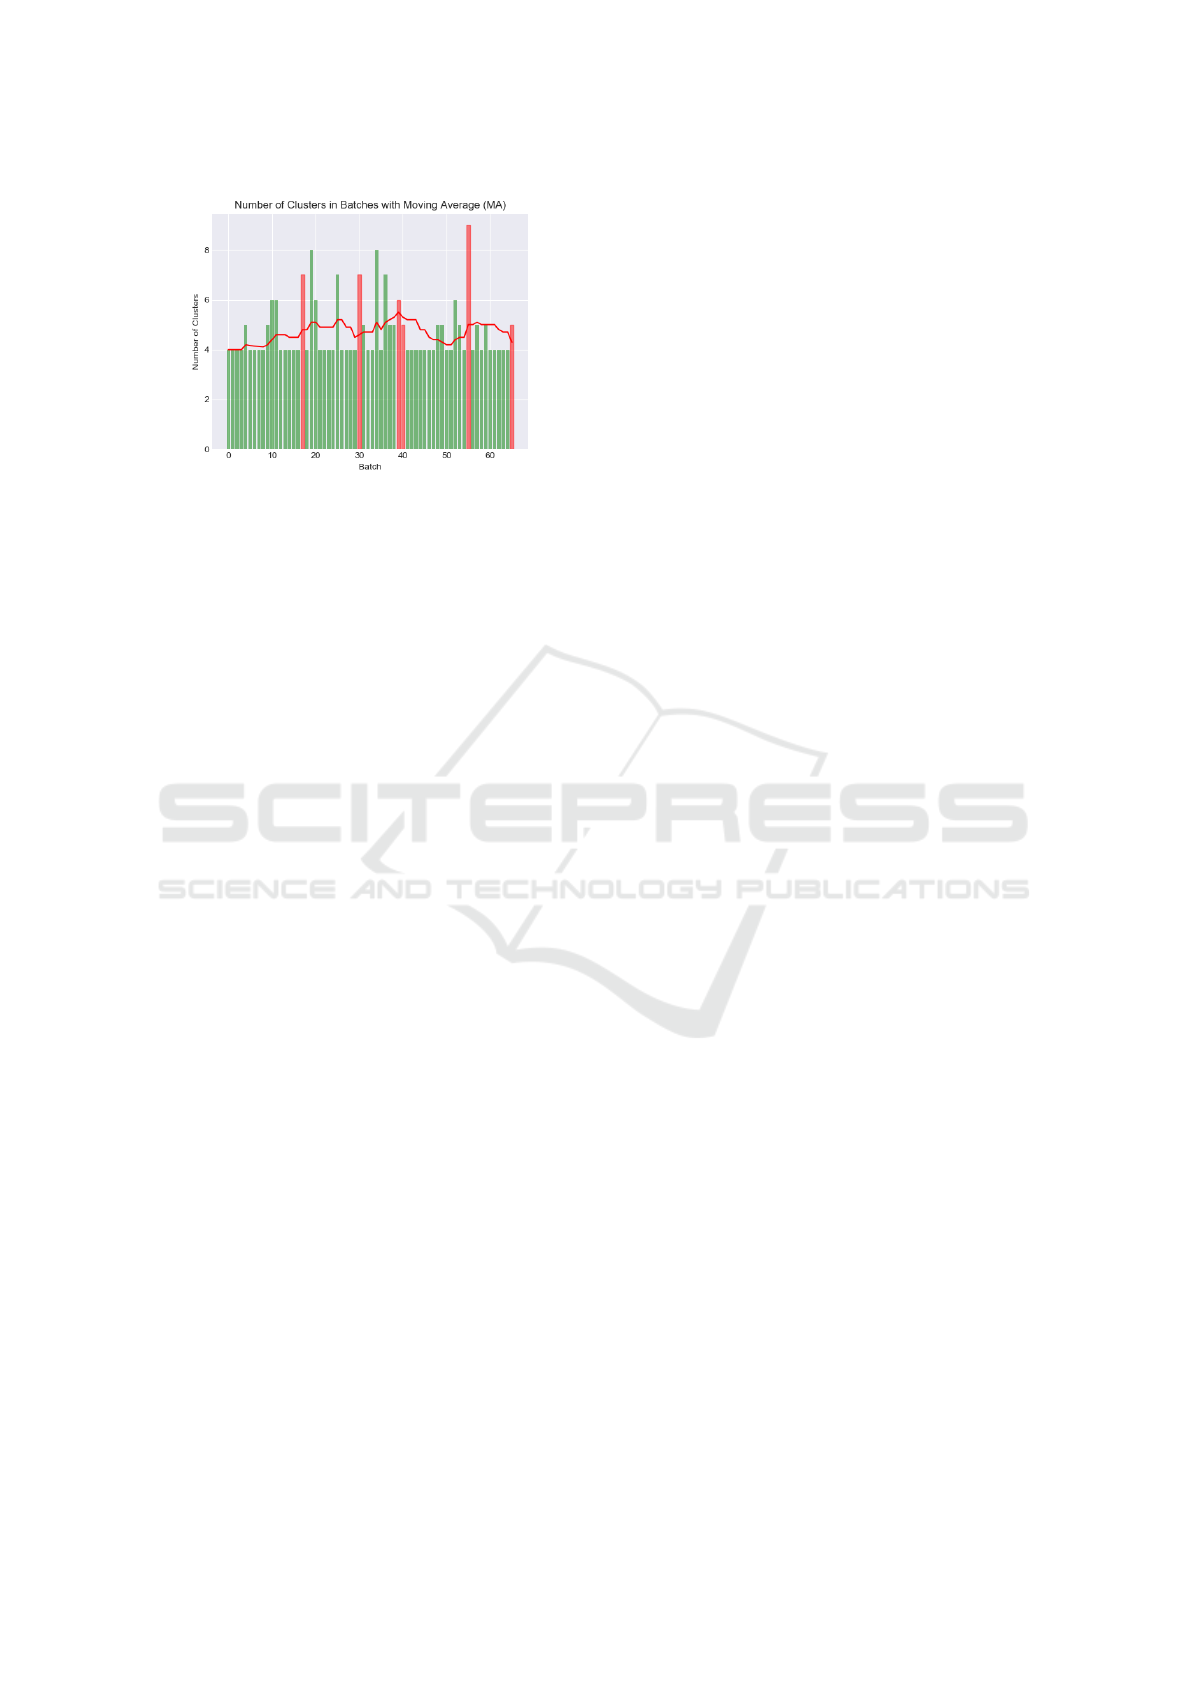
Figure 9: Number of clusters computed for batches 1 − 66
with moving average (red).
to increase performance. This will be part of future
work.
7 SUMMARY AND OUTLOOK
7.1 Conclusions
This study points out that for specific use cases
a goal-oriented use of unsupervised learning may
improve understanding of multi-dimensional data
spaces. From the presented results we can conclude
that clustering allows for an actual unsupervised clas-
sification of defects on textile surface images. The
study indicates that application of clustering creates
promising outcomes and supports quality assurance
decisions. The approach avoids high annotation effort
which would be necessary for supervised models. The
proposed clustering algorithms give more detailed in-
sights into the structure of the data and help to set lim-
its to a) the depth of classification and b) the balance
of the data set.
Furthermore, especially complex models decrease
transparency and render it difficult to trace back single
decisions in order to adapt the model.
7.2 Future Research
Future research will be conducted using OC tech-
niques in order to design systems with an even higher
level of self-adaptation. For this reason, our research
work is focused on classifiers which can be trained
and configured using very little data. In addition, this
paper has not sufficiently examined the benefits of ac-
tive learning. The option of human involvement as
an e. g. partial supervisor might help to compen-
sate some general flaws of clustering strategies and
improve the overall classification results. This would
fall under the umbrella of semi-supervised or active
learning which aims to combine the best of both, the
supervised model training and unsupervised learning.
In the field of online classification, the integration and
implementation of a self-adapting and self-learning
unit to enable clustering to work in changing environ-
ments, e. g. a running production line, will be at the
centre of interest in future projects.
ACKNOWLEDGEMENT
This research and development project is partly
funded by the German Federal Ministry for Economic
Affairs and Energy (BMWi) within the research pro-
gram ”LuFo V-2” managed by the German Aerospace
Center (DLR). The authors would like to thank SGL
Carbon GmbH for their contribution.
REFERENCES
Ackermann, M., Lammersen, C., M
¨
artens, M., Raupach,
C., Sohler, C., and Swierkot, K. (2010). Streamkm++:
A clustering algorithms for data streams. volume 17,
pages 173–187.
Arthur, D. and Vassilvitskii, S. (2007). k-means++: The
advantages of careful seeding. In Proceedings of the
eighteenth annual ACM-SIAM symposium on Discrete
algorithms, pages 1027–1035. Society for Industrial
and Applied Mathematics.
Banerjee, M., Capozzoli, M., McSweeney, L., and Sinha,
D. (1999). Beyond kappa: A review of interrater
agreement measures. Canadian Journal of Statistics,
27(1):3–23.
Carnein, M. and Trautmann, H. (2018). evostream — evo-
lutionary stream clustering utilizing idle times. Big
Data Research, 14:101 – 111.
Carnein, M. and Trautmann, H. (2019). Optimizing data
stream representation: An extensive survey on stream
clustering algorithms. Business & Information Sys-
tems Engineering, 61(3):277–297.
Chen, Y., Wang, G., and Dong, S. (2003). Learning with
progressive transductive support vector machine. Pat-
tern Recognition Letters, 24(12):1845–1855.
Chester, U. and Ratsaby, J. (2013). Machine learning
for image classification and clustering using a uni-
versal distance measure. In Brisaboa, N., Pedreira,
O., and Zezula, P., editors, Similarity Search and Ap-
plications, pages 59–72, Berlin, Heidelberg. Springer
Berlin Heidelberg.
Ester, M., Kriegel, H.-P., Sander, J., Xu, X., et al. (1996).
A density-based algorithm for discovering clusters in
large spatial databases with noise. In Kdd, volume 96,
pages 226–231.
Finley, T. and Joachims, T. (2005). Supervised clustering
with support vector machines. In Proceedings of the
22nd international conference on Machine learning,
pages 217–224.
DATA 2020 - 9th International Conference on Data Science, Technology and Applications
326

Gan, G., Ma, C., and Wu, J. (2007). Data clustering: theory,
algorithms, and applications, volume 20. Siam.
Gan, J., Li, A., Lei, Q.-L., Ren, H., and Yang, Y. (2017).
K-means based on active learning for support vector
machine. In 2017 IEEE/ACIS 16th International Con-
ference on Computer and Information Science (ICIS),
pages 727–731. IEEE.
Geinitz, S., Margraf, A., Wedel, A., Witthus, S., and Drech-
sler, K. (2016). Detection of filament misalignment in
carbon fiber production using a stereovision line scan
camera system. In Proc. of 19th World Conference on
Non-Destructive Testing, Munich, Germany.
Grira, N., Crucianu, M., and Boujemaa, N. (2004). Unsu-
pervised and semi-supervised clustering: a brief sur-
vey. A review of machine learning techniques for pro-
cessing multimedia content, 1:9–16.
Gu, Q. and Han, J. (2013). Clustered support vector ma-
chines. In Artificial Intelligence and Statistics, pages
307–315.
Hahsler, M. and Bola
˜
nos, M. (2016). Clustering data
streams based on shared density between micro-
clusters. IEEE Transactions on Knowledge and Data
Engineering, 28(6):1449–1461.
Halkidi, M., Batistakis, Y., and Vazirgiannis, M. (2001). On
clustering validation techniques. Journal of intelligent
information systems, 17(2-3):107–145.
Huang, Z. (1998). Extensions to the k-means algorithm for
clustering large data sets with categorical values. Data
mining and knowledge discovery, 2(3):283–304.
Jain, A. K. (2010). Data clustering: 50 years beyond k-
means. Pattern recognition letters, 31(8):651–666.
Ji, X., Henriques, J. F., and Vedaldi, A. (2019). Invariant
information clustering for unsupervised image classi-
fication and segmentation. In Proceedings of the IEEE
International Conference on Computer Vision, pages
9865–9874.
Joachims, T. (1999). Transductive inference for text classi-
fication using support vector machines. In Icml, vol-
ume 99, pages 200–209.
Laskov, P., Gehl, C., Kr
¨
uger, S., and M
¨
uller, K.-R. (2006).
Incremental support vector learning: Analysis, imple-
mentation and applications. Journal of machine learn-
ing research, 7(Sep):1909–1936.
Le, Q. V. (2013). Building high-level features using large
scale unsupervised learning. In 2013 IEEE interna-
tional conference on acoustics, speech and signal pro-
cessing, pages 8595–8598. IEEE.
Lee, J. and Lee, J.-H. (2014). K-means clustering based
svm ensemble methods for imbalanced data prob-
lem. In 2014 Joint 7th International Conference on
Soft Computing and Intelligent Systems (SCIS) and
15th International Symposium on Advanced Intelli-
gent Systems (ISIS), pages 614–617. IEEE.
Margraf, A., Geinitz, S., Wedel, A., and Engstler, L.
(2017a). Detection of surface defects on carbon fiber
rovings using line sensors and image processing algo-
rithms. In Proceedings of the SAMPE Europe Confer-
ence 2017 Stuttgart.
Margraf, A., Stein, A., Engstler, L., Geinitz, S., and H
¨
ahner,
J. (2017b). An Evolutionary Learning Approach to
Self-configuring Image Pipelines in the Context of
Carbon Fiber Fault Detection. In Proceedings of
the 16th IEEE International Conference for Machine
Learning and Applications.
M
¨
uller-Schloer, C. and Tomforde, S. (2017). Organic Com-
puting: Technical Systems for Survival in the Real
World. Autonomic Systems. Birkh
¨
auser, Cham, 1st
edition.
MVTec (2018). Halcon a product of mvtec.
Schubert, E., Sander, J., Ester, M., Kriegel, H. P., and Xu,
X. (2017). Dbscan revisited, revisited: why and how
you should (still) use dbscan. ACM Transactions on
Database Systems (TODS), 42(3):19.
Stein, A., Margraf, A., Moroskow, J., Geinitz, S., and
H
¨
ahner, J. (2018). Toward an organic computing ap-
proach to automated design of processing pipelines. In
ARCS Workshop 2018; 31th International Conference
on Architecture of Computing Systems, pages 1–8.
Teodorescu, H.-N., Dascalescu, L., Hulea, M., and Plo-
peanu, M. C. (2013). Correlations between the elec-
tric charging properties and the optically determined
structure of non-woven fabrics. Journal of Electro-
statics, 71(4):635–647.
Trivedi, S., Pardos, Z. A., and Heffernan, N. T. The utility
of clustering in prediction tasks.
Xu, R. and Wunsch, D. C. (2005). Survey of clustering
algorithms.
Yu, H., Yang, J., and Han, J. (2003). Classifying large data
sets using svms with hierarchical clusters. In Proceed-
ings of the ninth ACM SIGKDD international confer-
ence on Knowledge discovery and data mining, pages
306–315.
Zhang, T., Ramakrishnan, R., and Livny, M. (1996). Birch:
an efficient data clustering method for very large
databases. ACM Sigmod Record, 25(2):103–114.
Towards Self-adaptive Defect Classification in Industrial Monitoring
327
