
Application of Computer Vision Technologies for Automated Utility
Meters Reading
Maria Spichkova and Johan Van Zyl
School of Science, RMIT University, Melbourne, Victoria 3000, Australia
Keywords:
Software Engineering, Computer Vision Techniques, Case Study.
Abstract:
This paper presents a study on automated reading of utility meters using two computer vision techniques:
an open-source solution Tensorflow Object Detection (Tensorflow) and a commercial solution Anyline. We
aimed to identify the limitations and benefits of each solution applied to utility meters reading, especially
focusing on aspects such as accuracy and inference time. Our goal was to determine the solution that is the
most suitable for this particular application area, where there are several specific challenges.
1 INTRODUCTION
Development and application of smart meters is an ac-
tive research topic over the last decades, see (Depuru
et al., 2011; Benzi et al., 2011; Zheng et al., 2013).
The smart devices are elaborated for several types of
utilities, e.g., electricity, gas, etc. Their advantage is
that the data on energy consumption is recorded and
sent automatically to the provider as well as, in some
cases, to the corresponding customer. This data can
be used for monitoring and billing purposes. This al-
lows more detailed analysis of the consumption pat-
terns as well as the ways to reduce consumption or
to schedule the energy-consuming tasks for the time,
which is mostly suitable for the energy network (in
the terms of payment or the energy load).
The core disadvantage of this solution is that its
implementation on a large scale is expensive. In the
case customers have to pay for an upgrade to a smart
meter, they might prefer to object the upgrade. Some
customers perceive that the learning curve for using
smart meters is steep, and prefer to avoid using them
by this reason. Also, some customers are concerned
regarding their privacy while using the smart meters,
as the information regarding the usage pattern over
the day might be used to identify whether the resi-
dents are currently at home, home many of them are
at home, etc. Therefore, in some countries the roll out
to the smart meter systems is done step-wise, where
on the initial stage the roll out is voluntary.
On the other hand, a manual collection of meter
readings is not only time consuming, but also some-
times complicated for people with vision impairment.
In our earlier work (Spichkova et al., 2019b), we con-
ducted a project in collaboration with Energy Aus-
tralia, which is an electricity and gas retailing private
company that supplies electricity and natural gas to
more than 2.6 million residential and business cus-
tomers throughout Australia. Their solution for non-
smart meters was to provide an online portal, where
the consumers can update the records on the utility
readings. Thus, the consumers had to provide a lot of
additional details, and to calculate their utility read-
ings manually. The goal of our previous project was
to elaborate an alternative method for the existing sys-
tem, which would allow for a higher degree of au-
tomation to increase the usability of the system. The
proposed solution was to use computer vision tech-
niques for capturing readings. We analysed there
the following computer-vision technologies: Google
Cloud Vision
1
(GCV), Amazon Web Services (AWS)
Rekognition
2
, Tesseract OCR (Smith, 2007), and
Azure’s Computer Vision
3
. The study demonstrated
that AWS Rekognition provides better results for this
application domain. However, it’s accuracy was far
from ideal: the average accuracy values AWS Rekog-
nition was only 36%.
Contributions: In this paper we present our recent
study, where we compared with our previous results
two further computer vision technologies, Tensorflow
Object Detection (Tensorflow) and Anyline:
1
https://cloud.google.com/vision
2
https://aws.amazon.com/rekognition
3
https://docs.microsoft.com/en-us/azure/
cognitive-services/computer-vision
Spichkova, M. and Van Zyl, J.
Application of Computer Vision Technologies for Automated Utility Meters Reading.
DOI: 10.5220/0009892505210528
In Proceedings of the 15th International Conference on Software Technologies (ICSOFT 2020), pages 521-528
ISBN: 978-989-758-443-5
Copyright
c
2020 by SCITEPRESS – Science and Technology Publications, Lda. All rights reserved
521
• Tensorflow is an open-source machine learning
system that operates at large scale and offers
a multitude of models to be retrained (more
than 30), see (Abadi et al., 2016; Abadi et al.,
2017). To analyse the Tenserflow results, we ap-
plied the corresponding visualisation tool Tensor-
Board (Wongsuphasawat et al., 2018) that allows
to visualise TensorFlow graphs, plot correspond-
ing quantitative metrics, etc.
4
• Anyline is a commercial solution intended to read
utility meters, which also offers a free sample app
Anyline OCR Scanner
5
that has been used during
tests within our project.
The obtained results are significantly better (see Sec-
tion 4 for details) in the terms of recognition accuracy
than the results of our early investigation study within
the domain of meter reading recognition (Spichkova
et al., 2019b), where we analysed another two com-
puter vision technologies, applied to the same data
sets: the results of the current study demonstrate the
accuracy up to 92.35%.
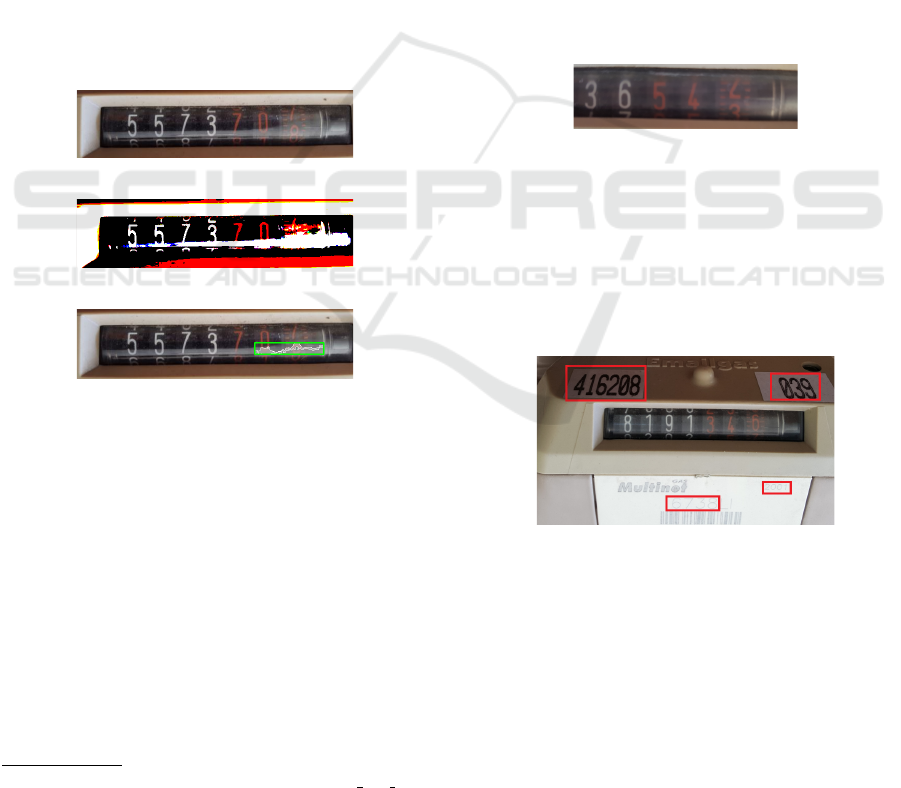
(a) Original image with reflections.
(b) Application of the thresholding technique.
(c) Application of the flooding technique.
Figure 1: Reflection issues.
2 BACKGROUND
There are many challenges for application of com-
puter vision technologies for the reading of utility me-
ters, such as:
• Reflections: Most meter models encountered has
a transparent protective cover, see Figure 1(a),
which lead to reflections from it. This be-
comes problematic for computer vision technolo-
gies which includes thresholding/flooding tech-
niques.
4
https://www.tensorflow.org/guide/summaries and
tensorboard
5
https://anyline.com/products/ocr-meter-reading
Thresholding techniques are usually applied to
OCR technologies in-order to minimize noise and
or to convert to black-and-white images. Fig-
ure 1(b) illustrates an application of threshold.
The threshold in this case has removed the last
digit completely and clipped several other digits.
Flooding is a technique used to find similar neigh-
bouring pixels. This technique can be used when
finding contours of shapes. Figure 1(c) displays
flooding made on the last digit. This technique
failed to find the contour of the digit and the con-
tour of reflection was found instead.
• Clipped Digits: The final digit in analogue meters
usually rotate freely. This becomes problematic as
the digit becomes clipped and the full digit is not
displayed. Figure 2 presents an example of such
case: the final digit is both a 2 and a 3 with neither
being displayed completely. The computer vision
technology would need to be able to read clipped
digits.
Figure 2: Clipped Digits.
• Not all characters and digits, which can be iden-
tified on the meter, actually belong to the meter
reading: Utility meters commonly include other
text as seen red boxes in Figure 3. The computer
vision technology would need to be able to dis-
criminate which digits are part of the meter read-
ing, and which have to be ignored.
Figure 3: Digits on the meter, which do not belong to the
meter reading.
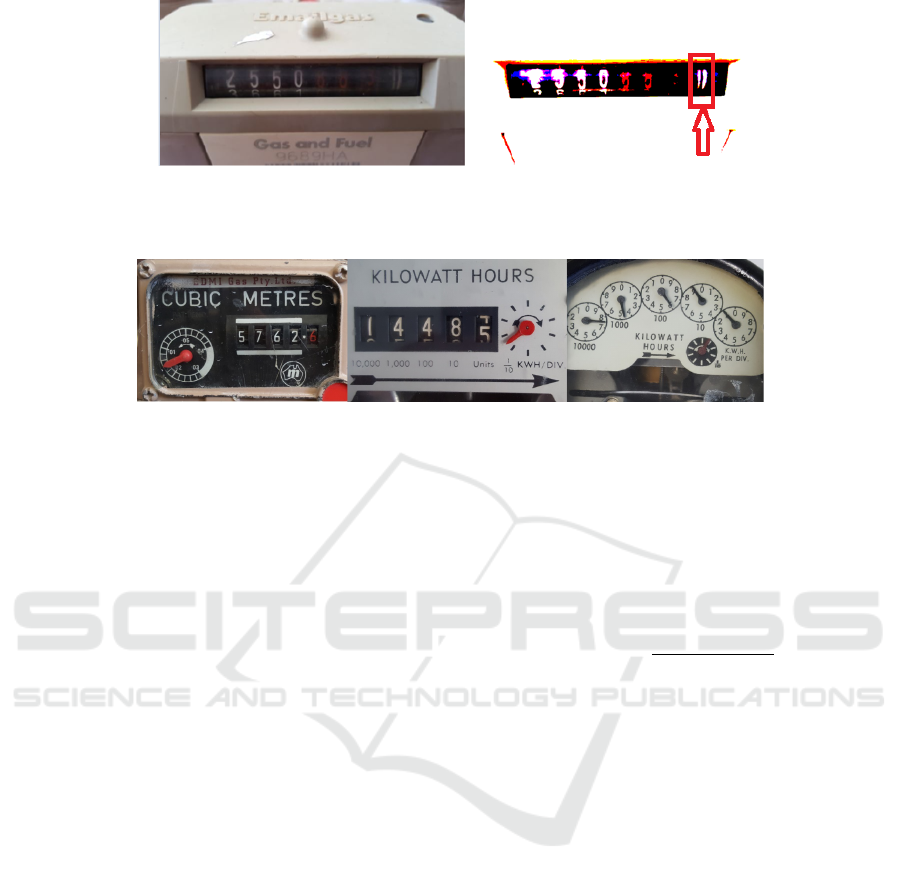
• Blur, noise, warping, etc.: The grime adds noise
to the observed meter. Grime with reflection cre-
ates a blur effect around some digits, see Figure 4
(digits 2 and 5). Digits are also observed to be
warped along with the shape of the cover, e.g., the
digits appear “stretched” or “squashed” depend-
ing on observation angle. Furthermore, there can
be a significant contrast difference in scenarios
where the colour of the digits is mixed. For exam-
ple, in Figure 4, the final 3 digits (883) have low
ICSOFT 2020 - 15th International Conference on Software Technologies
522

contrast and are barely observable in comparison
to the first 4 digits.
• Different representation styles (scales, dials and
digits) mixed within a meter interface.
Utility models observed during the project pre-
sented their reading value either through: using
rotational dials, using cyclometers, a combination
of rotational dials and cyclometers or a singular
digital display. The challenge becomes even more
complex when the numeric value is displayed on
a scale, e.g., as presented in Figure 5:
– The meter (a) should be read as 5762.615m
3
gas and not 57626,
– The meter (b) should be read as 14485.68kWh
energy and not 14485,
– The meter (c) should be read as 75691.1kWh
energy and not 756911.
The meters commonly include a decimal point.
Most meters include the decimal point as the last
digit and can be read and a tenth. Sometimes it is
a mixture of a digit and a dial as in Figures 5(b)
and (c).
Some models display three decimal points as seen
in Figure 4 (the digits after decimal points are
highlighted with red colour), which should read
as 2550.883m
3
and not 2550883. Thus, our aim
is to identify a computer vision technology that
is capable of distinguishing between different nu-
meric scales and be able to detect both digits and
rotation of dials.
3 METHODOLOGY
To determine which of these technologies is most suit-
able for reading utility meters, we elaborated a set of
tests that allows us to identify the limitations of each
technology by gradually adjusting image blur, noise,
gamma or scale.
The following methodology was applied to anal-
yse the techniques:
1. To create a training dataset for the Tensorflow Ob-
ject Detection framework.
2. To train all the different models using the dataset,
which was elaborated at Step 1. This was done
through Google ML Engine.
3. To create evaluation datasets for which the tech-
nologies can be tested against.
4. To create a test harness for the involved technolo-
gies.
5. To run the test harness on the evaluation datasets
created from Step 3.
The training dataset is a set of all images found during
project duration. The final training dataset consisted
of 395 images and 2000 annotations. Unfortunately,
this is still considered limited as supplied Tensorflow
models were created based upon 2000+ annotations
per object.
As the evaluation dataset we used the same im-
ages as in our earlier work (Spichkova et al., 2019b),
which allowed us to compare the results of applica-
tion of Tensorflow and Anyline not only with each
other, but also with the results of AWS Rekognition
(which demonstrated the best but not good enough
accuracy in our previous study). Thus, in (Spichkova
et al., 2019b), a total of 30 images were selected based
on their “uniqueness” – images with unique meters
or images with unique lighting. These images were
duplicated and modified with various effects in or-
der to test the limitations of the different technologies.
These effects are:
• Scaling: The dataset was scaled in steps of 0.1
ranging from a scale of 0.1 to 0.9 (10% to 90%)
of the original dataset.
• Blurring: Blurring was done in steps of 10 from
10 to 90 with an open source blur algorithm that is
based on the normalised box filter, see (OpenCV,
2018). The algorithm uses a normalised box filter,
the numeral value adjusts the kernel size.
• Gamma: The gamma algorithm was used with
an open source lookup table algorithm (OpenCV,
2018). The gamma correction to simulate differ-
ent lightning conditions.
• Noise: The noise algorithm is based upon the
salt and pepper noise algorithm that adds sharp
and sudden disturbances in the image in the form
of sparsely occurring white and black pixels, see
(Gonzalez and Woods, 2001). This algorithm was
included to further test the performance of the
various technologies as noise arguably emulates
“dirt” on meters.
In contrast to Anyline, Tensorflow’s Tensorboard
provides more in-depth evaluation of each model and
how well each model detects objects for a given
dataset, such as:
• single-shot multi-box detector (SSD), see (Liu
et al., 2016),
• feature pyramid networks (FPN), see (Lin et al.,
2017),
• fast region-based convolutional neural networks
(FRCNN), see (Ren et al., 2017).
Application of Computer Vision Technologies for Automated Utility Meters Reading
523
(a) (b)
Figure 4: Challenging case: (a) Original image; (b) Application of the thresholding technique over the original image.
(a) (b) (c)
Figure 5: Different representation styles (scales, dials and digit) mixed within a meter interface.
Our initial hypotheses in terms of accuracy and detec-
tion rates were as follows:
H1: FRCNN model would significantly outper-
form other models.
H2: SSD model would perform significantly
worse than the other models in terms of accuracy.
H3: The lower the image resolution is, the faster
inference would occur.
H4: FRCNN would require significantly more
time than FPN and SSD models.
As Tensorflow Object Detection only detects ob-
jects, the results have to be filtered in order to give a
reading. We applied the filtering algorithm presented
in Algorithm 1 to
• remove any junk data, i.e., any detected objects
for what the identification confidence is ≤ 10%,
• remove all duplicates within the geometric region,
keeping the results withe the highest identification
confidence.
The filtering algorithm can be further improved, if the
previous reading of the meter is considered, for which
an access to the customer’s account is required. We
haven’t applied this improvement within the compar-
ison study, as the supplied Anyline app cannot include
any customer related data.
Results from each dataset and each technology
were produced in csv files (a comma-separated values
file that allows data to be saved in a tabular format)
with the following structure:
FileName, InferTime, FilteredReading,
ExpectedReading, IsCorrect
where InferTime denotes the interference time,
which was measured in ms.
Similarly to (Spichkova et al., 2019b), we calcu-
lated the accuracy of recognition calculated as the fol-
lowing simple formula (we measure the accuracy in
percents, where 100% means a totally accurate recog-
nition):
Accuracy =
CorrectResults
Total
∗ 100 (1)
where:
CorrectResults is the number of results that match
with the original readings completely,
Total presents the total number of images in a dataset.
As in our study, we had 30 images in each of the
datasets, Total = 30.
4 RESULTS AND DISCUSSION
Figures 7-9 present the identified accuracy scores per
dataset, where 50% indicates half of the dataset meter
images were correctly read.
It is important to mention that both Tensorflow
and Anyline were less sensitive to scaling, gamma,
and sat and paper issues than to blurring, but, the ac-
curacy of Tensorflow was almost twice higher:
• With low blurring (10BLUR and 20BLUR), Ten-
sorflow performed with 100% accuracy, where the
accuracy of Anyline dropped to approx. 63% and
50% respectively.
• For the effect of 50BLUR, the accuracy of Ten-
sorflow FPN and Anyline were approx. 87% and
37% respectively.
ICSOFT 2020 - 15th International Conference on Software Technologies
524
Algorithm 1: Filtering of meter readings.
1: j = 1
2: for all i ← 1, n do
3: if con f idence(result[i]) > 10% then
4: if result[i] is unique within geometric region then
5: list[ j] = result[i]
6: j = j + 1
7: else where list[k] is the duplicate of result[i]
8: if confidence(result[i]) > confidence(list[k]) then
9: list[k] = result[i]
10: end if
11: end if
12: end if
13: end for
14: Sort list[i] by geometric location from left to right
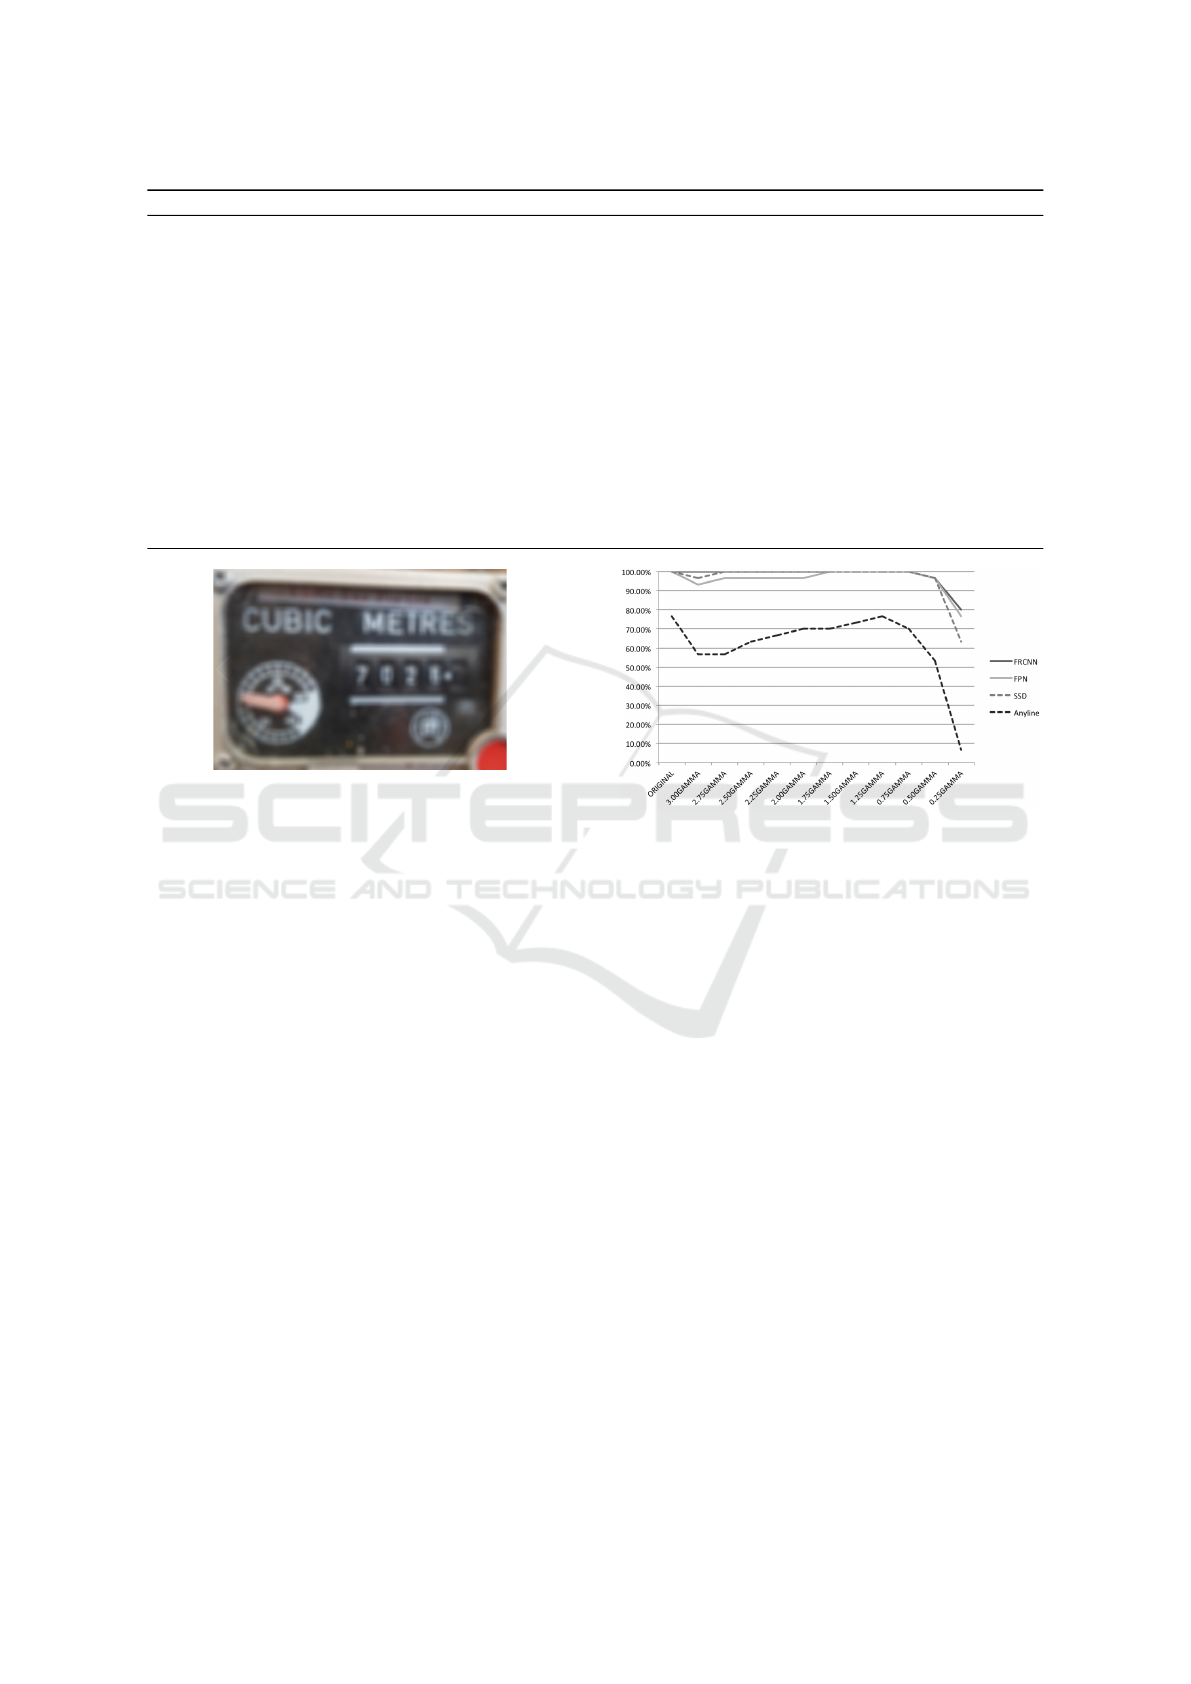
Figure 6: Example of an application of the blurring effect
with 90BLUR.
• For the effect of 90BLUR, the accuracy for Ten-
sorflow FRCNN, Tensorflow SSD and Anyline
was only 10%, where the accuracy of Tensorflow
FPN was approx. 33%. However, the 90BLUR
effect means a very blurry image, see Figure 6 for
an example.
The overall performance of the Tensorflow models
greatly surpass expectations in terms of accuracy,
having an average performance of 88.14%, 89.51%
and 92.35% for FRCNN, SSD, and FPN, respectively.
This is especially remarkable, if we compare it with
the average accuracy values from AWS Rekognition
was only 36% that demonstrated the best (but not re-
ally satisfactory) results within the study presented in
(Spichkova et al., 2019b).
TensorBoard confirms the accuracy of the trained
models. Scoring a near perfect score of 1.0 is ex-
tremely significant is a strong indication that Tensor-
flow Object Detection is a suitable framework for the
automated meter reading.
Anyline performed arguably well having an aver-
age performance of 57.16%, and struggled on several
utility meter models. The results indicate that Anyline
may not have trained or tested their product on a simi-
lar utility meters models as used within the Australian
Figure 7: Accuracy scores per dataset: Gamma analysis.
market. The accuracy of Anyline was significantly
lower for all data sets: if compared with Tensorflow
FPN, the accuracy of Anyline was in average lower
approx. 35% lower, where
• the largest differences in the cases of
0.25GAMMA (approx. 70%) and 20BLUR
(approx. 57%);
• the largest difference (approx. 23%) was in the
cases of 1.25GAMMA, 0.12SP (noise), 90BLUR,
and the original data sets.
With respect to our hypotheses H1-H4, the results of
the conducted study can be summarises as follows:
• H1 and H2 were disproved by the conducted
study: In the terms of accuracy, the best per-
forming model was FPN, where FRCNN and SSD
were performing slightly worse than the other
models.
• H3 was proved as correct.
• H4 was also proved as correct: In average, FR-
CNN was approx. 2.5 slower than FPM and ap-
prox. 3.2 times slower than SSD.
The results for both Tensorflow and Anyline are
also significantly better than the results of our
Application of Computer Vision Technologies for Automated Utility Meters Reading
525
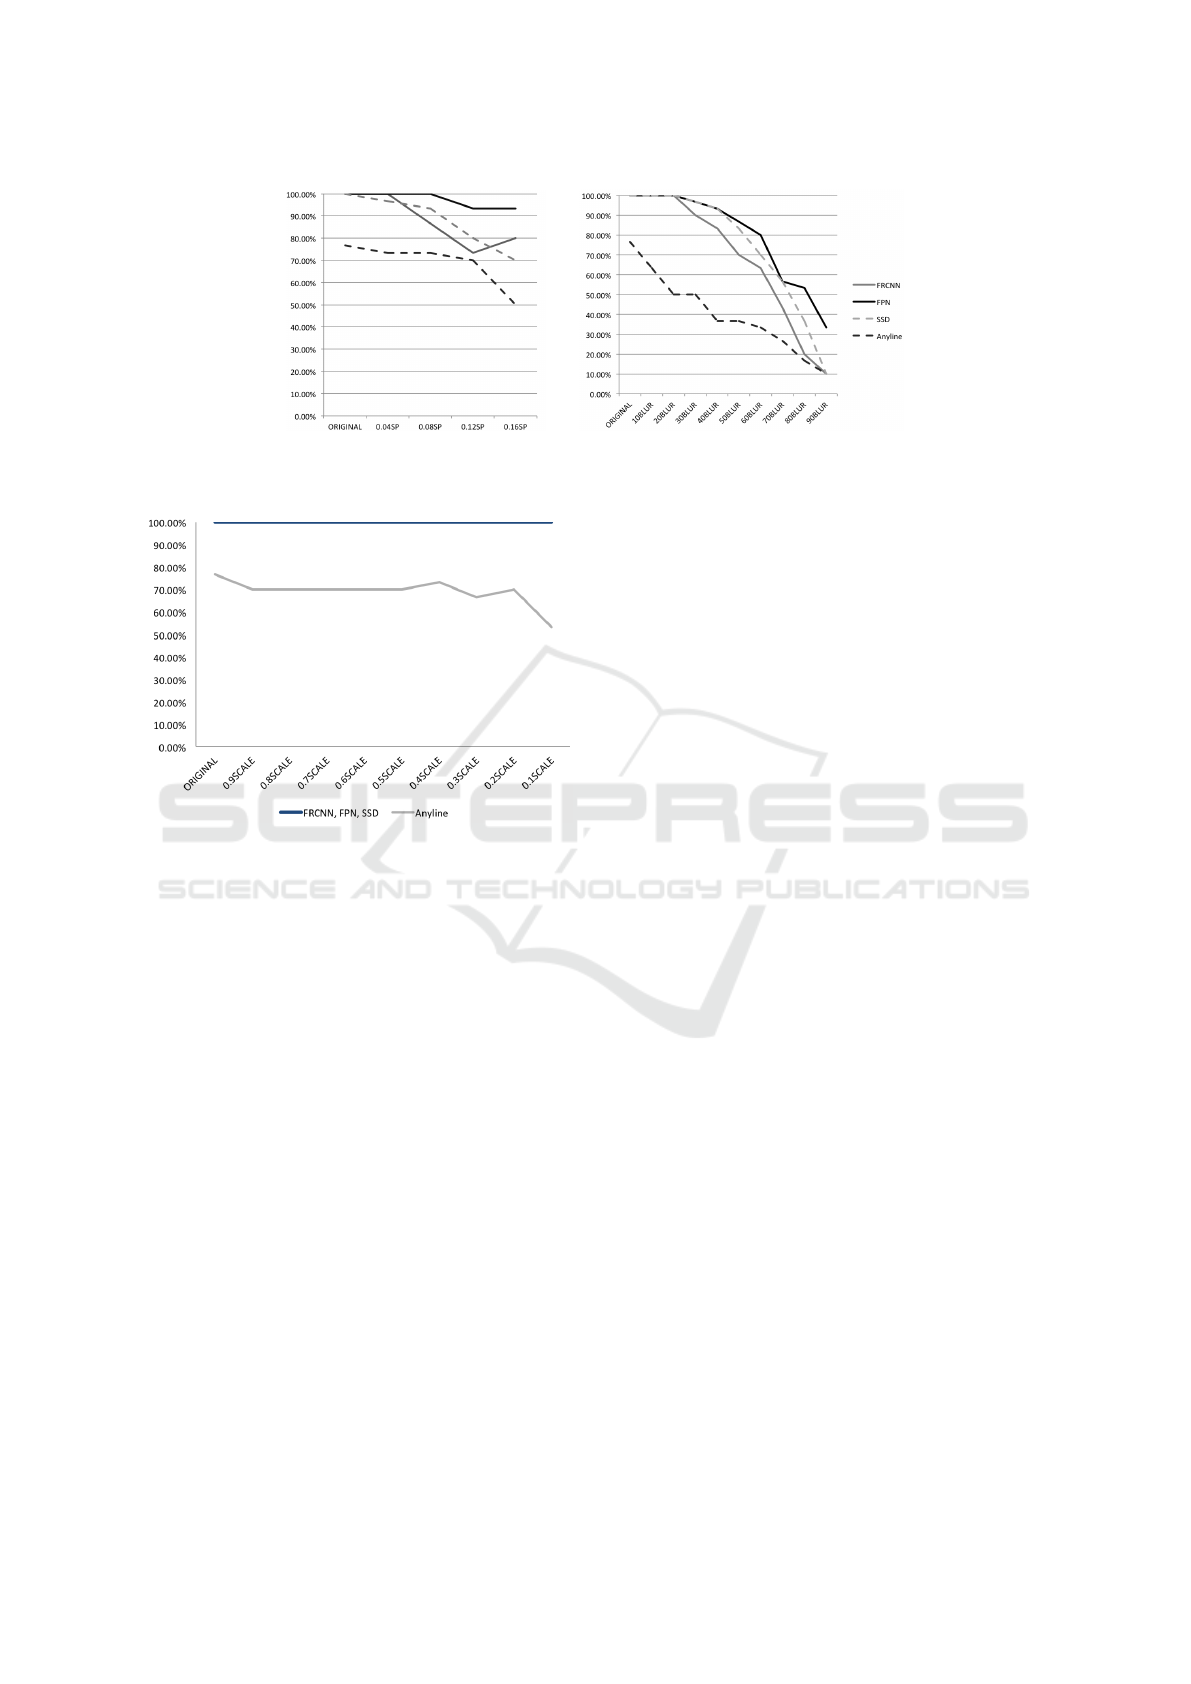
(a) (b)
Figure 8: Accuracy scores per dataset: (a) Salt and pepper analysis; (b) Blur analysis.
Figure 9: Accuracy scores per dataset: Scale analysis.
early investigation study conducted for the domain
of meter reading recognition, where we analysed
Google Cloud Vision (GCV) and Amazon Web Ser-
vices (AWS) Rekognition using the same data sets.
The average accuracy values for GCV and AWS
Rekognition were just 29% and 36% respectively,
see (Spichkova et al., 2019b).
5 RELATED WORK
The research on the smart meter devices and the
corresponding analytic was actively conducted over
many years, which was reflected not only in research
publications but also in patents, see e.g., (Ehrke et al.,
2003; Grady et al., 2016; Winter, 2017).
Over the last decade, there were two core research
directions in this area: (1) privacy and security
aspects of the smart meter application, and (2) smart
meters in combination with a smart grid system. In
the rest of the section we discuss the most cited (as
per Google Scholar) publications, grouped by the
research directions.
Privacy and Security Aspects of Smart Meters:
This research direction is currently the most active
one among the mentioned directions, because the pri-
vacy and security concerns provide one of the biggest
obstacles for the (potential) users of smart meters.
In many cases, data mining and data analytics tech-
niques were applied on the meter reading data, to in-
vestigate the above issues questions.
A privacy-preserving smart meter architecture
was presented in (Molina-Markham et al., 2010). The
authors also conducted a study to demonstrate that the
power consumption patterns can help to reveal how
many people are in the home, what are their sleeping
and eating routines, etc.
A theoretical framework to analyse privacy as-
pects of smart meters was introduced in (Sankar et al.,
2013). A formal framework to quantify the privacy
trade off problem in smart meter data was introduced
in (Rajagopalan et al., 2011).
An approaches for occupancy detection from
electricity consumption data were proposed in
(Kleiminger et al., 2013).
The extraction of the households characteristics
from the the smart meter data was discussed in
(Beckel et al., 2014).
Similarly, the question on what the consumption
patterns (created on the basis of the smart meter data)
might say about the consumers, was discussed in (Al-
bert and Rajagopal, 2013) and (Beckel et al., 2014).
An approach for non-intrusive occupancy mon-
itoring using smart meters was discussed in (Chen
et al., 2013). This work aimed to implement energy-
efficiency optimisations based on the information of
home’s occupancy.
Design of Smart Meters for the Smart Grid: An
approach for anonymizing the data sent by a smart
meter to achieve security and privacy of the smart grid
was proposed in (Efthymiou and Kalogridis, 2010).
A smart meter data aggregation approach for smart
grids was introduced in (Li et al., 2010). The authors
ICSOFT 2020 - 15th International Conference on Software Technologies
526

applied homomorphic encryption to solve the privacy
issue. An overview of typical smart meter’s aspects
and functions wrt. smart grid aspects was presented
in (Zheng et al., 2013).
6 CONCLUSIONS
We presented the results of a research project, which
goal was to provide an alternative method for the cur-
rent system to update the meter reading data, collected
from non-smart utility meters.
Our early investigation study on the recognition
accuracy of Google Cloud Vision and AWS Rekogni-
tion applied for recognition in utility meter readings,
demonstrated very low average accuracy values (29%
and 36%, respectively). For this reasons, we con-
ducted a further study to analyse two other computer
vision technologies, applied for recognition in utility
meter readings:
• an open-source Tensorflow technique (FRCNN,
FPN, and SSD models), and
• a commercial solution Anyline.
The study demonstrated that Tensorflow provides sig-
nificantly better results for our application domain
(92.35% for the FPN model), in comparison to Any-
line, as well as to Google Cloud Vision and AWS
Rekognition.
This research project was conducted under
the initiative Research embedded in teaching, see
(Spichkova, 2019; Simic et al., 2016; Spichkova
and Simic, 2017). This initiative was proposed at
the RMIT University (Melbourne, Australia) within
the Software Engineering projects (SEPs) conducted
in collaboration with industrial partners. The aim
of this initiative is to encourage students’ curiosity
for Software Engineering and Computer Science re-
search. To reach this aim we include research com-
ponents as bonus tasks in the final year projects (on
both undergraduate and postgraduate levels), which
typically focus on software and system development.
Few weeks long research projects have been spon-
sored by industrial partners, who collaborated with
the students and academic advisers through the fi-
nal year projects. Respectively, the topics of these
short research projects focus align the topics final year
projects. The successful results of this initiative are
presented in (Christianto et al., 2018; Clunne-Kiely
et al., 2017; Spichkova, 2018; Spichkova et al., 2018;
Spichkova et al., 2019b; Sun et al., 2018; Chugh et al.,
2019; Gaikwad et al., 2019; Spichkova et al., 2019a).
ACKNOWLEDGEMENTS
We would like to thank Shine Solutions and Energy
Australia for sponsoring this project under the re-
search grant RE-03615.
REFERENCES
Abadi, M., Barham, P., Chen, J., Chen, Z., Davis, A., Dean,
J., Devin, M., Ghemawat, S., Irving, G., Isard, M.,
et al. (2016). Tensorflow: a system for large-scale
machine learning. In OSDI, volume 16, pages 265–
283.
Abadi, M., Isard, M., and Murray, D. G. (2017). A compu-
tational model for tensorflow: an introduction. In Ma-
chine Learning and Programming Languages, pages
1–7. ACM.
Albert, A. and Rajagopal, R. (2013). Smart meter
driven segmentation: What your consumption says
about you. IEEE Transactions on power systems,
28(4):4019–4030.
Beckel, C., Sadamori, L., Staake, T., and Santini, S. (2014).
Revealing household characteristics from smart meter
data. Energy, 78:397–410.
Benzi, F., Anglani, N., Bassi, E., and Frosini, L.
(2011). Electricity smart meters interfacing the house-
holds. IEEE Transactions on Industrial Electronics,
58(10):4487–4494.
Chen, D., Barker, S., Subbaswamy, A., Irwin, D., and
Shenoy, P. (2013). Non-intrusive occupancy moni-
toring using smart meters. In Embedded Systems For
Energy-Efficient Buildings, pages 1–8. ACM.
Christianto, A., Chen, P., Walawedura, O., Vuong, A.,
Feng, J., Wang, D., Spichkova, M., and Simic, M.
(2018). Enhancing the user experience with vertical
transportation solutions. Procedia Computer Science,
126:2075–2084.
Chugh, R., Chawla, N., Gracias, R. M., Padda, J. S., Li,
S., Nguyen, M. T., Spichkova, M., and Mantri, N.
(2019). Automated gathering and analysis of cannabi-
noids treatment data. Procedia Computer Science,
159:2570–2579.
Clunne-Kiely, L., Idicula, B., Payne, L., Ronggowarsito, E.,
Spichkova, M., Simic, M., and Schmidt, H. (2017).
Modelling and implementation of humanoid robot be-
haviour. In Knowledge-Based and Intelligent Infor-
mation & Engineering Systems, pages 2249–2258. El-
sevier Science Publishers BV.
Depuru, S., Wang, L., Devabhaktuni, V., and Gudi, N.
(2011). Smart meters for power grid. challenges, is-
sues, advantages and status. In 2011 IEEE/PES Power
Systems Conference and Exposition, pages 1–7. IEEE.
Efthymiou, C. and Kalogridis, G. (2010). Smart grid pri-
vacy via anonymization of smart metering data. In
International Conference on Smart Grid Communica-
tions, pages 238–243. IEEE.
Application of Computer Vision Technologies for Automated Utility Meters Reading
527

Ehrke, L. A., Nap, K. A., and Dresselhuys, D. R. (2003).
Electronic electric meter for networked meter reading.
US Patent 6,538,577.
Gaikwad, P. K., Jayakumar, C. T., Tilve, E., Bohra, N., Yu,
W., and Spichkova, M. (2019). Voice-activated solu-
tions for agile retrospective sessions. Procedia Com-
puter Science, 159:2414–2423.
Gonzalez, R. C. and Woods, R. E. (2001). Digital Im-
age Processing. Addison-Wesley Longman Publish-
ing Co., Inc., 2nd edition.
Grady, B. D., Vaswani, R., and Pace, J. (2016). Method and
system of reading utility meter data over a network.
US Patent 9,464,917.
Kleiminger, W., Beckel, C., Staake, T., and Santini, S.
(2013). Occupancy detection from electricity con-
sumption data. In ACM Workshop on Embedded Sys-
tems For Energy-Efficient Buildings, pages 1–8. ACM.
Li, F., Luo, B., and Liu, P. (2010). Secure information ag-
gregation for smart grids using homomorphic encryp-
tion. In Smart Grid Communications, pages 327–332.
IEEE.
Lin, T.-Y., Doll
´
ar, P., Girshick, R., He, K., Hariharan, B.,
and Belongie, S. (2017). Feature pyramid networks
for object detection. In CVPR, volume 1, page 4.
Liu, W., Anguelov, D., Erhan, D., Szegedy, C., Reed, S.,
Fu, C.-Y., and Berg, A. C. (2016). Ssd: Single shot
multibox detector. In European conference on com-
puter vision, pages 21–37. Springer.
Molina-Markham, A., Shenoy, P., Fu, K., Cecchet, E., and
Irwin, D. (2010). Private memoirs of a smart meter.
In ACM workshop on embedded sensing systems for
energy-efficiency in building, pages 61–66. ACM.
OpenCV (2018). Open source computer vision. https://
docs.opencv.org/3.1.0.
Rajagopalan, S. R., Sankar, L., Mohajer, S., and Poor, H. V.
(2011). Smart meter privacy: A utility-privacy frame-
work. In International conference on smart grid com-
munications, pages 190–195. IEEE.
Ren, S., He, K., Girshick, R., and Sun, J. (2017). Faster
r-cnn: towards real-time object detection with region
proposal networks. IEEE Transactions on Pattern
Analysis & Machine Intelligence, (6):1137–1149.
Sankar, L., Rajagopalan, S. R., and Mohajer, S. (2013).
Smart meter privacy: A theoretical framework. IEEE
Transactions on Smart Grid, 4(2):837–846.
Simic, M., Spichkova, M., Schmidt, H., and Peake, I.
(2016). Enhancing learning experience by collabo-
rative industrial projects. In ICEER 2016, pages 1–8.
Western Sydney University.
Smith, R. (2007). An overview of the tesseract ocr engine.
In Conference on Document Analysis and Recogni-
tion, volume 2, pages 629–633. IEEE.
Spichkova, M. (2018). Automated analysis of the impact
of weather conditions on medicine consumption. In
25th Australasian Software Engineering Conference
(ASWEC), pages 166–170. IEEE.
Spichkova, M. (2019). Industry-oriented project-based
learning of software engineering. In ICECCS, pages
51–61. IEEE.
Spichkova, M., Bartlett, J., Howard, R., Seddon, A., Zhao,
X., and Jiang, Y. (2018). SMI: Stack Management
Interface. In 23rd Int. Conference on Engineering of
Complex Computer Systems), pages 156–159.
Spichkova, M. and Simic, M. (2017). Autonomous systems
research embedded in teaching. In International Con-
ference on Intelligent Interactive Multimedia Systems
and Services, pages 268–277. Springer.
Spichkova, M., van Zyl, J., Sachdev, S., Bhardwaj, A., and
Desai, N. (2019a). Comparison of computer vision ap-
proaches in application to the electricity and gas meter
reading. In ENASE, pages 303–318. Springer.
Spichkova, M., van Zyl, J., Sachdev, S., Bhardwaj, A., and
Desai, N. (2019b). Easy mobile meter reading for
non-smart meters. In 14th Int. Conf. on Evaluation
of Novel Approaches to Software Engineering. IEEE.
Sun, C., Zhang, J., Liu, C., King, B. C. B., Zhang, Y., Galle,
M., Spichkova, M., and Simic, M. (2018). Software
development for autonomous and social robotics sys-
tems. In Intelligent Interactive Multimedia Systems
and Services, pages 151–160. Springer.
Winter, D. (2017). Methods and systems of reading utility
meters and methods and systems of transmitting util-
ity meter data. US Patent 9,752,895.
Wongsuphasawat, K., Smilkov, D., Wexler, J., Wilson, J.,
Man
´
e, D., Fritz, D., Krishnan, D., Vi
´
egas, F. B.,
and Wattenberg, M. (2018). Visualizing dataflow
graphs of deep learning models in tensorflow. IEEE
transactions on visualization and computer graphics,
24(1):1–12.
Zheng, J., Gao, D. W., and Lin, L. (2013). Smart meters
in smart grid: An overview. In Green Technologies
Conference, pages 57–64. IEEE.
ICSOFT 2020 - 15th International Conference on Software Technologies
528
