
Learning Interpretable and Statistically Significant Knowledge
from Unlabeled Corpora of Social Text Messages: A Novel Methodology
of Descriptive Text Mining
Giacomo Frisoni, Gianluca Moro
∗
and Antonella Carbonaro
Department of Computer Science and Engineering – DISI, University of Bologna,
Via dell’Universit
`
a 50, I-47522, Cesena, Italy
Keywords:
Text Mining, Descriptive Analytics, Explainability, Latent Semantic Analysis, Unsupervised Learning, Rare
Diseases.
Abstract:
Though the strong evolution of knowledge learning models has characterized the last few years, the expla-
nation of a phenomenon from text documents, called descriptive text mining, is still a difficult and poorly
addressed problem. The need to work with unlabeled data, explainable approaches, unsupervised and do-
main independent solutions further increases the complexity of this task. Currently, existing techniques only
partially solve the problem and have several limitations. In this paper, we propose a novel methodology of de-
scriptive text mining, capable of offering accurate explanations in unsupervised settings and of quantifying the
results based on their statistical significance. Considering the strong growth of patient communities on social
platforms such as Facebook, we demonstrate the effectiveness of the contribution by taking the short social
posts related to Esophageal Achalasia as a typical case study. Specifically, the methodology produces useful
explanations about the experiences of patients and caregivers. Starting directly from the unlabeled patient’s
posts, we derive correct scientific correlations among symptoms, drugs, treatments, foods and so on.
1 INTRODUCTION
More and more large online communities of patients
aggregate to share experiences and to look for an-
swers to questions in order to safely improve their
health conditions, such as “which are the most effec-
tive and safe medical treatments from patients’ view-
point ?”, “what contributes to the failure of a certain
medical treatment ?”, “which foods cause or lighten a
certain symptom ?” or “for what purposes an expert
centre is more suitable than another ?”.
This kind of answers require to discover, from
large unstructured corpora of unlabeled short text
messages, relationships among concepts of various
nature (e.g., symptoms, treatments, drugs, foods).
Furthermore, only the most significant ones, accord-
ing to objective measures, should be selected.
In particular, we want to understand the underly-
ing reasons that explain some phenomena of interest
by bringing out quantifiable correlations according to
usual statistical significance (i.e., the degree of cer-
tainty about the fact that the relationship between two
∗
Contact author: gianluca.moro@unibo.it
or more variables is not caused by chance), thus en-
abling sorting, selection and filtering. In the medical
field, these could be “citrus fruit” ↔ “acid reflux”:
87%, or “GERD” ↔ “pantoprazole”: 82%. The im-
portance of the problem is evidenced also by the re-
cent Kaggle competition on Covid-19
1
.
Discovering facts based on significant relation-
ships applies to a large number of completely differ-
ent domains. For instance, understanding the main
causes of destructive plane crashes or the reasons be-
hind negative hotel reviews, directly from aviation
text reports or from customer reviews respectively.
We refer to this task of discovering explanations
of phenomena from unstructured texts as descriptive
text mining, which is completely different from the
predictive one, where instead the goal is to estimate
the likelihood of a future outcome based on labeled
data, like for instance text classification or sentiment
analysis (Weiss et al., 2015).
Aspect-based sentiment analysis (Liu and Zhang,
2012) touches just partially the goal of descriptive text
1
https://www.kaggle.com/allen-institute-for-ai/
CORD-19-research-challenge
Frisoni, G., Moro, G. and Carbonaro, A.
Learning Interpretable and Statistically Significant Knowledge from Unlabeled Corpora of Social Text Messages: A Novel Methodology of Descriptive Text Mining.
DOI: 10.5220/0009892001210132
In Proceedings of the 9th International Conference on Data Science, Technology and Applications (DATA 2020), pages 121-132
ISBN: 978-989-758-440-4
Copyright
c
2020 by SCITEPRESS – Science and Technology Publications, Lda. All rights reserved
121

mining. In fact, this kind of analysis infers an overall
rating of each review from the evaluations assigned
to each known feature that characterizes an entity,
for example cleanliness, food, quietness and kindness
for a hotel. It is applied to data which are labeled
and restricted to an expected comparison schema be-
tween equivalent products or services (i.e., with the
same known features), and it does not assess the cor-
relations between the expressed concepts and the out-
come rating of features. However, this approach can-
not be applied in a general context like the one of pa-
tients, where the messages are unlabeled, without a
predefined comparison schema, the features are un-
known and the goal is to discover significant relation-
ships among unbounded combinations of concepts
underlying the explanation of phenomena.
Descriptive text mining is not the goal of deep
learning, where the tasks are highly supervised, re-
quire large datasets (partly alleviated with transfer
learning(Pagliarani et al., 2017)) to achieve satisfac-
tory results and are not designed to explain the learned
knowledge (Montavon et al., 2018). This lack of neu-
ral network transparency has recently opened a new
research thread, called Explainable Artificial Intelli-
gence (XAI) (Gunning, 2017; Liu et al., 2018). Even
if the boundary between explaining a deep learn-
ing model and explaining a phenomenon may seem
blurred, the concepts of explainability and descriptive
text mining should not be confused.
Decision trees (Safavian and Landgrebe, 1991)
represent a halfway solution between descriptive text
mining and explainability, but they do not allow the
identification of fine-grained correlations.
In this paper we propose a novel methodology of
descriptive text mining for the explanation of phe-
nomena from the unsupervised learning of under-
lying relationships with their statistical significance.
The methodology is modular in various parts, which
include documents preprocessing and classification,
term weighting, and language model application for
the representation of documents and terms inside a
single latent semantic space. Subsequently, the adop-
tion of information retrieval methods within the space
thus constructed makes it possible to derive correla-
tions between the represented vectors, and to progres-
sively generate textual explanations. Chi-square hy-
pothesis test is used to determine the statistical sig-
nificance of the extracted knowledge. We introduce
an implementation of the methodology based on an
original use of LSA, as practical example of language
model. However, the main contribute of the paper
is not focused on LSA (which we consider easily re-
placeable by other solutions), but on the potential that
derives from the combined use of the various tech-
niques mentioned above, even in tasks deemed com-
plex to manage (such as descriptive text mining) and
currently of increasing importance. To evaluate its ef-
fectiveness, the methodology has been applied to the
scenario initially described, with the aim of offering
high-value answers to the many questions asked by a
community of people living with a rare disease. To
this end, the results have been validated with domain
experts.
The paper is organized as follows. Section 2
briefly analyzes the existing works in the literature.
In Section 3 we introduce our descriptive text mining
methodology with a LSA implementation. Section 4
shows the application of the contribution on the med-
ical case study and the results obtained. Finally, Sec-
tion 5 sums up the work with conclusive remarks.
2 RELATED WORK
According to (Fisher and Marshall, 2009), descriptive
statistics have the purpose of analyzing and summa-
rizing the data collected in an experiment, expressing
information mainly by means of charts and statistical
indicators. Similarly, in text mining and data min-
ing, descriptive analytics is often treated as a set of
sub-tasks, each aimed at highlighting a certain type of
useful information and exploring a particular aspect
(e.g., word frequencies, strongest correlations among
words and topic extraction). The search for causality
factors behind a phenomenon is called causal analy-
sis and, in the literature, the application of text mining
for this purpose is scarcely addressed.
In (Ahonen et al., 1998), the authors employ data
mining techniques for descriptive phrase extraction,
based on episodes and episode rules, also accompa-
nied by indications about their statistical significance.
However, episode rules are not sufficiently expressive
and require a different construction form depending
on the specific problem that needs to be addressed.
A comprehensive survey on aspect-based senti-
ment analysis is reported in (Liu and Zhang, 2012).
In many applications the selection of the aspects to be
evaluated is carried out manually by an expert user,
who specifies them in a supervised manner. Four
main lines of work can be identified to perform the ex-
traction of latent aspects from text: (i) frequent nouns
and noun phrases identification, (ii) nouns in conjunc-
tion with opinion words, (iii) topic modeling, (iv) as-
sociations with opinion ratings related to documents.
The primary focus of the contribution (even if inde-
pendent of the sentiment analysis task) can be linked
to the approaches supported by the fourth group.
Deep learning networks have achieved consid-
DATA 2020 - 9th International Conference on Data Science, Technology and Applications
122

erable performance among many tasks, like speech
recognition (Nassif et al., 2019), image classification
(Brinker et al., 2019), and question answering (Lan
et al., 2019). These methods are typically applied
to classification and regression problems, which dif-
fer significantly from descriptive text mining. Recent
works demonstrate how simple it is to deceive neu-
ral networks with adversary inputs, and all this fur-
ther increases the need both to investigate their relia-
bility and alternative solutions (Nguyen et al., 2015;
Moosavi-Dezfooli et al., 2017; Papernot et al., 2016;
Jia and Liang, 2017). Explainability seeks to give an-
swers on how a black-box model achieves the results
it produces (e.g., the features considered by a clas-
sification model that distinguishes benign from ma-
lignant tumor cells), but not on why a phenomenon
occurs. In medicine, above all, where wrong deci-
sions by a system can be harmful, the ability to ex-
plain models and phenomena is considered essential
(Mathews, 2019). XAI is a young and rapidly grow-
ing research area, but current solutions do not yet al-
low the exclusive adoption of deep learning models
for the resolution of descriptive text mining. In fact,
almost all of them refer to local explanations, while
descriptive text mining aims to provide global expla-
nations of phenomena. For example, if a typical XAI
solution is able to detect the terms most responsible
for the class prediction of a single textual document,
a descriptive text mining task has instead the objective
of finding the most representative terms of the distri-
bution related to a certain class on the whole corpus.
Decision trees (Safavian and Landgrebe, 1991)
can be used to explain knowledge with a symbolic and
interpretable model, where the highest nodes are also
the most important ones. With them we can discover
the most relevant terms for a certain class (e.g., “pain”
for negative opinion), but not correlations belonging
to many classes that go beyond this aspect, such as
those between drugs, symptoms, lifestyles and so on.
3 METHODOLOGY
Here we discuss a novel methodology of descriptive
text mining capable of offering accurate probabilis-
tic explanations in unsupervised settings. The pro-
posed methodology is independent of the domain and
lends itself to operate in two ways: interactive and au-
tomatic. Section 3.1 illustrates the interactive mode
(where the user is part of the learning process and
can explore the data during the analysis). Section 3.2
shows the transition to a fully automatic mode. Fi-
nally, Section 3.3 presents some observations on the
contribution.
3.1 Interactive Knowledge Extraction
The overall approach comprises several stages, fol-
lowing the general knowledge discovery process. Be-
low, all the phases are discussed in detail, paying at-
tention to the importance of their combination in the
context of the presented work.
3.1.1 Early Steps
Textual content typically has numerous imperfec-
tions, such as grammatical and spelling errors, and
various types of noise. As an initial stage, a trans-
formation pipeline can be applied with the aim of in-
creasing the quality of documents (e.g., encoding uni-
formization, symbols normalization, URL removal,
word lengthening fixing). Thanks to this phase, a doc-
ument like “i suffrer from achalasiaaa” can be con-
verted into “I suffer from achalasia”. Cleaning the
text promotes the identification of concepts and cor-
relations between them, improving the results of all
subsequent phases and reducing the dimensionality.
At this point of the analysis, a pre-trained Named
Entity Recognition (NER) system can be used for un-
supervised categorization of terms contained in the
corpus (e.g., places, foods, symptoms, drugs). This
gives the opportunity for more in-depth analyzes of
entity types, a better understanding of the descrip-
tion for the phenomenon of interest, and the pos-
sibility of being able to connect these concepts to
those of already existing knowledge bases, such as
Wikidata. Its placement among the first steps within
the methodology is justified by the typical depen-
dence of NER systems on preprocessing operations,
like lowercasing, which could make them ineffec-
tive. Information regarding recognized entities must
be reported directly in the textual content of the
documents (entity tagging), such as “I suffer from
<achalasia;/medicine/disease;Q661015>”.
The documents to be analyzed can be selected ap-
plying a filter on their content, for example by using
regex patterns. This operation allows to distinguish
global analyzes (carried out on all documents; e.g.,
“*”) from local analyzes (focused on documents re-
lated to a particular concept, like a medical treatment;
e.g., “poem|endoscopic myotomy”).
Lemmatization allows to increase the similarity
between the terms, and therefore their frequencies.
3.1.2 Documents Classification
After these preliminary steps, it is necessary to de-
fine the phenomenon to be investigated, which can be
represented by the way in which a certain class is dis-
tributed over documents. The attribute to be consid-
Learning Interpretable and Statistically Significant Knowledge from Unlabeled Corpora of Social Text Messages: A Novel Methodology of
Descriptive Text Mining
123

ered as a class could already be available within the
dataset, or it could be calculated for each document at
this stage. The classification could coincide with an
opinion mining task on patients’ social posts, and the
description could have the objective of understand-
ing why the opinion of a certain medical treatment is
overall negative. As another example, the classifica-
tion could refer to a category of air accidents, and the
description could be aimed at highlighting the factors
that lead to destructive ones.
3.1.3 Analysis Preprocessing
This stage has the objective of preparing data for anal-
ysis. It typically includes transformations such as
case-folding, replacement of punctuation and num-
bers with spaces (except for entity tags), extra white-
spaces removal and stopwords removal. Tokenization
is another central aspect in this step. The descriptive
text mining methodology illustrated in this document
can be used in general with any N-Gram tokenization
(e.g., Unigram, Bigram, Trigram), both at the word
and character level. Models based on the latter can be
very powerful (Bojanowski et al., 2017), significantly
increasing the correlations between tokens and there-
fore the ability to bring out latent associations. Since
character-models would require additional steps (in
order to reconstruct the words and return a meaning-
ful explanation), the next stages of the methodology
refer to a unigram word-level approach for simplicity.
3.1.4 Term-document Matrix Construction
A term-document matrix is extracted from the corpus,
where each row stands for a unique term t, each col-
umn stands for a unique document d, and each cell
contains the frequency with which t appears in d.
3.1.5 Feature Selection
Irrelevant terms (in addition to the stopwords) can be
further removed in this stage. One way to accomplish
this is to keep only the terms with a percentage fre-
quency above a certain threshold, such as 1%. From
a co-occurrence point of view, each term should ap-
pear at least twice. However, the percentage thresh-
old for standard terms should be distinguished from
that for entity terms. Depending on the domain and
the specific data source, in fact, a concept of an in-
teresting type (e.g., a drug) could be of fundamental
importance for the purposes of the analysis even if it
is scarcely mentioned in the documents. Term selec-
tion simplifies the model and makes it easier to inter-
pret, reducing also computational times. In any case,
this phase must be performed with caution because
the more terms are eliminated, the more the latent cor-
relations become weak.
3.1.6 Term Weighting
Raw counts do not consider the significance a term
has in the document in which it appears. To better
represent the importance of each term in each docu-
ment, term weighting methods are applied to the term-
document matrix. A good comparison of the available
schemes is proposed in (Domeniconi et al., 2015).
We suggest the use of a variation of the classic tf-idf,
making use of a factor inverse to the entropy of the
term (as defined by Shannon) in the non-local part of
the formula. See Equation 1.
w
t,d
= log(1 + t f
t,d
) × (1 −sEntropy(tdm)) (1)
It strongly affects the production of the description
for the phenomenon investigated. More specifically, it
determines the norms of the vectors in the new space
and therefore their impact on the result.
3.1.7 Language Model
This stage involves the application of a language
model (LM), which forms the basis for the whole
analysis. For space reasons, we have verified and used
only Latent Semantic Analysis (LSA) (Landauer and
Dumais, 1997), reinterpreting it in light of recent de-
velopments in the NLP field. Nonetheless, we believe
it is replaceable with other approaches, such as those
based on neural networks. BERT (Devlin et al., 2018)
and SBERT (Reimers and Gurevych, 2019) are some
examples. There are four reasons why we focused on
LSA (extending it) in this first research.
1. It is an algebraic method, and therefore solid and
explainable in the semantic correlations it returns.
2. It allows mapping both terms and documents
within the same latent semantic space, in a coher-
ent way. Though there are some advancements,
word embeddings and document embeddings are
instead meant to work only on words or docu-
ments in a mutually exclusive manner.
3. It gives the possibility to perform analyzes with
a reduced number of dimensions (even just two).
On the other hand, word embeddings require a
large number of features to function properly. The
BERT model released by Google, for example,
uses 768 hidden units (Devlin et al., 2018).
4. It does not require labeled data and training.
LSA induces global knowledge indirectly from lo-
cal co-occurrence data (without using syntax, lin-
guistic, pragmatics or perceptual information about
DATA 2020 - 9th International Conference on Data Science, Technology and Applications
124
the physical world). It performs a mapping of the
weighted term-document matrix in a reduced vector
space (called “latent semantic space”) which approx-
imates the original one, focusing on the essence of
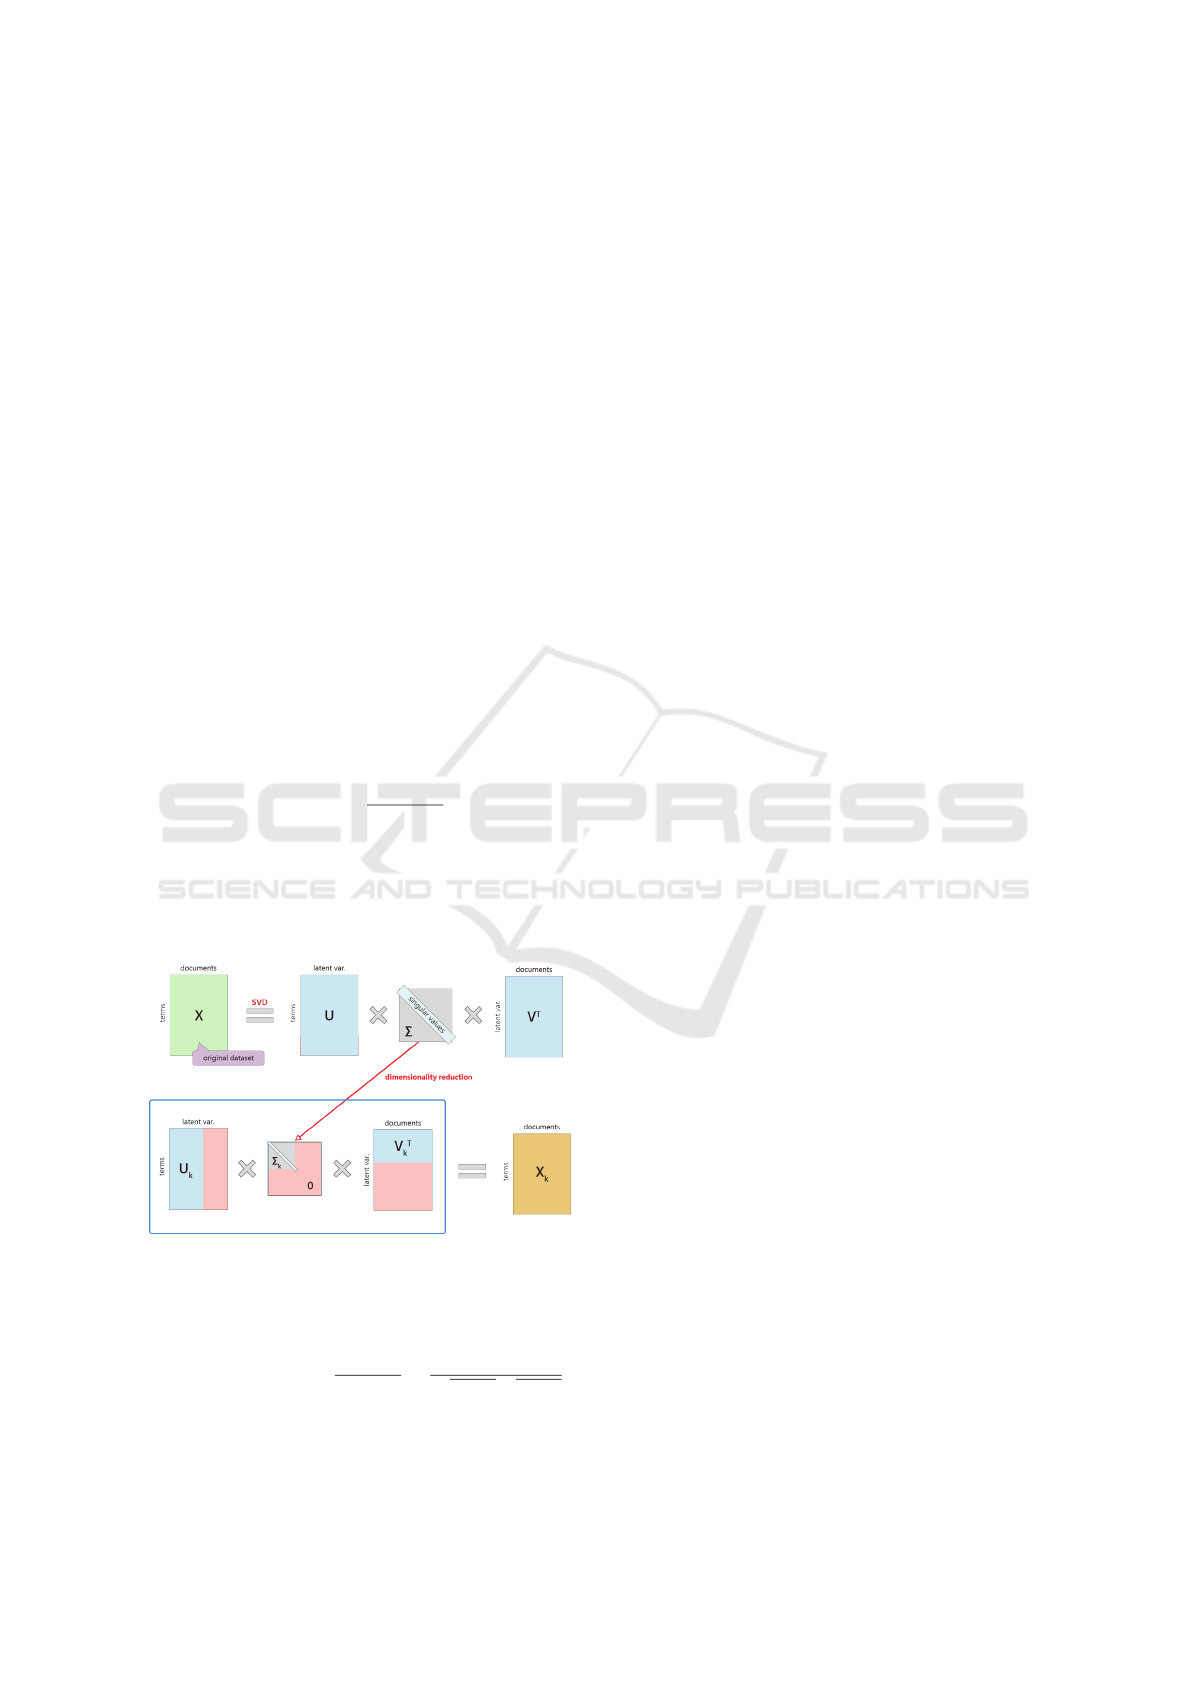
data. The mapping is based on Singular Value De-
composition (SVD), a technique in linear algebra that
factorizes any matrix C into the product of three sep-
arate matrices (Equation 2).
C
M×N
= U
M×M
Σ
M×N
V
T
N×N
(2)
U and V are two orthogonal matrices, and Σ is a diag-
onal matrix containing the singular values of C. For-
mally, Σ = diag(σ
1
,... ,σ
p
) where σ
1
≥ σ
2
≥ · ·· ≥
σ
p
≥ 0 and p = min(M,N).
The singular values in Σ are the components of the
new dimensions, indicating also their importance. Be-
ing in descending order, the first of them capture the
greatest variation of the data (i.e., contain more in-
formation). SVD reduces dimensionality by selecting
only the k largest singular values, and only keeping
the first k columns of U and the first k rows of V
T
.
So, given a matrix C M × N and a positive integer k,
SVD finds the matrix C
k
= U
k
Σ
k
V
t
k
of rank at most
k (between all matrices with k linearly independent
vectors) that minimizes the difference with the orig-
inal matrix X = C − C
k
, according to the Frobenius
norm (Equation 3). Figure 1 resumes this process.
k
X
k
F
=
v
u
u
t
M
∑
i=1
N
∑
j=1
X
2
i j
(3)
The positions of all terms and documents in the la-
tent semantic space are obtained respectively from the
products of matrices U
k
× Σ
k
and V
k
× Σ
k
.
Figure 1: LSA dimensionality reduction through SVD.
Similarity is measured by the cosine between vec-
tors (Equation 4).
sim(A,B) = cos(θ) =
A · B
k
A
kk
B
k
=
n
∑
i=1
A
i
B
i
r
n
∑
i=1
A
2
i
r
n
∑
i=1
B
2
i
(4)
k is a hyperparameter we can select and adjust to
delete noise and unnecessary data, as well as better
capture the mutual implications of terms and docu-
ments. The number of dimensions retained in LSA is
an empirical issue, as well as being highly dependent
on the goal of the single application. Some heuris-
tics are available, but to date there is still no way to
establish it optimally.
Though its representation of reality is basic, rela-
tively simple, and surely imperfect, LSA performs a
powerful induction of knowledge that closely matches
human meaning similarities and has the potential to
address Plato’s Problem (Landauer et al., 1998).
The computational cost of LSA is the same as
SVD: O(min{MN
2
,M
2
N}). No-exact solutions for
SVD significantly reduce costs by orders of magni-
tude compared to the exact version typically imple-
mented (Halko et al., 2011). In some circumstances,
this allows to obtain a decrease in execution times
from a few hours to a few minutes.
3.1.8 2D Space Representation
The visualization of terms and documents in the latent
semantic space (built in the previous step) is useful for
several reasons. Starting from it, it is possible to:
• identify the correlations between terms and terms,
documents and documents, and terms and docu-
ments;
• have a graphical feedback on the distribution of
documents based on their class;
• recognize the presence of any clusters;
• understand the effectiveness of the model and
whether it is necessary to intervene again on the
previous phases to make adjustments.
Even if the new space is made up of k dimensions, a
2D representation must be adopted to make the graph
suitable for human observation. Under this point of
view, t-SNE (Maaten and Hinton, 2008) can be use-
ful for mapping high-dimensional data to two dimen-
sions, compressing all the original ones so as to mini-
mize divergences. However, this task can be achieved
independently of it. For example, with LSA as LM,
the choice of the two dimensions to be adopted for
visualization purposes can be made directly from the
singular values in the matrix Σ. Since the latter are
in descending order and indicate the importance of
their dimensions in the transformed space, a good
choice concerns the dimensions associated with two
high singular values without too much difference be-
tween them (to have a good approximation and avoid
a strong crushing of data on one axis with respect to
Learning Interpretable and Statistically Significant Knowledge from Unlabeled Corpora of Social Text Messages: A Novel Methodology of
Descriptive Text Mining
125
the other). In any case, generally it does not go be-
yond the fourth dimension, because the information
captured is much lower than the previous ones. The
power law curve formed by the singular values in Σ
is a valid tool to make this decision (Figure 2). To
prevent terms and documents from being displayed at
different scales, a good practice is to normalize vec-
tors.
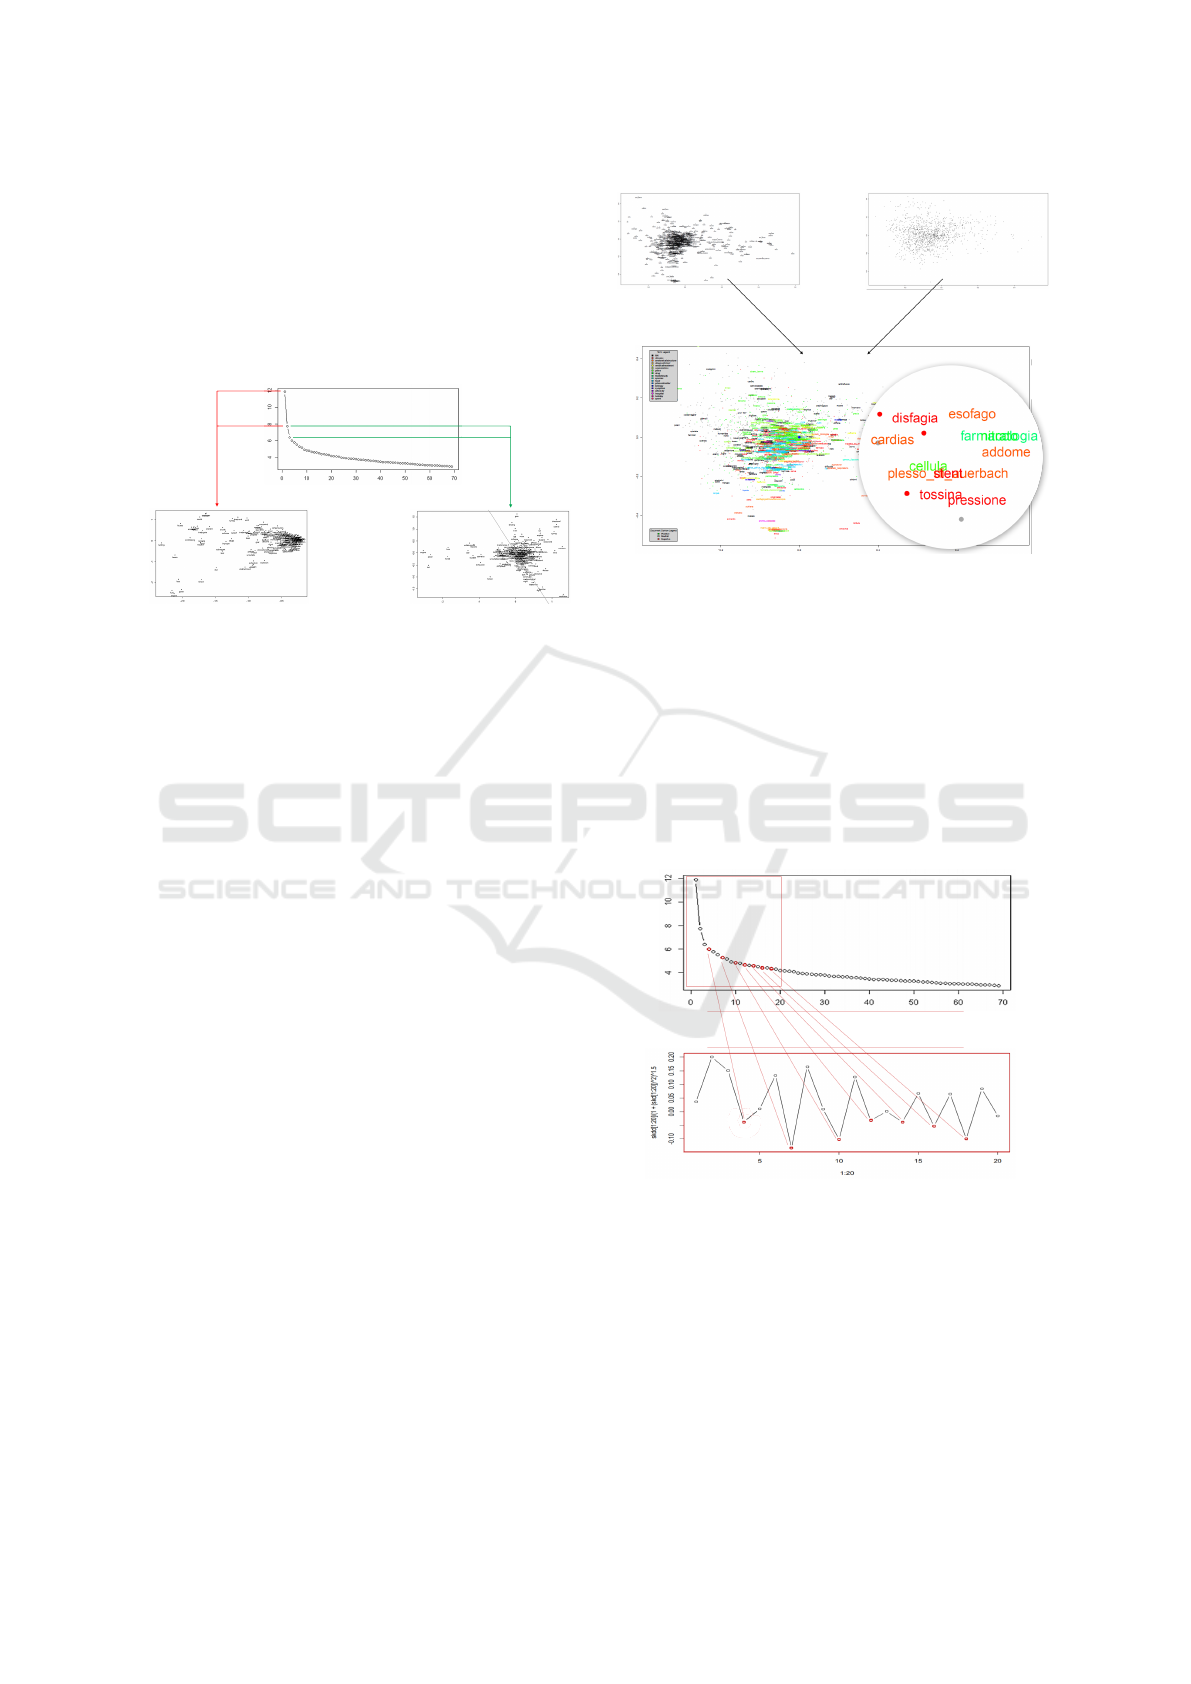
Figure 2: 2D visualization of the latent semantic space,
starting from the power law curve obtained after the SVD
decomposition (LSA). In the first case (dimensions 1 and
2), the resulting terms distribution is not satisfactory and
takes the form of an ellipsoid. In the second case (dimen-
sions 2 and 3), the distribution is less concentrated and con-
sequently it is better for visual observations.
The cosine similarity allows the visual recognition
of semantically related terms and documents. The
more a pair of terms forms a small angle with the
origin, the greater the similarity between them (i.e.,
they often appear together in documents and so are
frequently associated). However, having compressed
an originally high-dimensional space into only two di-
mensions, close terms in the graph may not necessar-
ily be such (approximation).
A complete graph of the latent space can be ob-
tained by considering the overlapping representation
of normalized terms and documents (Figure 3). In or-
der to better understand the distribution of vectors in
space and the quality of the correlations, terms and
documents can be colored according to their class.
3.1.9 Selection of the Number of Dimensions
If the use of only two dimensions is suitable for visu-
alization purposes, in the rest of the analysis it could
involve a significant loss of information. After ap-
plying the decomposition by choosing a number of
dimensions k for the new space, a further reduction
in dimensionality can be made to lighten the com-
putational load required by the subsequent analytical
phases. To decide an optimal value of the number of
dimensions to use, it is possible to analyze the de-
scending sequence of singular values to search for a
knee point in the progression. This can be done both
Figure 3: Graph of the latent semantic space with normal-
ized and overlapping terms and documents.
visually and formally. In fact, a knee point is a point
where the radius of the curvature of the function that
interpolates the hyperbola corresponds to a local min-
imum. Considering that the curvature of a function
y = f (x) is c = y
00
/(1 + (y
0
)
2
)
3/2
, a valid number of
dimensions can therefore coincide with one of its lo-
cal minima (Figure 4). The idea is that the informa-
tive contribution given by the dimensions associated
with the eigenvalues that follow a knee point is lower,
making an approximation possible.
Figure 4: Selection of the number of dimensions in LSA,
through the search for knee points in the curvature function
given by the sequence of singular values.
In general it is advisable to perform tests with
multiple minimums to choose the potentially optimal
one. A way to conduct these tests is to verify the
consistency with respect to a particular query of the
first N documents semantically most similar to it, and
so the semantic precision of the query itself (as bet-
ter explained in Section 3.1.11). Since SVD (and
DATA 2020 - 9th International Conference on Data Science, Technology and Applications
126

so LSA) is based on co-occurrences, it is important
to note that during these checks, real positives docu-
ments (i.e., actually related to the query) may be listed
though these do not directly contain the query term(s).
This could not happen with a Boolean research model
based on lexical (and not semantic) matches.
3.1.10 Qualitative Analysis of the Graph
In the case of uniform distribution, imagining to di-
vide the space into quadrants, a quantity of documents
proportional to the original one should be found for
each class. The areas of the space outlined by the LM
in which there are unexpected concentrations (differ-
ent from those foreseen in the case of random dis-
tribution), indicate the presence of elements of inter-
est for the analysis (Figure 5). By researching which
terms are found in these areas, it is possible to inter-
pret them to identify the causes that contribute to the
phenomenon. This phase of the methodology there-
fore has the aim of recognizing the possible presence
of areas to be investigated.
Figure 5: Example of unusual concentration of documents
belonging to a certain class, in the 2D representation of the
latent semantic space.
3.1.11 Description Construction
In this last phase, the methodology foresees to calcu-
late the correlations between terms and terms, docu-
ments and documents, and terms and documents. The
original paper with which LSA was introduced (Lan-
dauer and Dumais, 1997) focuses on the application
of SVD and on the general use of cosine similarities,
but neither describes nor offers solutions to the vari-
ous types of correlations. We therefore introduce an
expansion of LSA operations with those necessary for
the objective of the research.
Within the reconstructed term-documents matrix
C
k
(Equation 2), the semantic similarities between
the pairs of terms or documents are measured with
the cosine of the respective scalar products (C
k
C
T
k
=
U
k
Σ
2
k
U
T
k
= (U
k
Σ
k
)(U
k
Σ
k
)
T
or C
T
k
C
k
= V
k
Σ
2
k
V
T
k
=
(V
k
Σ
k
)(V
k
Σ
k
)
T
) and the specific instances of U
k
or V
k
.
We argue that one of the most interesting features of
LSA is the ability to fold-in
2
new documents, realiz-
ing the transposition of queries in the latent seman-
tic space. A query q is equivalent to a set of terms
in C (pseudo-document vector). It must undergo the
same preliminary transformations that the cell entries
of C received before the SVD application. Transform-
ing a query vector q in a new document q
k
means
transforming it into a row of the matrix V
k
. Since
V = C
T
UΣ
−1
, it follows that q
k
= q
T
U
k
Σ
−1
k
. The
position of the query in the latent semantic space is
given by q
T
UΣ
−1
Σ = q
T
U. Table 1 summarizes the
equations for calculating the similarities between the
vectors in the transformed space.
Table 1: Similarities between terms (u), documents (v) and
queries (q) in the latent semantic space.
v
i
and v
j
cos(v
i
Σ
k
,v
j
Σ
k
)
u
i
and u
j
cos(u
i
Σ
k
,u
j
Σ
k
)
q and v
j
cos(q
T
U
k
,v
j
Σ
k
)
u
i
and v
j
cos(u
i
Σ
1/2
k
,Σ
1/2
k
v
j
)
u
i
and q cos(u
i
Σ
1/2
k
,Σ
−1/2
k
U
T
k
q)
By following the original operations explained be-
low, it is possible to construct a probabilistic descrip-
tion (step by step) for the phenomenon we have cho-
sen to analyze. In particular, the resulting description
will consist of a query (set of terms) that best char-
acterize the distribution of the class representing the
phenomenon in the latent semantic space.
First, the most representative term must be visu-
ally identified in the area highlighted in the previous
stage. In doing this, it is necessary to focus on the
terms placed in a central position within the area it-
self and at a greater distance from the origin (with a
high norm and so a high relevance). The selected term
can be seen as the first one of the descriptive query.
In order to mathematically demonstrate the corre-
lation between the query q and the class c (represent-
ing the phenomenon), the chi-squared (χ
2
) test can be
used in conjunction with R-precision (Equation 5). To
give the query the possibility of retrieving all the doc-
uments to which it refers, R is set equal to the number
of instances of class c.
χ
2
(D,q, c) =
∑
e
q
∈{0,1}
∑
e
c
∈{0,1}
(N
e
q
e
c
− E
e
q
e
c
)
2
E
e
q
e
c
(5)
where:
D = corpus (repository of documents)
q = query
c = class
2
Folding is the process of adding new vectors to a space
after its construction, without rebuilding it.
Learning Interpretable and Statistically Significant Knowledge from Unlabeled Corpora of Social Text Messages: A Novel Methodology of
Descriptive Text Mining
127

e
q
= p-a in the top-R identified by q
e
c
= p-a of the class
N
e
q
e
c
= documents number observed with e
t
and e
c
E
e
q
e
c
= documents number expected with e
t
and e
c
While the number of documents observed is di-
rectly reflected in the data, the expected frequencies
are calculated as E
e
q
e
c
= |D| · P(t) · P(c). For exam-
ple, E
11
= |D| · ((N
11
+ N
10
)/|D|)·((N
11
+ N
01
)/|D|).
The higher χ
2
, the lower the probability that the
hypothesis of independence between q and c holds.
Therefore, to obtain the level of statistical signif-
icance associated with the description of the phe-
nomenon (for which only LSA is not enough), we
consider the p-value obtainable from the χ
2
distribu-
tion table between q and c with a degree of freedom.
To establish whether the null hypothesis is re-
jected or not, a p-value threshold must be set. In the
case of statistical dependence, let n
c
be the number of
documents belonging to class c in top-R and |c| the
number of instances of class c (used as R-precision),
it is possible to say that the query characterizes a num-
ber of instances related to the phenomenon being de-
scribed equal to n
c
/|c| · 100, with a probability corre-
sponding to the p-value for the calculated χ
2
.
After having verified with a formal approach the
relevance of the term chosen for the class associated
with the unusual concentration, it is possible to pro-
ceed with the extension of the description. The analy-
sis therefore continues with the search for terms clos-
est to the query. Among the terms with higher sim-
ilarity, we choose the most significant one that also
has a high norm and we insert it as a second ele-
ment in q. Like before, the chi-squared test is rerun to
verify the correlation between the new query and the
class of interest. The process is repeated iteratively,
as long as the confidence indicated by the p-value
does not fall below a certain threshold. By alternating
searches for query-terms and query-documents corre-
lations, the proposed approach makes the description
of the phenomenon progressively more specific. Once
the analysis is complete, the methodology returns a
set of terms that has not a sentence structure but is of-
ten easily interpretable. Figure 6 shows an example.
3.1.12 Evaluation
There are several ways to evaluate the correctness of
the results produced by the methodology in its var-
ious parts. The description of the phenomenon can
be interpreted and compared to existing scientific re-
ports or data. As regards the correlations between
concepts as a whole, a manual judgment can be ap-
plied to clusters of similar terms in the transformed
space. Under this point of view, we suggest a more
Figure 6: Example of description construction. At each step
the query is enriched with a semantically close term, and the
correlation with the class tends to decrease.
formal approach based on the definition of a file con-
taining a set of gold standards (i.e., positive and nega-
tive known correlations expressed by an expert user).
It can be made up of elements having a structure of
this type: x
1
,. .. ,x
n
↔ y
1
,. .. ,y
m
. An example of pos-
itive correlation (known in the literature for its truth)
is alcohol ↔ GERD. Vice versa, an example of nega-
tive correlation (known in the literature for its falsity)
is lung ↔ gastroenterology. Consequently, each cor-
relation generally involves two fictitious documents
(sets of terms). The effectiveness of the model can
be proven with the same theoretical framework il-
lustrated in Section 3.1.11 (i.e., by applying the chi-
squared test between the two queries involved in each
known correlation and verifying that the resulting p-
value is below a certain threshold for positive exam-
ples and above for negative ones). This allows the
creation of a confusion matrix and the calculation of
several metrics.
3.2 Automatic Knowledge Extraction
This section describes a possible solution to fully au-
tomate the execution of the presented methodology.
3.2.1 Dimensionality Calibration
The choice of the number of dimensions to work with
concerns both the transformed space generated by the
language model (Section 3.1.7) and the reduction of
dimensionality aimed at lightening the computational
load (Section 3.1.9). Making this decision according
to the domain is not always easy, and for automation
purposes it cannot be standardized for all application
cases. We propose a solution focused on the reuse
of gold standards as training set. The idea is to iter-
ate over the two parameters, make multiple attempts
and choose the pair of values that most bring out the
known correlations (e.g., best ratio between True Pos-
itive Rate and False Positive Rate). This mechanism
DATA 2020 - 9th International Conference on Data Science, Technology and Applications
128

emulates that of back-propagation. Some known facts
can be used for calibration, while the rest as tests
(also with k-fold cross validation).
3.2.2 Starting Query
Within a latent semantic space, there may be multi-
ple areas of concentration (with non-random distribu-
tions) linked to the documents of the class of inter-
est, and not necessarily just one. A way to solve the
problem in an automated context is to ask the user
to indicate a starting query, thus identifying the point
of the space from which to proceed with the analy-
sis (enriching the provided description with other sta-
tistically significant terms, if possible). In a medical
domain, for example, this query can express personal
information that you want to take into account (such
as symptoms and performed medical treatments).
3.2.3 First Term Selection
If a user-specified starting query is not available, the
automated version of the methodology must still be
able to manage the choice of the initial term. This task
can be solved by considering all the terms with norm
higher than a certain threshold, and applying the chi-
squared test on them in order to calculate their corre-
lation with the class. The term chosen is the one with
minimum p-value and highest norm. The risk linked
to the automation of this phase is the choice of a term
that is not particularly interesting or significant. In
this regard, a valid preprocessing is fundamental.
3.2.4 Choice of the Next Term
Another aspect that needs to be automated concerns
the choice of the term with which to enrich the de-
scription at each step. This can be done by search-
ing for the N terms semantically closest to the current
query, but in any case respecting a minimum cosine
similarity threshold. Among them, the term used to
extend the query is the one with the highest norm, ca-
pable of reaching a description with a sufficiently low
p-value.
3.3 Considerations
A relevant strength of the proposed methodology lies
in its flexibility. Some of the phases of which it is
composed can be seen as modules, independent of
the particular implementation (which therefore can be
adapted to the application scenario or compared to al-
ternative solutions). Furthermore, the methodology
produces a global explanation of the phenomenon
and extracts correlations between various concepts
without using domain-dependent dictionaries or re-
sources. This last feature also allows the inference of
new knowledge (i.e., previously unknown correlations
with high statistical significance). Gold standards are
required only for evaluation purposes, or as possible
semantic-based solution to the automatic choice of the
optimal number of dimensions to work with. How-
ever, the calibration phase is not essential and could
for example be replaced with the use of heuristics and
with the adoption of the first minimum in the curva-
ture function. In any case, the amount of data required
is minimal and inexpensive to produce compared to
that frequently needed by other solutions.
4 CASE STUDY
This section shows the application of the contri-
butions to a case study of conversational mes-
sages (Domeniconi et al., 2016b) in the medical field,
specifically focused on the domain of rare diseases.
Experiments are conducted on unlabeled conversa-
tional posts about a rare disorder, called “Esophageal
Achalasia”. A descriptive text mining analysis is per-
formed with the aim of collecting useful information
to improve patients’ living conditions.
4.1 Esophageal Achalasia Overview
Idiopathic Achalasia (ORPHA:930) is a rare disorder
of the esophagus, with a prevalence rate estimated to
be 1/10,000 (Patel and Vaezi, 2014). It is character-
ized by an impaired ability to push food down to-
ward the stomach (peristalsis), due to the failure of
the lower esophageal sphincter (LES) to relax.
4.2 Dataset
The dataset was built with the collaboration of As-
sociazione Malati Acalasia Esofagea (AMAE) On-
lus
34
, the main Italian patient organization for the
disease under consideration. In particular, we used
the Facebook Group directly managed by AMAE,
named Acalasia esofagea... I malati “rari” non
sono soli...!
5
. It has been collecting data since 2008
and currently has around 2000 users (mainly pa-
tients, caregivers and doctors). Using the Facebook
Graph API
6
, data were downloaded for 6,917 posts
3
http://www.amae.it/
4
https://www.orpha.net/consor/cgi-bin/SupportGroup
Search.php?lng=EN&data id=106412
5
https://www.facebook.com/groups/36705181245/
6
https://developers.facebook.com/docs/graph-api/
Learning Interpretable and Statistically Significant Knowledge from Unlabeled Corpora of Social Text Messages: A Novel Methodology of
Descriptive Text Mining
129

and 61,692 first-level comments, published between
21/02/2009 and 05/08/2019. The private nature of
the group further improved the quality of the dataset,
strongly limiting the presence of fake news and harm-
ful content for other patients.
4.3 Methodology Implementation
The implementation of the methodology for the case
study perfectly follows the steps described in Sec-
tion 3, and is realized with a combined use of R and
Python (through reticulate package).
To cope with typical text distortions in social con-
texts, the quality preprocessing pipeline includes op-
erations such as emotes normalization, word length-
ening fixing and Internet slang translation. In this first
work NER and lemmatization were not used.
A common need among patients is to know
whether other users’ thoughts on a certain topic are
positive or negative, and why. In this case, therefore,
the classification corresponds to an opinion mining
task. To estimate the opinion score associated with
each document, we made use of a very simple algo-
rithm based on opinion words count: words known for
their semantic expression of polarity (Liu and Zhang,
2012). In particular, we used the opinion lexicon pub-
lished by Hu and Liu
7
(containing 6800 positive and
negative words), appropriately translated into Italian
to manage the language mismatch. The specificity of
the case study also made it appropriate to insert ad-
ditional opinion words, both positive (e.g., “reborn”)
and negative (e.g., “reflux”, “regurgitation”). The
score is calculated according to Equation 6.
score(d) = nMatches(d, pos words)−
nMatches(d,neg words)
(6)
4.4 Experiments
To survey the usefulness of the methodology (in its
fully-automatic version) and the discovered knowl-
edge in the context of the case study, we made two
types of experiments. Firstly, through local analyzes,
we investigated the reasons behind the positive and
negative opinions on the two main surgical treatments
for Achalasia: Heller-Dor and POEM. Secondly, we
assessed the quality of the correlations obtainable
with a global analysis on all documents. To consol-
idate the effectiveness of the contribution in quanti-
fying the truth value of the identifiable correlations,
gold standards were used (as indicated in Section
3.1.12). The structure of the latter is shown below,
together with the results of the two experiments.
7
https://www.cs.uic.edu/
∼
liub/FBS/sentiment-analysis.
html#lexicon
4.4.1 Achalasia Gold Standards
The set of gold standards created consists of 120 pos-
itive correlations (i.e., true positive) and 104 negative
ones (i.e., true negative). The ability to recognize
correlations between various types of concepts was
tested by dividing known facts into several categories:
food ↔ symptom, symtpom ↔ drug, symtpom ↔
anatomical structure, drug ↔ drug class, place ↔
doctor, etc. Depending on the topic, their definition
was made by domain experts, who accompanied their
facts with scientific sources.
4.4.2 Results
Interpreting the explanations returned by the local an-
alyzes (Table 2), it can be appreciated how the names
of the main doctors and expert centres (positive po-
larity), as well as the problems known in the literature
for the treatments considered (negative polarity) have
been identified with p-value < 0.01 (χ
2
test).
Table 2: Translated explanations returned by the method-
ology for positive and negative opinions about Achalasia
treatments.
Pos Explanation Neg Explanation
Heller-Dor
equipe, dr,
mario, costantini,
salvador, padua,
antireflux, plastic
problems,
drink, eat
POEM
rome, prof, gemelli,
costamagna,
equipe, familiari,
lombardy
reflux, problems,
liquid, pain,
inflammation,
antacids
Table 3, on the other hand, shows the quality of the
correlations extracted in the global analysis through
the application of several statistical indices.
The underlying confusion matrix is constructed as
follows.
• TP, number of known positive correlations identi-
fied (e.g., dysphagia ↔ swallowing).
• TN, number of known negative correlations iden-
tified (e.g., stomach ↔ tachycardia).
• FP, true negative correlations that the method in-
correctly considers above the acceptance thresh-
old, and therefore as positive.
• FN, false negative correlations that the method in-
correctly considers below the acceptance thresh-
old, and therefore as negative.
From the results it is possible to observe how the
choice of dimensionality through a calibration phase
leads to better results (albeit slight). In this case, the
methodology allows to obtain ≈ 78% accuracy.
DATA 2020 - 9th International Conference on Data Science, Technology and Applications
130

Table 3: Comparison of confusion matrices and relative statistical indices obtained with and without the calibration phase
based on gold standards, using three different acceptance thresholds. ACC = Accuracy, PRE = Precision, MR = Misclassifi-
cationRate, TPR = TruePositiveRate, TNR = TrueNegativeRate, FPR = FalsePositiveRate, FNR = FalseNegativeRate.
Confusion Matrix Statistical Indices
Solution
P-value
Threshold
TP TN FP FN ACC PRE MR TPR TNR FPR FNR
With Calibration
k = 100, min = 6
0.7 101 68 36 19 75.45 73.72 24.55 84.17 65.38 34.62 15.83
0.8 96 78 26 24 77.68 78.69 22.32 80.00 75.00 21.31 20.00
0.9 72 98 6 48 75.89 92.31 24.11 60.00 94.23 5.77 40.00
Without Calibration
k = 969, min = 4
0.7 99 67 37 21 74.11 72.79 25.89 82.5 64.42 35.58 17.50
0.8 94 78 26 26 76.79 78.33 23.21 78.33 75.00 25.00 21.67
0.9 71 97 7 49 75.00 91.03 25.00 59.17 93.27 6.73 40.83
5 CONCLUSIONS
We proposed a general and unsupervised methodol-
ogy of descriptive text mining, capable of working
with unlabeled data and accompanying the results
with accurate probabilistic information. By model-
ing terms and documents together in a latent semantic
space, we used a personal expansion of LSA to iden-
tify global textual explanations of phenomena, ex-
tracting also correlations between concepts of various
kinds. We conducted experiments as part of a case
study focused on Esophageal Achalasia. Through
the discovery of statistically significant evidences, the
methodology allowed the identification of scientific
medical correlations directly from the patients’ posts.
The work can be extended in several directions:
the introduction of a NER system on the application
level increases the expressiveness of the results, more-
over a conditional GAN and/or the modeling of de-
pendencies between terms in space, allows the con-
struction of meaningful sentences. Pre-computing all
the correlations between pairs of terms, with p-values
below a certain threshold, helps patients to easily nav-
igate among the most significant knowledge. Modern
hierarchical clustering techniques, popular in many
other domains (Cerroni et al., 2015), can also be ap-
plied over the results, e.g. to automatically extract
semantically related terms. Transfer learning tech-
niques increasingly play a key role with unlabeled
data, from medical field (Domeniconi et al., 2014a;
Domeniconi et al., 2014b; Domeniconi et al., 2016a)
to NLP tasks such as opinion mining (Domeniconi
et al., 2017; Moro et al., 2018), which we intend
to deepen. The methodology can be applied on
other diseases or completely different domains and
languages, including the scientific medical literature.
We also plan to represent the extracted knowledge
by means of logic (Riccucci et al., 2007), knowl-
edge graphs and semantic web techniques (Carbonaro
et al., 2018), enabling reasoning.
ACKNOWLEDGMENTS
The research was developed starting from a university
lesson by Professor Gianluca Moro, who is the au-
thor of the core contribution. We would like to thank
Cristina Lanni
8
, University of Pavia, for participating
in the realization of the drug-related gold standards
due to her expertise in the pharmacological field. We
also thank Celeste Napolitano (President of AMAE
and National Secretary of the Italian Society of Nar-
rative Medicine), for her precious help in known cor-
relations about doctors and expert centres.
REFERENCES
Ahonen, H., Heinonen, O., Klemettinen, M., and Verkamo,
A. I. (1998). Applying data mining techniques for de-
scriptive phrase extraction in digital document collec-
tions. In IEEE ADL’98, pages 2–11.
Bojanowski, P., Grave, E., Joulin, A., and Mikolov, T.
(2017). Enriching word vectors with subword infor-
mation. Transactions of the Association for Computa-
tional Linguistics, 5:135–146.
Brinker, T. J., Hekler, A., Enk, A. H., Klode, J., Hauschild,
A., et al. (2019). Deep learning outperformed 136
of 157 dermatologists in a head-to-head dermoscopic
melanoma image classification task. European Jour-
nal of Cancer, 113:47–54.
Carbonaro, A., Piccinini, F., and Reda, R. (2018). Integrat-
ing heterogeneous data of healthcare devices to enable
domain data management. Journal of e-Learning and
Knowledge Society, 14(1).
Cerroni, W., Moro, G., Pasolini, R., and Ramilli, M. (2015).
Decentralized Detection of Network Attacks Through
P2P Data Clustering of SNMP Data. Computers &
Security, 52:1–16.
Devlin, J., Chang, M., Lee, K., and Toutanova, K. (2018).
BERT: pre-training of deep bidirectional transformers
for language understanding. CoRR, abs/1810.04805.
Domeniconi, G., Masseroli, M., Moro, G., and Pinoli, P.
(2014a). Discovering new gene functionalities from
8
https://www.researchgate.net/profile/Cristina Lanni/
research
Learning Interpretable and Statistically Significant Knowledge from Unlabeled Corpora of Social Text Messages: A Novel Methodology of
Descriptive Text Mining
131

random perturbations of known gene ontological an-
notations. In KDIR 2014 - Proceedings of the In-
ternational Conference on Knowledge Discovery and
Information Retrieval, Rome, Italy, pages 107–116.
SciTePress.
Domeniconi, G., Masseroli, M., Moro, G., and Pinoli, P.
(2016a). Cross-organism learning method to discover
new gene functionalities. Computer methods and pro-
grams in biomedicine, 126:20–34.
Domeniconi, G., Moro, G., Pagliarani, A., and Pasolini, R.
(2017). On deep learning in cross-domain sentiment
classification. In Proceedings of the 9th International
Joint Conference on Knowledge Discovery, Knowl-
edge Engineering and Knowledge Management - (Vol-
ume 1), Funchal, Madeira, Portugal, 2017, pages 50–
60. SciTePress.
Domeniconi, G., Moro, G., Pasolini, R., and Sartori, C.
(2014b). Iterative refining of category profiles for
nearest centroid cross-domain text classification. In
International Joint Conference on Knowledge Discov-
ery, Knowledge Engineering, and Knowledge Man-
agement, pages 50–67. Springer.
Domeniconi, G., Moro, G., Pasolini, R., and Sartori, C.
(2015). A Study on Term Weighting for Text Cate-
gorization: A Novel Supervised Variant of tf. idf. In
DATA, pages 26–37.
Domeniconi, G., Semertzidis, K., Lopez, V., Daly, E. M.,
Kotoulas, S., et al. (2016b). A novel method for
unsupervised and supervised conversational message
thread detection. In DATA, pages 43–54.
Fisher, M. J. and Marshall, A. P. (2009). Understand-
ing descriptive statistics. Australian Critical Care,
22(2):93–97.
Gunning, D. (2017). Explainable Artificial Intelligence
(XAI). Defense Advanced Research Projects Agency
(DARPA), nd Web, 2.
Halko, N., Martinsson, P.-G., and Tropp, J. A. (2011).
Finding structure with randomness: Probabilistic al-
gorithms for constructing approximate matrix decom-
positions. SIAM review, 53(2):217–288.
Jia, R. and Liang, P. (2017). Adversarial exam-
ples for evaluating reading comprehension systems.
arXiv:1707.07328.
Lan, Z., Chen, M., Goodman, S., Gimpel, K., Sharma,
P., et al. (2019). Albert: A lite bert for
self-supervised learning of language representations.
arXiv:1909.11942.
Landauer, T. K. and Dumais, S. T. (1997). A solution to
Plato’s problem: The latent semantic analysis theory
of acquisition, induction, and representation of knowl-
edge. Psychological review, 104(2):211.
Landauer, T. K., Foltz, P. W., and Laham, D. (1998). An in-
troduction to latent semantic analysis. Discourse pro-
cesses, 25(2-3):259–284.
Liu, B. and Zhang, L. (2012). A survey of opinion mining
and sentiment analysis. In Mining text data, pages
415–463. Springer.
Liu, H., Yin, Q., and Wang, W. Y. (2018). Towards explain-
able nlp: A generative explanation framework for text
classification. arXiv:1811.00196.
Maaten, L. v. d. and Hinton, G. (2008). Visualizing data
using t-SNE. Journal of machine learning research,
9(Nov):2579–2605.
Mathews, S. M. (2019). Explainable Artificial Intelli-
gence Applications in NLP, Biomedical, and Malware
Classification: A Literature Review. In Intelligent
Computing-Proc. of the Computing Conference.
Montavon, G., Samek, W., and M
¨
uller, K.-R. (2018). Meth-
ods for interpreting and understanding deep neural
networks. Digital Signal Processing, 73:1–15.
Moosavi-Dezfooli, S.-M., Fawzi, A., Fawzi, O., and
Frossard, P. (2017). Universal adversarial perturba-
tions. In CVPR, pages 1765–1773.
Moro, G., Pagliarani, A., Pasolini, R., and Sartori, C.
(2018). Cross-domain & in-domain sentiment anal-
ysis with memory-based deep neural networks. In
Proceedings of the 10th International Joint Confer-
ence on Knowledge Discovery, Knowledge Engineer-
ing and Knowledge Management, IC3K 2018, Volume
1: KDIR, Seville, Spain, 2018, pages 125–136.
Nassif, A. B., Shahin, I., Attili, I., Azzeh, M., and Shaalan,
K. (2019). Speech recognition using deep neural net-
works: A systematic review. IEEE Access, 7:19143–
19165.
Nguyen, A., Yosinski, J., and Clune, J. (2015). Deep neu-
ral networks are easily fooled: High confidence pre-
dictions for unrecognizable images. In CVPR, pages
427–436.
Pagliarani, A., Moro, G., Pasolini, R., and Domeniconi, G.
(2017). Transfer learning in sentiment classification
with deep neural networks. In Knowledge Discovery,
Knowledge Engineering and Knowledge Management
- 9th International Joint Conference, IC3K 2017, Fun-
chal, Madeira, Portugal, 2017, Revised Selected Pa-
pers, pages 3–25.
Papernot, N., McDaniel, P., Jha, S., Fredrikson, M., Celik,
Z. B., et al. (2016). The limitations of deep learning
in adversarial settings. In EuroS&P, pages 372–387.
Patel, D. and Vaezi, M. (2014). Idiopathic achala-
sia. https://www.orpha.net/consor/cgi-bin/OC
Exp.
php?lng=EN&Expert=930. Accessed 6 Apr 2020.
Reimers, N. and Gurevych, I. (2019). Sentence-bert:
Sentence embeddings using siamese bert-networks.
arXiv:1908.10084.
Riccucci, S., Carbonaro, A., and Casadei, G. (2007).
Knowledge acquisition in intelligent tutoring system:
A data mining approach. In Mexican International
Conference on Artificial Intelligence, pages 1195–
1205. Springer.
Safavian, S. R. and Landgrebe, D. A. (1991). A survey
of decision tree classifier methodology. IEEE Trans.
Systems, Man, and Cybernetics, 21:660–674.
Weiss, S. M., Indurkhya, N., and Zhang, T. (2015). Funda-
mentals of predictive text mining. Springer.
DATA 2020 - 9th International Conference on Data Science, Technology and Applications
132
