
Pattern Detection based Network Diagnostics
Martin Holkovi
ˇ
c, Michal Bohu
ˇ
s and Ond
ˇ
rej Ry
ˇ
sav
´
y
Faculty of Information Technology, Brno University of Technology, Bozetechova 1/2, 612 66 Brno, Czech Republic
Keywords:
Network Diagnostics, Passive Diagnostics, Rule-based Diagnostics, Patterns Lookup, Patterns Diagnostics,
Anomaly-based Diagnostics.
Abstract:
One of the most important parts of the network administrators’ work is detecting and correcting errors inside
computer networks. This part is also called network diagnostics. The problem is that computer networks are
very complex, and there is no single universal approach for diagnosing the errors. In this paper, we propose
a new method of diagnostics which utilizes looking for specific patterns inside captured network data. This
approach automatically checks for all predefined patterns and generates a report with error descriptions for any
detected errors. We have created a proof-of-concept tool and demonstrated its functionality.
1 INTRODUCTION
Computer networks are complex difficult to manage
systems because they contain a large number of de-
vices of different kinds that use a large number of dif-
ferent services and protocols. To fix any error that has
occurred, it must be first identified and then correctly
analyzed (Roy et al., 2010). Unfortunately, finding
an error is not an easy task. Network administra-
tors regularly spend a significant amount of time net-
work troubleshooting (Zeng et al., 2012). Depend-
ing on the availability of the data, a diagnostic pro-
cedure can be done for the network traffic (Qadeer
et al., 2010), application logs (Qiu et al., 2010), Net-
flow records (Garcia-Teodoro et al., 2009), etc. In this
paper, we only consider network traffic, although the
proposed method can work with other types of data
sources.
An example of typical network issues is a prob-
lem with the DNS server resulting from a configu-
ration change. Because of backup servers, the error
may not immediately affect clients. One of the ways
to detect the problem is to monitor the reply statuses
of DNS queries from internal servers and determine
the amount of successful and error replies. If the ratio
between error and successful DNS replies increases
significantly, an administrator is notified about the
possible problem with the DNS server, e.g., the wrong
configuration was inserted.
Detection of a peak within network data is cur-
rently implemented in most monitoring systems pro-
viding simple but efficient identification of anoma-
lies. In this paper, we propose a system that can iden-
tify more complicated patterns in network data and
attribute them to different errors. The data consists
of a collection of timestamped events. For example,
the amount of transferred data in the last 5 minutes.
The proposed system analyzes the data and looks
for predefined patterns that represent the specific situ-
ation, e.g., drop of transfer rate. The pattern search
system uses simple descriptions of value changes,
which are easily understandable by network admin-
istrators. An example of a pattern is a rapid drop fol-
lowed by a sharp increase, which can be seen as a
V-shape in the traffic graph. Administrators mostly
use this form of visual analysis to get an overview of
network status or to observe specific host behavior.
This paper’s contribution is an automatic diagnos-
tic of network problems by looking for patterns within
timestamped events drawn from network traffic data.
The method implemented in a proof-of-concept tool
is demonstrated on data extracted from packet cap-
tures. However, the approach can also be applied to
other suitable data sources, e.g., NetFlow data, logs,
event files.
The structure of the paper is organized as follows.
Section 2 discusses related work and describes similar
approaches. Section 3 describes how the tool will be
used. Section 4 describes the architecture of the pro-
posed tool. Section 5 provides a simple tool usage
demonstration. Finally, Section 7 contains the con-
clusion which summarizes the current state and pro-
poses future work.
Holkovi
ˇ
c, M., Bohuš, M. and Ryšavý, O.
Pattern Detection based Network Diagnostics.
DOI: 10.5220/0009891500350042
In Proceedings of the 17th International Joint Conference on e-Business and Telecommunications (ICETE 2020) - DCNET, OPTICS, SIGMAP and WINSYS, pages 35-42
ISBN: 978-989-758-445-9
Copyright
c
2020 by SCITEPRESS – Science and Technology Publications, Lda. All rights reserved
35

2 RELATED WORK
There are many ways to diagnose network errors.
For maximum flexibility, it is necessary to be able
to diagnose errors across TCP/IP layers (łgorzata
Steinder and Sethi, 2004). In literature, this process
is often referenced by authors as a root-cause analy-
sis (RCA) (Sol
´
e et al., 2017). Although there is no
standardized classification of diagnostic approaches,
the most basic and well-known classes are determin-
istic and probabilistic (Sol
´
e et al., 2017).
One of the most common ways to diag-
nose network problems is by using the Wireshark
tool (Ndatinya et al., 2015). However, Wireshark
lacks any built-in automation, and therefore, efforts
have been made to automate the work with this tool.
One such tool implements decision trees that work
with rules and exact matches similarly to the IDS sys-
tems (Holkovi
ˇ
c and Ry
ˇ
sav
´
y, 2019).
Our diagnostic approach, which consists
of searching for patterns in data, is more similar
to anomaly detection techniques. Anomaly detection
is a search for situations when data are outside
of the usual or expected value range (Chandola et al.,
2009). As Martinez states in his work (Martinez et al.,
2015), anomaly detection techniques can also be used
for diagnostics purposes. An example is a solution
that uses a neural network that learns anomalies and
associated errors (Katasev and Kataseva, 2016). A
similar approach was presented by (Ben Kraiem
et al., 2019), they are also looking for patterns inside
time-series. However, the patterns are limited to a
single data series and a relationship between only one
point and its directly adjacent points.
Similarly to diagnostics, the detection of anoma-
lies is divided into classes, and the names and types
of these differ in different literature sources. Com-
pared to the diagnostics description, the closest clas-
sification is the anomaly (probabilistic) and signature
(deterministic) class (Bhuyan et al., 2013; Kruegel
and Toth, 2003; Sekar et al., 2002). Another possible
classification is statistical, knowledge-based, and ma-
chine learning (Garcia-Teodoro et al., 2009).
Several approaches to analyze the network data,
which are also usable for network diagnostics exist,
for instance:
• Intrusion Detection System (IDS) (Lee et al.,
2005) Snort (Roesch et al., 1999; Li et al., 2015)
or Bro (Udd et al., 2016) - they are looking for
an exact match in transferred network data. These
tools miss some diagnostic information.
• Prudence (Prayote and Compton, 2006) - a sys-
tem which automatically learns the range of sev-
eral network attributes and checks whether
the current amount exceeds the ones in the learned
model. This solution has a drawback that it is
not able to detect anomalies for data traffic inside
the learned ranges.
• Entropy (Gu et al., 2005) - the detection method
uses maximum entropy technique to compare ac-
tual traffic with created baselines.
• Signal Processing (Barford et al., 2002) - the data
are split into several signals which are processed
by special algorithms. The output from these
techniques is hardly understandable by a regular
network administrator.
• Outliers (Hodge and Austin, 2004) - These tech-
niques look for variations in data. Part of the
techniques deals with the detection of variations
in graphs (Akoglu et al., 2015). These techniques
use artificial intelligence (Rudrusamy et al., 2003)
that makes the explanation of the diagnosed faults
more complicated.
3 TOOL USAGE DESCRIPTION
Before describing the tool’s architecture, we will de-
scribe how the tool will be deployed, how administra-
tors will use it, and what kind of results the network
administrator can expect from it. Further, this section
describes which types of errors the tool can detect and
the associated types of patterns.
The tool will not analyze traffic online but will
work with captured PCAP files. When diagnosing a
network problem, the administrator needs to capture
the selected (problematic) network traffic and pro-
vides it as a PCAP file to the created tool. This im-
plies that the tool will not perform all-time monitoring
and that it will not be necessary to analyze full traffic
across the network.
normal state error state
amount of correct and error DNS replies
Figure 1: The figure illustrates how the problem with the
DNS server configuration can be detected based on the net-
work traffic visualization.
The tool’s goal is to search for predefined patterns
in selected packets in the specified PCAP file based
on configuration files. Each such pattern is associ-
ated with a specific error in which the pattern occurs.
DCNET 2020 - 11th International Conference on Data Communication Networking
36

data preprocessing per packet processing after all packets are processed
PCAP
Packet
Iterator
Interval
Assignment
Field Value
Extraction
Value
Aggregation
Calculation and
abstraction of
output values
Patterns
Detection
diagnostic
output
JSON
{ }
.. .
Input data
preparation
Figure 2: The architecture of the proposed tool, which consists of seven stages separated into three phases. The first phase
prepares the input data, the second phase processes packets one by one, and the last phase begins when there are no more
packets to process.
An example is an error with the DNS server settings,
as mentioned in the introduction. A configuration er-
ror changes the ratio of correct and incorrect DNS re-
sponses. This example is shown in Figure 1.
The tool output will consist of detected patterns
together with descriptions of detected errors to which
the patterns relate. The detected pattern will also be
drawn as an image file by the Linux GNUplot tool.
Using these images, the administrator can easily iden-
tify whether it is a correct detection or a false positive.
The system will be able to detect two types of
patterns - single and double. Simple patterns are
searched in a single data series to detect fluctuations
of values. For example, it is possible to detect in-
correctly set QoS for a multimedia application or a
significant increase in the average RTT value for the
monitored server. Patterns will check whether the
value decreases, increases, or stays the same.
The second type of pattern is double, which is
searched for in two data series, analyzing the rela-
tionship between values from those series. It checks
whether the value from one series is higher, less, or
equal to the second series’s value. With these patterns,
it is possible to detect errors such as an increased rate
of application errors or a non-functional load balance
between two links to the Internet.
4 SYSTEM ARCHITECTURE
We have designed the tool as a single-thread appli-
cation that consists of several parts. It is possible to
implement the tool more efficiently as a multi-thread
application executing several parts in parallel, but our
tool is just a proof-of-concept of the proposed ap-
proach. The proposed system is displayed in Figure 2,
and consists of seven stages, an input PCAP file and a
configuration file.
The configuration file instructs the system which
patterns should be detected. If more than one con-
figuration file is specified, each configuration file is
processed individually. There is only one excep-
tion, during the processing of the first configuration
file, transferred data from the first stage is saved into
the memory, so in the next configurations, this stage
does not need to be executed. Configuration files use
the YAML format, which is easily understandable by
real users and also easily processed by computer pro-
grams.
4.1 Input Data Preparation
The first part of the tool prepares the input data for
further processing. It begins with loading and pars-
ing the PCAP file. This allowed us to use an al-
ready existing external tool called TShark. TShark
is a command-line version of a well-known network
management tool Wireshark which takes a PCAP file
and converts it into the JSON format. The already
implemented tool eliminates the need for implement-
ing custom protocol parsers. TShark already supports
hundreds of protocols, even if they are tunneled or
segmented.
Another benefit of using TShark is that JSON out-
put from the tool is marked by the Wireshark display
language
1
. We have decided to use the Wireshark dis-
play language inside configuration files (specifically
the inputs section). This well-known language will
allow a better understanding of the configuration files
by network administrators.
4.2 Interval Assignment
The X-axis of each chart represents the relative time
when the packets were captured inside the input
PCAP file. The time is represented by time inter-
vals, where multiple values within one interval are
processed in later stages, aggregated and represented
by a single value.
The size of a time interval is specified in the con-
fig files in the section interval and has the format
"interval: value in milliseconds". It is up
to the user to specify an interval adequately to the
amount of data inside the input file so that the out-
put chart will contain enough data to visualize a chart,
and it will be possible to detect patterns in the chart.
During the processing of individual packets, the
system calculates into which time interval the packets
belong based on the field name frame.time relative.
1
https://www.wireshark.org/docs/dfref/
Pattern Detection based Network Diagnostics
37

The frame.time relative value represents the number
of seconds (with a microseconds accuracy) since the
first packet inside the PCAP file was captured.
4.3 Field Value Extraction
The generated chart can be constructed from multi-
ple values located in the source file, called the input
series. For example, we may want to display the num-
ber of transferred bytes and the number of transferred
packets. All input series need to be specified in the
input configuration section.
The format of an input value is "input name:
aggregation function (field name
filter condition)", where:
• input name - a user-defined name of the input se-
ries;
• aggregation function - name of the aggregation
function. The functionality is described in the
following subsection. The possible functions are:
MIN, MAX, AVG, COUNT, SUM, UNIQUE;
• field name - field name from the Wireshark dis-
play language;
• filter condition - an optional argument which con-
sists of a comparator (==, ! =, <, <=, >, >=)
and a constant value (number or string).
The value is added to the list of values assigned to
the calculated interval, only if the packet contains the
specified field name and fulfills the filter condition.
For example, if we would like to count only DNS
packets with the domain name server.local, we would
use COUNT(dns.qry.name == "server.local").
4.4 Value Aggregation
After all packets are assigned into time intervals and
their values are extracted, the system executes the ag-
gregation function over all intervals and their values.
The goal of the aggregation function is to replace a list
of values with a single numeric value. For example,
when an aggregation function SUM() is specified, the
system iterates over the intervals and for each interval
calculates a summary of the specified field name val-
ues. In case the interval does not contain any packets,
the aggregated value is 0.
The process of interval assignment, field value ex-
traction, and value aggregation is displayed in Fig-
ure 3. The packets from the input PCAP file are in the
same order as they were saved in the PCAP file. The
result is a list of aggregated values, however in case of
the config file exports and aggregates multiple values
at once, the result will consist of multiple lists.
time
intervals
packets from input
aggregated values
Figure 3: The figure shows how aggregation works. Packets
from the input are grouped based on the time intervals, and
an aggregation function is executed over each interval. The
aggregation function returns a single numeric value.
4.5 Calculation and Abstraction of
Output Values
A chart generated by the tool can be generated di-
rectly from the input series’s values, or it is possible
to calculate a series of new (output) values from mul-
tiple input series. For example, if we have one series
containing HTTP bytes and another one containing
HTTPS bytes, it can make sense to draw a chart as a
summary of the two series. The output section of the
configuration file specifies how the data is generated.
The section output contains a list of unnamed el-
ements that can contain any name of the input se-
ries, mathematical operation +, −,∗,/, and parenthe-
ses (,). The output values are calculated based on
input series values and a specified formula for each
time interval separately.
The system is not searching for patterns in numer-
ical values. The numerical values are abstracted by
an alphabet character according to the type of patterns
we are looking for. Two types of patterns exist:
• Simple - patterns are evaluated based on a sin-
gle output series only. There are five possible
characters which describe original numerical val-
ues. The selected percentage levels were selected
based on testing, and their purpose is to ensure
that the detection does not depend on exact val-
ues, but allow minor variations.
– c - constant - this value is used when the next
value is the same as the previous value or within
the range of < 80%; 120% > of the previous
value;
– r - raise - the new value is larger, in the range
of < 120%; 140% > of the previous value;
– f - fall - the new value is smaller, in the range of
< 60%; 80% > of the previous value;
– R - rapid raise - the new value is significantly
larger, in the range of < 140%; ∞% >;
DCNET 2020 - 11th International Conference on Data Communication Networking
38
– F - rapid fall - the new value is significantly
smaller, in the range of < 0%;60% >;
• Double - patterns are evaluated based on two dif-
ferent output series. There are three possible char-
acters for them: a (above), u (under), s (same)
describing that the first numerical value is larger
(graphically above), smaller (graphically below)
or approximately same (there is some tolerance)
with comparison to the second numerical value.
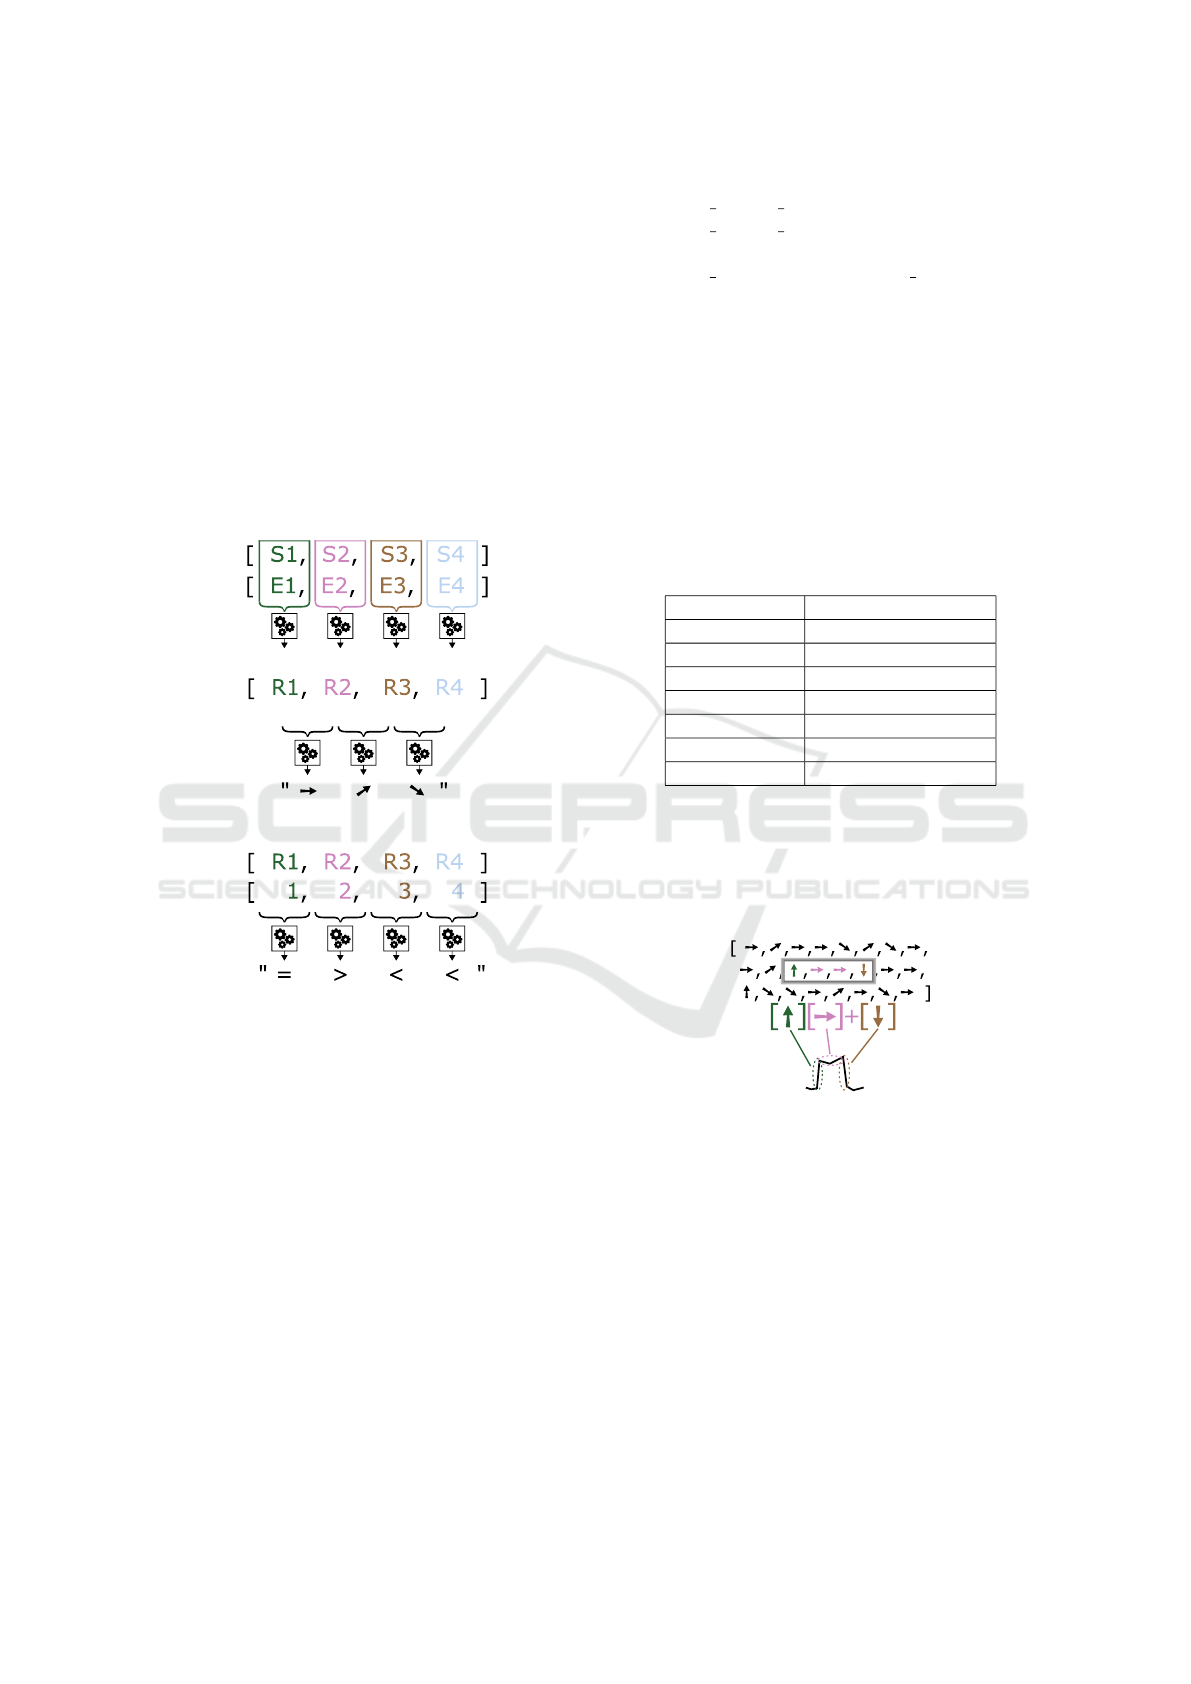
At the end of the abstraction process, each output
series will be represented by a single string with spe-
cific alphabet characters. This process of output value
calculation and abstraction is displayed in Figure 4.
values of input series
a) variant for simple patterns:
string with abstracted values
output series with numerical values
b) variant for double patterns:
Q Q Q Q
string with abstracted values
Figure 4: The figure shows the idea of calculating the nu-
merical values of the output series and abstracting them into
a string format. Two possible patterns are displayed - sim-
ple and double. In this figure, the string alphabet is replaced
by arrows and comparator symbols for easy understanding.
4.6 Pattern Detection
The pattern lookup process is implemented as an
evaluation of regular expressions over output series,
which have a regular string format. The patterns are
specified in the section patterns, and their format de-
pends on whether we are working with a simple chart
or a double chart:
• Simple - the format is "patterns: pattern1,
pattern2, ...". The table 1 lists all of the pos-
sible pattern names together with their regular ex-
pression definitions.
• Double - the format is "patterns:
output series 1 RELATION X% of
output series 2". The X specifies the rate
between the two compared values. For example,
the dns error above 10% dns success rule is
looking for a situation when the amount of DNS
error packets will be at least 10% higher than the
success DNS packets. The relation can have one
of the following values:
– above - detects the situation when the output
series 1 is above the series 2;
– cross - detects the situation when the output se-
ries 1 crosses the series 2 in whatever direction.
– under - detects the situation when the output
series 1 is below the series 2;
Table 1: Possible simple patterns and their definition in a
regular expression format.
Pattern name Regular Expression
rapidly raising [R]+
rapidly falling [F]+
tooth [R][c]+[F]
reversed tooth [F][c]+[R]
drop [F][R]+[ˆF]
drop jump [F][R]+[F]
peak [R][F]
The idea of searching for patterns inside the ab-
stracted data is displayed in Figure 5. The system is
looking for a tooth pattern, which begins by a rapid
raise, followed by at least one constant value and ends
with rapid falling.
tooth pattern
Figure 5: The idea of searching for patterns in the abstracted
values.
5 EVALUATION
This section provides a simple demonstration of how
to use the proposed tool. The tool always works with
one PCAP file, which is prefiltered to contain only
packets essential for analysis. So if the goal is to find
patterns in network communication of several differ-
ent applications, it is up to the network administrator
to create one PCAP file for each application.
The example shows the transfer speed analysis
Pattern Detection based Network Diagnostics
39

of the selected application and attempts to find a
drop jump pattern. This pattern looks very similar
to the electrocardiogram (EKG) signal. The drop
jump pattern forms when the network is congested,
and the router stores all unsent data into a buffer. The
buffering will temporarily reduce the bit rate. After
the network is no longer congested, the router sends
the buffered data to their destination (Chappell and
Aragon, 2014). Therefore, transmission speed tem-
porarily raises above the normal level.
When diagnosing a problem with the poor qual-
ity of a video conference application, the drop jump
pattern is searched for. When the pattern is detected,
it means that the QoS queuing and buffering settings
are applied to the application. These settings are un-
desirable, because they will decrease QoE (quality-
of-experience) of such an application.
i n t e r v a l : 20
i n p u t s :
− t r a n s f e r s p e e d : COUNT( fr am e . l e n )
o u t p u t s :
− t r a n s f e r s p e e d
p a t t e r n s : d ro p jump
e r r o r : QoS qu e u i n g d e t e c t e d which
may d e c r e a s e t h e q u a l i t y o f u s e r
e x p e r i e n c e f o r m u l t i m e d i a t r a f f i c
Listing 1: The configuration specifies that the administrator
is interested in the drop jump pattern applied at the transfer
rate.
Listing 1 contains a configuration file that divides
the input data into intervals with a length of 20 mil-
liseconds and stores the amount of transferred data
into those intervals. The transferred data are used as
the input for the system, which tries to find the drop
jump pattern. With the drop jump pattern, the system
searches for a rapid drop, followed by a rapid increase
in the value. Figure 6 shows an example of pattern
detection in the PCAP file “tr-queuing.pcapng” from
the “Troubleshooting with Wireshark” (Chappell and
Aragon, 2014) book. The error describes what has
been detected to the network administrator.
Before deploying the created tool inside the pro-
duction network, it is necessary to evaluate the created
tool using real data and to measure the accuracy of
detection (true positive vs. false positive rate). In the
case of a high false-positive detection rate, the level
of the deviation will need to be adjusted to determine
whether there has been an increase or decrease in the
data values. Another option would be to create addi-
tional symbols to describe changes in values in more
detail (e.g., increase by 10%, increase by 20%). How-
ever, more symbols would increase the complexity of
the rules, and it would be harder for administrators to
manage them.
Figure 6: The output from the implemented tool which con-
tains the detected drop jump (DJ) pattern as specified by
the configuration in the Listing 1.
6 DISCUSSION
The presented method complements existing diagnos-
tic tools for network troubleshooting. Because of its
deterministic decision procedure based on the manu-
ally defined knowledge base, several advantages are
provided:
• Repeated execution of the method for the same
data yields the same results. This property is im-
portant for practical analysis when different paths
during problem investigations are examined.
• Using the rule-based method, it is usually easy to
observe the supporting information for the results
presented. Rule execution can be traced to pro-
vide a path of reasoning followed by the system,
which aids in understanding the issues and sug-
gests possible corrective actions.
• The system is robust and flexible. It is possible
to extend the system with new rules defined by a
simple, declarative rule language.
• The system does not require a huge labeled data
set to learn the classifier. It provides highly accu-
rate detection for a carefully crafted collection of
rules.
On the other hand, the method is limited in the fol-
lowing areas:
• It is not possible to identify behavior that is not
represented in the knowledge base. If an attack
exhibits a behavior, which has not been seen yet,
it is not possible to detect it.
• Creating new rules can be difficult as sometimes it
is hard to describe the expected situations in terms
of packet count, size, and timing. While this is
a very simple paradigm, it can represent a non-
DCNET 2020 - 11th International Conference on Data Communication Networking
40

trivial class of network configuration issues and
anomalies.
• To define the erroneous conditions, a deep knowl-
edge of communication protocols and systems is
necessary. Therefore the rules are to be defined by
the domain expert. However, it may be possible to
extend the system with specific rules identified by
the network administrator using the rule language.
• The process of creating rules is mostly manual,
and every update requires additional effort. How-
ever, to simplify the rule definition, an easy to un-
derstand declarative rule language was defined.
While modern methods introduced in the realm of
computer network management stems from machine-
learning algorithms, the rule-based approach is still
prevalent in practice. It is because rules are easy to
understand and rule evaluation is a deterministic pro-
cedure often offering enough information for finding
the root cause of the issue by the administrator.
7 CONCLUSION
Network diagnostics is a complex activity requiring
a lot of time and experience. We have presented a new
rule-based approach to the detection and identifica-
tion of network issues. The rules employ patterns
that consist of a sequence of value changes to identify
a sequence in network communication that possibly
represents an anomaly. This new approach automates
the labor activity conducted by network administra-
tors that use the visual representation of network ac-
tivities to identify non-standard situations.
We have implemented the proposed approach as
a proof-of-concept tool that processes capture traffic
and produces a log of identified issues. To demon-
strate the functionality of the tool, we have tested
the tool over a small amount of network data. The
results confirm that the approach has practical poten-
tial, but further evaluation is required.
Future work will focus on: (i) Use this approach
for another type of source data, such as log files or
NetFlow records. It also makes sense to think about
new types of patterns for these new data sources. (ii)
Comparing the solution (accuracy and performance)
with similar diagnostic tools. This could be difficult
because each approach aims at different network er-
rors, and accuracy will depend on created patterns
and configurations. Also, many published papers on
network diagnostics either do not provide access to
the tools or datasets used for revaluation. (iii) Reim-
plementing the tool into pipeline architecture to allow
the processing of real-time data.
ACKNOWLEDGEMENTS
This work was supported by the BUT FIT grant FIT-
S-20-6293, ”Application of AI methods to cyber se-
curity and control systems”.
REFERENCES
Akoglu, L., Tong, H., and Koutra, D. (2015). Graph based
anomaly detection and description: a survey. Data
mining and knowledge discovery, 29(3):626–688.
Barford, P., Kline, J., Plonka, D., and Ron, A. (2002). A
signal analysis of network traffic anomalies. In Pro-
ceedings of the 2nd ACM SIGCOMM Workshop on In-
ternet measurment, pages 71–82.
Ben Kraiem, I., Ghozzi, F., P
´
eninou, A., and Teste, O.
(2019). Pattern-based method for anomaly detection
in sensor networks. 21st International Conference on
Enterprise Information Systems (ICEIS 2019), pages
104–113.
Bhuyan, M. H., Bhattacharyya, D. K., and Kalita, J. K.
(2013). Network anomaly detection: methods, sys-
tems and tools. IEEE communications surveys & tu-
torials, 16(1):303–336.
Chandola, V., Banerjee, A., and Kumar, V. (2009).
Anomaly detection: A survey. ACM computing sur-
veys (CSUR), 41(3):1–58.
Chappell, L. and Aragon, J. (2014). Troubleshooting
with Wireshark: Locate the source of performance
problems. Laura Chappell University. ISBN: 978-
1893939974.
Garcia-Teodoro, P., Diaz-Verdejo, J., Maci
´
a-Fern
´
andez, G.,
and V
´
azquez, E. (2009). Anomaly-based network
intrusion detection: Techniques, systems and chal-
lenges. Computers & Security, 28(1-2):18–28.
Gu, Y., McCallum, A., and Towsley, D. (2005). Detect-
ing anomalies in network traffic using maximum en-
tropy estimation. In Proceedings of the 5th ACM SIG-
COMM conference on Internet Measurement, pages
32–32.
Hodge, V. and Austin, J. (2004). A survey of outlier de-
tection methodologies. Artificial intelligence review,
22(2):85–126.
Holkovi
ˇ
c, M. and Ry
ˇ
sav
´
y, O. (2019). Network diagnostics
using passive network monitoring and packet analy-
sis. The Fifteenth International Conference on Net-
working and Services (ICNS), pages 47–51.
Katasev, A. S. and Kataseva, D. V. (2016). Neural network
diagnosis of anomalous network activity in telecom-
munication systems. In 2016 Dynamics of Systems,
Mechanisms and Machines (Dynamics), pages 1–4.
IEEE.
Kruegel, C. and Toth, T. (2003). Using decision trees to
improve signature-based intrusion detection. In Inter-
national Workshop on Recent Advances in Intrusion
Detection, pages 173–191. Springer.
Pattern Detection based Network Diagnostics
41

Lee, H., Song, J., and Park, D. (2005). Intrusion detec-
tion system based on multi-class svm. In Interna-
tional Workshop on Rough Sets, Fuzzy Sets, Data Min-
ing, and Granular-Soft Computing, pages 511–519.
Springer.
łgorzata Steinder, M. and Sethi, A. S. (2004). A survey
of fault localization techniques in computer networks.
Science of computer programming, 53(2):165–194.
Li, H., Liu, G., Jiang, W., and Dai, Y. (2015). Designing
snort rules to detect abnormal dnp3 network data. In
2015 International Conference on Control, Automa-
tion and Information Sciences (ICCAIS), pages 343–
348. IEEE.
Martinez, E., Fallon, E., Fallon, S., and Wang, M. (2015).
Cadmant: Context anomaly detection for mainte-
nance and network troubleshooting. In 2015 Interna-
tional Wireless Communications and Mobile Comput-
ing Conference (IWCMC), pages 1017–1022. IEEE.
Ndatinya, V., Xiao, Z., Manepalli, V. R., Meng, K., and
Xiao, Y. (2015). Network forensics analysis using
wireshark. International Journal of Security and Net-
works, 10(2):91–106.
Prayote, A. and Compton, P. (2006). Detecting anomalies
and intruders. In Australasian Joint Conference on
Artificial Intelligence, pages 1084–1088. Springer.
Qadeer, M. A., Iqbal, A., Zahid, M., and Siddiqui, M. R.
(2010). Network traffic analysis and intrusion de-
tection using packet sniffer. In 2010 Second Inter-
national Conference on Communication Software and
Networks, pages 313–317. IEEE.
Qiu, T., Ge, Z., Pei, D., Wang, J., and Xu, J. (2010). What
happened in my network: mining network events from
router syslogs. In Proceedings of the 10th ACM SIG-
COMM conference on Internet measurement, pages
472–484.
Roesch, M. et al. (1999). Snort: Lightweight intrusion de-
tection for networks. In Lisa, pages 229–238.
Roy, S., Ellis, C., Shiva, S., Dasgupta, D., Shandilya, V.,
and Wu, Q. (2010). A survey of game theory as ap-
plied to network security. In 2010 43rd Hawaii Inter-
national Conference on System Sciences, pages 1–10.
IEEE.
Rudrusamy, G., Ahmad, A., Budiarto, R., Samsudin, A.,
and Ramadass, S. (2003). Fuzzy based diagnostics
system for identifying network traffic flow anoma-
lies. Proceedings of the International Conference of
Robotics, Vision, Information and Signal Processing
ROVISP, pages 190–195.
Sekar, R., Gupta, A., Frullo, J., Shanbhag, T., Tiwari, A.,
Yang, H., and Zhou, S. (2002). Specification-based
anomaly detection: a new approach for detecting net-
work intrusions. In Proceedings of the 9th ACM con-
ference on Computer and communications security,
pages 265–274.
Sol
´
e, M., Munt
´
es-Mulero, V., Rana, A. I., and Estrada, G.
(2017). Survey on models and techniques for root-
cause analysis. arXiv preprint arXiv:1701.08546.
Udd, R., Asplund, M., Nadjm-Tehrani, S., Kazemtabrizi,
M., and Ekstedt, M. (2016). Exploiting bro for intru-
sion detection in a scada system. In Proceedings of the
2nd ACM International Workshop on Cyber-Physical
System Security, pages 44–51.
Zeng, H., Kazemian, P., Varghese, G., and McKeown, N.
(2012). A survey on network troubleshooting. Tech-
nical Report Stanford/TR12-HPNG-061012, Stanford
University, Tech. Rep.
DCNET 2020 - 11th International Conference on Data Communication Networking
42
