
A Data-driven Methodology towards Interpreting Readability
against Software Properties
Thomas Karanikiotis, Michail D. Papamichail, Ioannis Gonidelis, Dimitra Karatza
and Andreas L. Symeonidis
Electrical and Computer Engineering Dept., Aristotle University of Thessaloniki,
Intelligent Systems & Software Engineering Labgroup, Information Processing Laboratory, Thessaloniki, Greece
Keywords:
Developer-perceived Readability, Readability Interpretation, Size-based Clustering, Support Vector
Regression.
Abstract:
In the context of collaborative, agile software development, where effective and efficient software maintenance
is of utmost importance, the need to produce readable source code is evident. Towards this direction, several
approaches aspire to assess the extent to which a software component is readable. Most of them rely on experts
who are responsible for determining the ground truth and/or set custom evaluation criteria, leading to results
that are context-dependent and subjective. In this work, we employ a large set of static analysis metrics along
with various coding violations towards interpreting readability as perceived by developers. In an effort to
provide a fully automated and extendible methodology, we refrain from using experts; rather we harness data
residing in online code hosting facilities towards constructing a dataset that includes more than one million
methods that cover diverse development scenarios. After performing clustering based on source code size, we
employ Support Vector Regression in order to interpret the extent to which a software component is readable
on three axes: complexity, coupling, and documentation. Preliminary evaluation on several axes indicates that
our approach effectively interprets readability as perceived by developers against the aforementioned three
primary source code properties.
1 INTRODUCTION
The term readability can be described as “the ease of
a reader to understand a written text”. In the case of
typical text this definition is straight-forward; how-
ever from a software engineering point of view and
in specific when we refer to source code, readability
is a complex concept linked to several factors beyond
the understanding of the specifics of each program-
ming language. These factors are the comprehension
of the purpose, the control flow, and the functionality
that the source code serves, aggregated at the level of
code block, method, class, component and/or system.
The vital importance of readability as a software
quality attribute is more than evident given the fact
that it is closely related to maintainability, which is
one of the most important quality characteristics ac-
cording to ISO/IEC 25010:2011 (ISO, 2020). In this
context, where software maintenance involes fixing
bugs as well as evolving the source code so as to
cover future requirements (both functional and non-
functional), several studies suggest that reading code
is one of the most time and effort-consuming tasks
while maintaining software (Rugaber, 2000; Ray-
mond, 1991). On top of the above, according to
Knight and Myers, checking for readability issues
has a positive impact in several quality attributes
such as portability, maintainability, and reusability
and should thus constitute a special part of the soft-
ware inspection procedure (Knight and Myers, 1993).
And, given the continuously increasing turn towards
the reuse-oriented software development paradigm,
the need to produce readable software increases.
Several research efforts are directed towards as-
sessing the extent to which software components are
readable (Buse and Weimer, 2010; Posnett et al.,
2011; Dorn, 2012; Scalabrino et al., 2016). The ma-
jority of the proposed approaches employ static anal-
ysis metrics, such as the widely used Halstead met-
rics (Halstead, 1977), in an effort to build readability
evaluation models. These approaches are in essence
effective, however they exhibit certain inherent weak-
nesses. At first, readability evaluation in the major-
ity of the proposed methodologies depends on quality
Karanikiotis, T., Papamichail, M., Gonidelis, I., Karatza, D. and Symeonidis, A.
A Data-driven Methodology towards Interpreting Readability against Software Properties.
DOI: 10.5220/0009891000610072
In Proceedings of the 15th International Conference on Software Technologies (ICSOFT 2020), pages 61-72
ISBN: 978-989-758-443-5
Copyright
c
2020 by SCITEPRESS – Science and Technology Publications, Lda. All rights reserved
61

experts who are responsible for defining the readabil-
ity degree of each software component under evalu-
ation and/or determining the appropriate thresholds
of metrics that result in higher readability. In addi-
tion, given that expert-aided evaluation is a proce-
dure that requires a significant amount of time and hu-
man resources, the size of the used datasets is small
and thus covers only a few use cases. As a result,
the proposed approaches provide a somewhat subjec-
tive evaluation and are restricted to certain develop-
ment scenarios. Finally, providing a single readability
score without actionable recommendations regarding
the certain axes that need improvement makes it diffi-
cult for developers to perform targeted audits towards
readability improvements.
In this work, we aspire to overcome the aforemen-
tioned limitations. We employ data residing in online
code hosting facilities (i.e. GitHub) in order to build a
fully-automated and interpretable readability evalua-
tion methodology that expresses the extent to which a
software component is readable as perceived by de-
velopers. Upon performing static analysis in more
that 1 million methods of the most popular and reused
GitHub Java projects, we define a readability score
at the method level based on the compliance of the
source code with the widely accepted code writing
practices as reflected in the number of identified vi-
olations. In order to cover various assessment scenar-
ios, we employ clustering for segmenting our dataset
into coherent groups that share similar (within clus-
ter) characteristics. Subsequently, for each cluster,
we employ Support Vector Regression and construct
three models that enable a comprehensive and inter-
pretable evaluation of the readability degree on three
axes, each corresponding to a primary source code
property; complexity, coupling, and documentation.
The rest of this paper is organized as follows.
Section II provides background information on static
analysis metrics and reviews current approaches on
readability estimation, while Section III describes our
benchmark dataset and designs a scoring mechanism
for the readability degree of source code components.
The developed models are discussed in Section IV,
while Section V evaluates the efficiency of our read-
ability interpretation methodology against different
axes. Finally, Section VI concludes this paper and
provides insight for further research.
2 RELATED WORK
The constantly increasing demand for producing bet-
ter software products that can live up to the expec-
tations of end-users, while at the same time reduc-
ing time-to-market and staying on budget, has pro-
moted the assessment of software quality aspects to
a key enabler for success. Quality aspects related to
maintainability have attracted a strong research fo-
cus, given the importance of software health and evo-
lution, and readability is one of the software char-
acteristics strongly related to maintainability. Sev-
eral quality metrics have been proposed for various
purposes, such as the recommendation of appropriate
code refactorings (Mkaouer et al., 2015) or the detec-
tion of code smells (Moha et al., 2010). However, the
metrics that are widely used in the above approaches
are often not able to quantify the quality improve-
ments as perceived by the community of developers
(Pantiuchina et al., 2018). Therefore, there is a need
for models that could identify the specific code qual-
ity metrics that can quantify and measure the qual-
ity of the source code, as well as its improvements in
practice, from the perception of the developers.
One of the first approaches towards evaluating
readability was made by Buse et al. (Buse and
Weimer, 2010) who built a descriptive model to clas-
sify a given code as “more readable” or “less read-
able”. The metrics that were used in the model are
mostly related to the structure, the documentation and
the logical complexity of the code and they were in-
tuitively selected by the authors. The authors re-
cruited 120 human annotators, in order to create the
ground truth, based on which their approach was eval-
uated, classifying correctly almost 80% of the anno-
tated samples. A research for the predictive power of
the features was also conducted and concluded that
95% of the total variability can be explained only by
the first 8 principal components of the features used.
A lot of subsequent approaches built on top of the
work of Buse et al. . Posnett et al. (Posnett et al.,
2011) extended the above approach by arguing that
the code size should explicitly be included in a model
that quantifies readability, in order to distinguish the
size dependency from the rest of the features. The
authors proved that the majority of the metrics used
by Buse were not independent from code size, while
code size itself cannot fully explain readability. The
metrics analysis also proved that the Halstead’s V
(Halstead, 1977) contains considerable explanatory
power and, when combined with size metrics, can
easily outperform the model proposed by Buse. The
model proposed by Posnett et al. formed the basis
for a study (Mannan et al., 2018) that quantifies the
readability score of open source projects, as well as
its evolution over the project lifetime. The study con-
cluded that projects tend to achieve high readability
scores, while they maintain these high scores over
time, despite the many changes that are made.
ICSOFT 2020 - 15th International Conference on Software Technologies
62

Contrary to Posnett, Dorn (Dorn, 2012) took into
account mainly structural and visual perception fea-
tures, quantifying the changes of code indentation,
line length and comments length with the use of
discrete Fourier transform (DFT) (Bergland, 1969).
Dorn evaluated his model based on a human study
of 5,000 participants, arguing that it correlates with
the human judgements 2.3 times better than any other
previous approach.
Scalabrino et al. (Scalabrino et al., 2016), in an
attempt to improve the previous readability models,
stated that textual features should also be taken into
account. The authors proposed some features that
could extract useful information from the source code
lexicon, such as the number of terms that are simul-
taneously used both in comments and in identifiers,
the number of full-word identifiers, the hyponyms
(e.g. terms with specific meaning) and the readabil-
ity of the comments (natural language text readabil-
ity). The proposed features were evaluated upon an
empirical study, indicating that the model based both
on structural and on textual features outperforms the
previously proposed approaches and that a consider-
able amount of code snippets could be correctly clas-
sified only by using the textual features. Scalabrino
et al. (Scalabrino et al., 2018), extended their previ-
ous work by adding new textual features and conduct-
ing a large empirical study. The results indicated that
the new model achieved slightly higher accuracy, out-
performing the current state-of-the-art models. More-
over, a readability model that achieves higher accu-
racy is proved to be more correlated to FindBugs
warnings.
On the other hand, Choi et al. (Choi et al., 2020)
attempted to build a model based only on structural
features. The evaluation upon human-annotated data
proved that it could make the right prediction on more
than the 70% of their data. The development of a tool,
named Instant R. Gauge, which calculates code read-
ability on the fly and helps the developer to make the
appropriate improvements, is also part of the authors’
contribution.
Fakhoury et al. (Fakhoury et al., 2019) conducted
an interesting study, in an attempt to examine the per-
formance of the approaches being proposed in the
bibliography in code improvements made by readabil-
ity commits. The results were quite interesting; The
readability models proposed are not able to capture
readability improvements, while additional metrics,
such as the number of incoming invocations, seem to
change significantly in readability commits.
In this work, we propose a generic methodology
that evaluates software readability at a method level.
Unlike previous approaches, trying to confront the
challenges that originate from the observations made
by Fakhoury, as well as the limitations of the afore-
mentioned readability evaluation methodologies, we
employ information residing in online code hosting
facilities. Upon formulating the ground truth using
a systematic methodology based on the compliance
of the source code with widely accepted code writing
practices (as reflected in the number of coding viola-
tions), we refrain from the limitations imposed by the
use of experts and design a fully automated evalua-
tion methodology. In the context of this methodology
and in an effort to provide interpretable results and
thus actionable recommendations, we employ Sup-
port Vector Regression and analyze the readability de-
gree of a given method on three different axes, each
corresponding to a primary code property.
3 TOWARDS DEFINING
READABILITY
3.1 Benchmark Dataset
In an effort to define readability as perceived by de-
velopers, our primary design choice is harnessing the
deluge of the available data residing in online code
hosting facilities so as to formulate a ground truth that
expresses the extent to which a software component is
readable. In specific, our dataset contains more than
1 million methods included in the most popular (as
reflected in the number of GitHub stars) and reused
(as reflected in the number of GitHub forks) GitHub
Java projects. We performed static analysis at method
level in order to compute two kinds of information:
a) the computation of a large set of static analysis
metrics that quantify four major source code proper-
ties: complexity, coupling, documentation, and size,
and b) while the second refers to the identification of
various coding violations regarding widely accepted
code writing practices. Given their scope and impact,
these violations are categorized into eight categories
(Best Practices, Documentation, Design, Code Style,
Error Prone, Performance, Multithreading, and Secu-
rity) and three levels of severity (Minor, Major, and
Critical). Upon selecting only the violations that are
related to readability, we eliminate the ones of cate-
gories Performance, Multithreading, and Security.
Certain statistics regarding the benchmark dataset
are given in Table 1, while Table 2 presents the cal-
culated static analysis metrics along with their asso-
ciated property. The static analysis metrics were cal-
culated using SourceMeter (sourcemeter, 2020) tool,
while the identification of coding violations was per-
A Data-driven Methodology towards Interpreting Readability against Software Properties
63
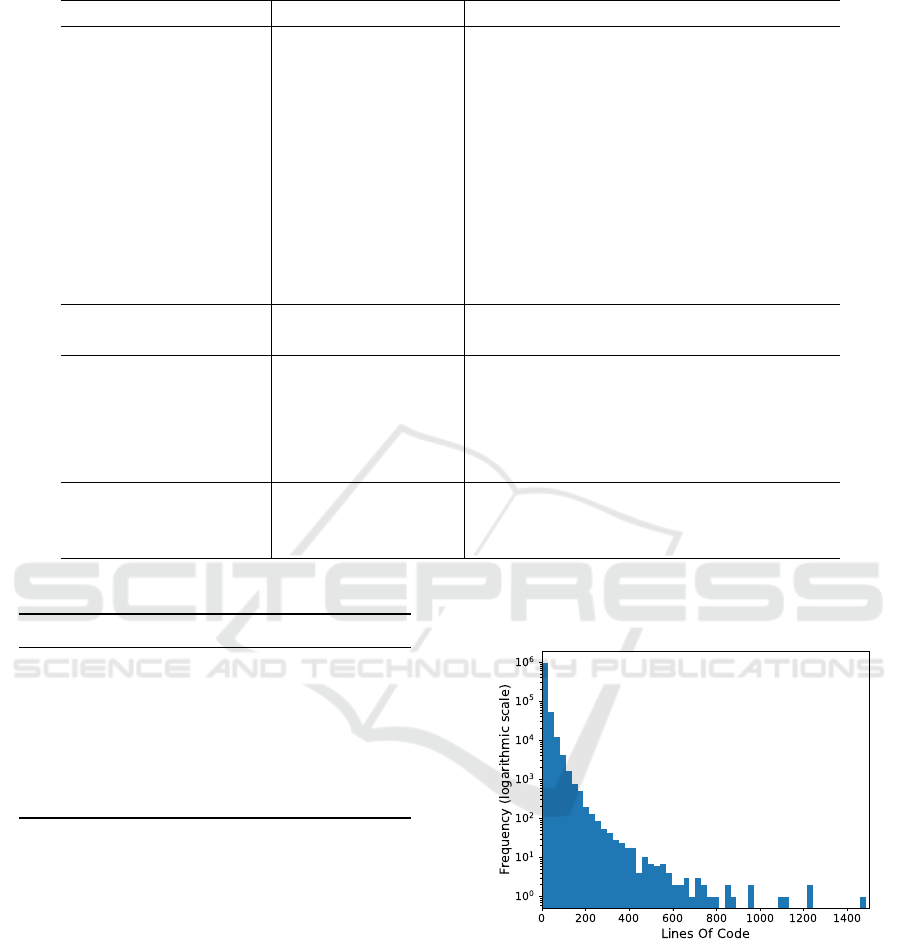
Table 2: Overview of the Computed Static Analysis Metrics.
Property Metric Name Metric Description
Complexity
NL Nesting Level
WMC Weighted Methods per Class
HDIF Halstead Difficulty
HEFF Halstead Effort
HNDB Halstead Number of Delivered Bugs
HPL Halstead Program Length
HPV Program Vocabulary
HTRP Time Required to Program
HVOL Volume
McCC McCabe’s Cyclomatic Complexity
MI Maintainability Index
Coupling
NII Number of Incoming Invocations
NOI Number of Outgoing Invocations
Documentation
CD Comment Density
CLOC Comment Lines of Code
DLOC Documentation Lines of Code
TCD Total Comment Density
TCLOC Total Comment Lines of Code
Size
LOC Lines of Code
LLOC Logical Lines of Code
NOS Number of Statements
Table 1: Dataset Statistics.
Metric Value
Number of GitHub projects 308
Number of Methods 1,004,589
Number of Metrics 21
Number of Code Properties 4
Number of Violations 193
Number of Violations Categories 5
Lines of Code Analyzed 9,003,547
formed using PMD tool (PMD, 2020).
3.2 Clustering based on Size
Given that our analysis is performed at the method
level and involves more than 1 million methods that
exhibit high diversity both in terms of size and scope,
our first step involves applying clustering techniques
so as to split our dataset in a set of cohesive clusters
that share similar characteristics. This design choice
originates from the fact that in practice, methods of
different size usually serve different functionalities or
follow different architectures. For instance, meth-
ods with a small number of lines of code (< 5) are
mainly used as setters/getters or specific utilities (read
data from files, middleware functions etc.), while
larger ones mainly provide more advanced functional-
ities. From a static analysis metrics perspective, they
should thus be handled accordingly.
Figure 1: Overview of the Quality Estimation Methodology.
Figure 1 presents the histogram (logarithmic
scale) of the lines of code regarding the analyzed
method; it is obvious that the dataset covers a wide
range of development scenarios.
Upon examining the data and in an effort to elim-
inate any introduced bias from the high frequency of
setters/getters and methods that provide no function-
ality (empty methods), our first step involves remov-
ing the methods that have less than 3 lines of code
combined with minimal complexity as reflected in the
ICSOFT 2020 - 15th International Conference on Software Technologies
64
values of McCabe Cyclomatic Complexity (<= 1).
These methods correspond to 27.12% of the dataset
(272,511 methods).
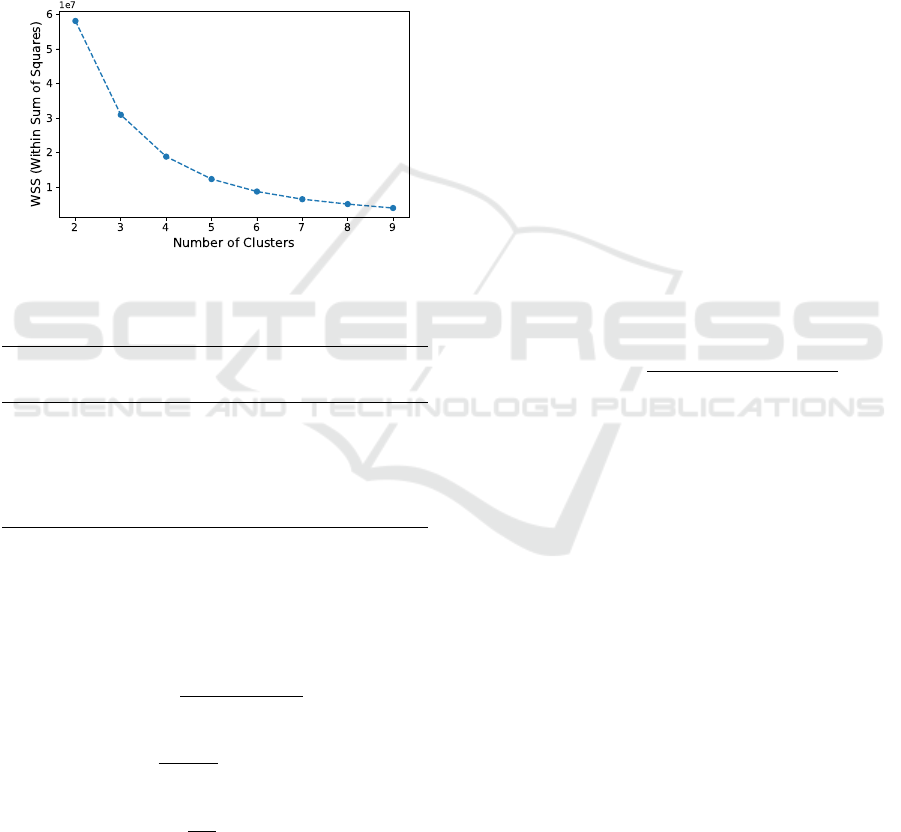
Our next step involves applying clustering using
k-Means algorithm. During this process and in order
to identify the optimal number of clusters, we calcu-
lated the cohesion as expressed by the within sum of
squares regarding different clusterings. Figure 2 illus-
trates the calculated cohesion for the cases where the
number of clusters varies from 2 to 8. Given the pro-
vided results, we selected five as the optimal number
of clusters.
Figure 2: Overview of Cohesion for Different Clusterings.
Table 3: Overview of the Formulated Clusters.
Cluster
Number LOC Mean
of Methods Range Silhouette
#1 499,858 (68.29%) [1, 10] 0.76
#2 166,496 (22.74%) [11, 24] 0.52
#3 51,964 (7.09%) [25, 51] 0.51
#4 11,925 (1.62%) [52, 112] 0.51
#5 1,718 (0.23%) > 112 0.69
The formulated clusters are presented in Table 3.
For assessing the results of the clustering procedure,
we used mean silhouette value (Rousseeuw, 1987)
which combines the criteria of both cohesion and sep-
aration and is given by the following equations:
s(i) =
b(i) − a(i)
max{a(i), b(i)}
(1)
a(i) =
1
|C
i
| − 1
∑
j∈C
i
,i6= j
d(i, j) (2)
b(i) = min
1
|C
i
|
∑
j∈C
k
,k6=i
d(i, j) (3)
In the above equations a(i) refers to the mean eu-
clidean distance between i and all other data points
in the same cluster, where d(i, j) is the euclidean dis-
tance between data points i and j in the cluster C
i
. On
the other hand, b(i) represents the smallest mean eu-
clidean distance of i to all points in any other cluster,
of which i is not a member. As shown in Table 3, the
mean silhouette value regarding the five formulated
clusters ranges from 0.51 to 0.76, while the value for
the whole clustering is 0.7.
Finally, in an effort to refrain from having clusters
that exhibit high similarities in terms of the behaviour
of the static analysis metrics and thus facilitate the
modelling procedure, we merge clusters #2 and #3
into one cluster that represents the cluster of medium
size methods and clusters #4 and #5 into one that rep-
resents the cluster of large size methods. These two
clusters along with cluster #1 that represents small
size methods are going to be used during modelling.
3.3 Defining Ground Truth
After having constructed our final clusters, each cor-
responding to a different size category, the next
step involves the formulation of the readability score
which will be used as the information basis for build-
ing our readability evaluation models. To that end,
we use the number of identified violations along with
their impact as reflected in their severity degree (Mi-
nor, Major, and Critical), according with the follow-
ing equations:
ViolPerLoc(i) =
Identi f iedViolations(i)
LLOC(i)
(4)
Identi f iedViolations(i) = w1 ∗ N
Minor
+ w2 ∗ N
Ma jor
+ w3 ∗ N
Critical
(5)
In the above equations, ViolPerLoc(i) refers to
the number of identified violations per Lines of Code
regarding the i − th method included in the dataset,
while LLOC(i) refers to the number of logical lines
of code. As shown in Equation 5 and given the fact
that each violation has different significance and thus
impact on the readability degree, the number of iden-
tified violations is computed using a different weight
based on the severity. The weight regarding the Minor
violations is 1 (w1), while the weights for the Major
and Critical violations are 2 (w2) and 4 (w3), respec-
tively. Once having calculated the ViolPerLoc metric
for methods included in the three formulated clusters,
we normalize its values in the range [0, 1] and the final
readability score is given by the following equation:
R
Score
(i) = 1 − Normed{ViolPer Loc(i)} (6)
Figure 4 depicts the boxplots of the readability
scores for the three formulated clusters where it is ob-
vious that in all clusters, the majority of the scores is
A Data-driven Methodology towards Interpreting Readability against Software Properties
65
GitHub
Top Java
Repositories
Static Analysis
Metrics
Code
Violations
Complexity
Documentation
Coupling
+
Readabilty
Evaluation
Small
Medium
Large
Figure 3: Overview of Readability Evaluation System.
distributed among a large interval and thus covers a
wide range of evaluation scenarios. Given the box-
plots, the cluster of “small methods” appears to have
the highest range, which makes no surprise given that
it contains almost 70% of the dataset and thus con-
tains methods that exhibit significant differences in
terms of adopting certain coding practices. Finally,
it is worth noting that the “large methods” cluster ap-
pears to have the highest mean readability score. Al-
though this may be surprising, it is logical from a soft-
ware engineering point of view given that our dataset
originates from the “best” GitHub Java projects as re-
flected in their adoption by the community of devel-
opers. These projects have hundreds of contributors
and thus need to comply with certain code writing
practices in order to ensure efficient collaboration, es-
pecially in the more complex parts of the source code.
Figure 4: Distribution of the Readability Scores.
4 SYSTEM DESIGN
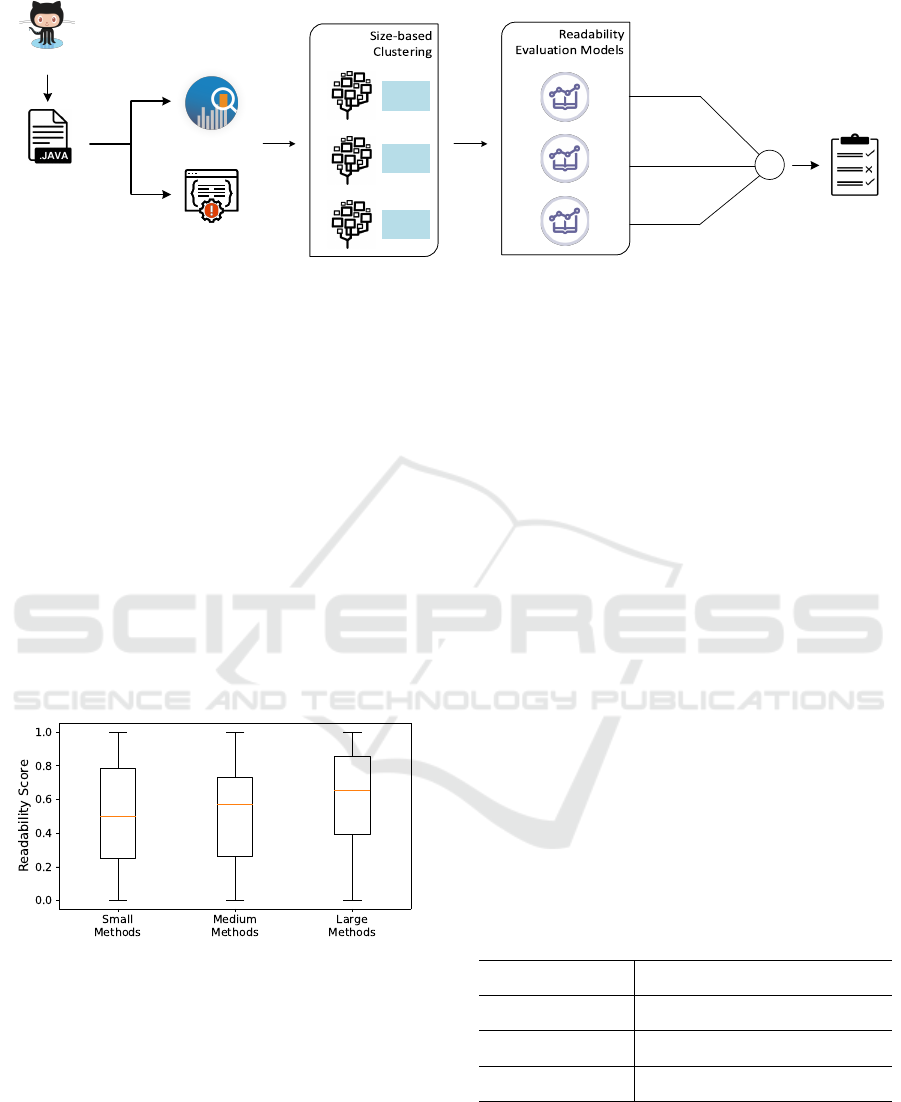
In this section we design our readability evaluation
system (shown in Figure 3) based on the values of a
large set of static analysis metrics that quantify three
major source code properties; complexity, coupling,
and documentation.
4.1 Data Preprocessing
The preprocessing stage is used to examine the set
of available metrics, detecting the overlays between
them, in order to reduce the dimensions of the dataset
and form the final set of metrics that will be used in
our model. Specifically, we compute the pairwise cor-
relations among all metrics to eliminate metrics that
appear to be interdependent. Figure 5 illustrates the
heatmap with the results of the correlation analysis.
From the heatmap that represents the correla-
tion analysis, we can easily notice the high correla-
tions between metrics that belong to the same cate-
gory (e.g. Complexity, Coupling and Documentation),
while metrics between different categories appear to
have lower correlations. Thus, our decision of evalu-
ating the readability degree on three independent axes
is fully justified. The results seem quite reasonable
from a software quality perspective. For instance, a
method with high Halstead Effort (HEFF) has a high
probability to also exhibit high Halstead Time Re-
quired to Program (HTRP) (with a correlation value
of 1), while there is no clue about the Number of
Incoming Invocations (NII) or the Number of Out-
going Invocations (NOI)(with a correlation value of
0.00027 and 0.16 respectively).
Table 4: The final metrics used in our model.
Property Metrics
Complexity NL, HDIF, HPV, McCC, MI
Coupling NII, NOI
Documentation CD, CLOC, DLOC
The correlation analysis showed that a lot of met-
rics coming from the same category are highly corre-
lated. For each metric category, upon examining the
highly correlated metrics and keeping one metric for
each of these groups, the final dataset consists of the
metrics depicted in Table 4.
ICSOFT 2020 - 15th International Conference on Software Technologies
66
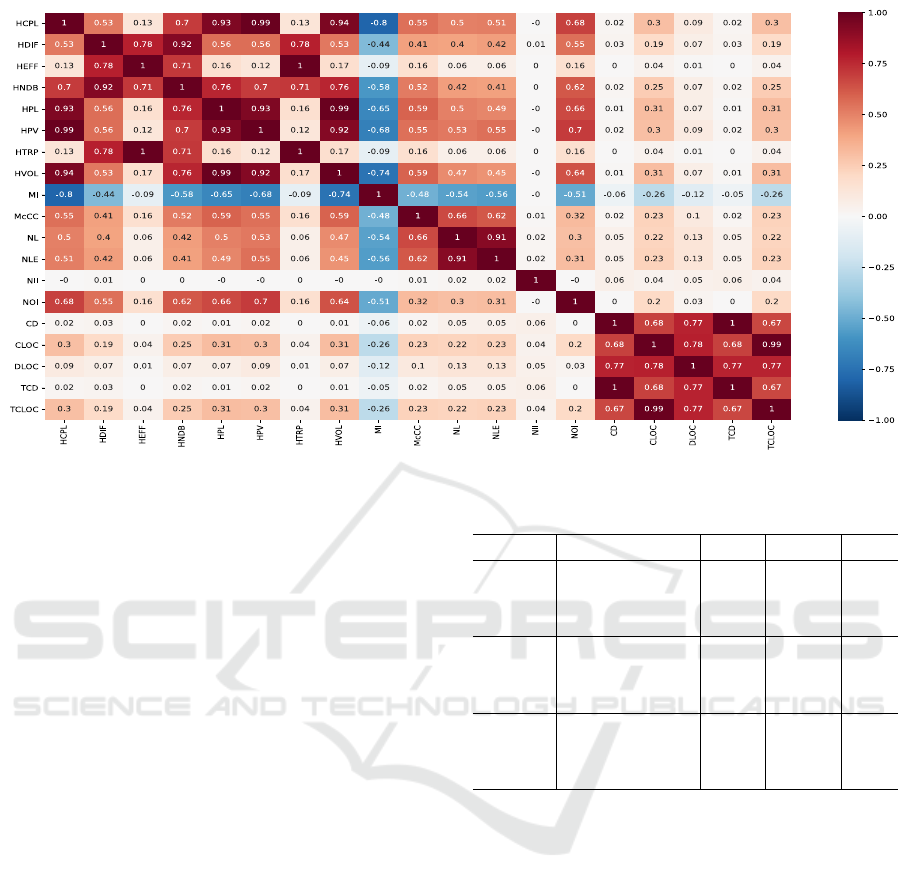
Figure 5: Heatmap representation of correlation analysis.
4.2 Model Construction
As already mentioned, we calculate one readability
score per each metric category, i.e. the readability
score concerning the Complexity metrics, the Cou-
pling metrics and the Documentation metrics, evalu-
ating the readability of each method from the percep-
tion of each axis separately. These three values are
then aggregated to form the final readability score of
the source code.
For the evaluation of the readability score of one
method upon each metrics category, a well-known re-
gression model was used, the Support Vector Regres-
sion (SVR) model (Drucker et al., 1997). In our ap-
proach, nine independent SVR models were built, re-
garding the three size clusters and the three metrics
categories in each cluster. The readability score as
formed in the previous section was used as the target
score of the three SVR models (e.g. the Complexity
SVR, the Coupling SVR and the Documentation SVR).
The various parameters of each model is depicted in
table 5, where g stands for gamma parameter, tol for
tolerance for stopping criterion and C for the regular-
ization parameter.
For the training process of each model, we follow
a 80/20 training-testing split, while we validate each
model by using 10-fold cross-validation. The train-
ing and testing errors for every model after the cross-
validation are depicted in table 6.
The output of each of the three models repre-
sents the readability score of the method regarding the
Complexity, the Coupling and the Documentation re-
spectively. The final readability score of the method is
Table 5: The parameters of the regression models.
Cluster Category g tol C
Small
Complexity 0.001 0.001 256
Coupling 0.001 0.0001 256
Documentation 0.001 0.01 256
Medium
Complexity 0.01 0.1 256
Coupling 0.01 0.01 256
Documentation 0.001 0.01 64
Large
Complexity 0.001 0.01 32
Coupling 0.2 0.1 64
Documentation 0.15 0.001 256
simply calculated by a weighted average of the three
scores, based on the number of metrics, from which
each metric category is made up of. As already men-
tioned in the preprocessing stage, 5 metrics are in-
cluded in Complexity and 2 metrics are included in
Coupling, while Documentation is consisted of 3 met-
rics. Thus, the final aggregation function is depicted
in the following equation:
RS = 0.5 · S
cmplx
+ 0.2 · S
cpl
+ 0.3 · S
doc
(7)
where RS is the final readability score of the method,
S
cmplx
is the readability score regarding Complexity,
S
cpl
the readability score regarding Coupling and S
doc
the readability score regarding the Documentation.
After the construction of the complete model, we
calculate the errors of the training and testing set re-
spectively, in order to evaluate its performance. Fig-
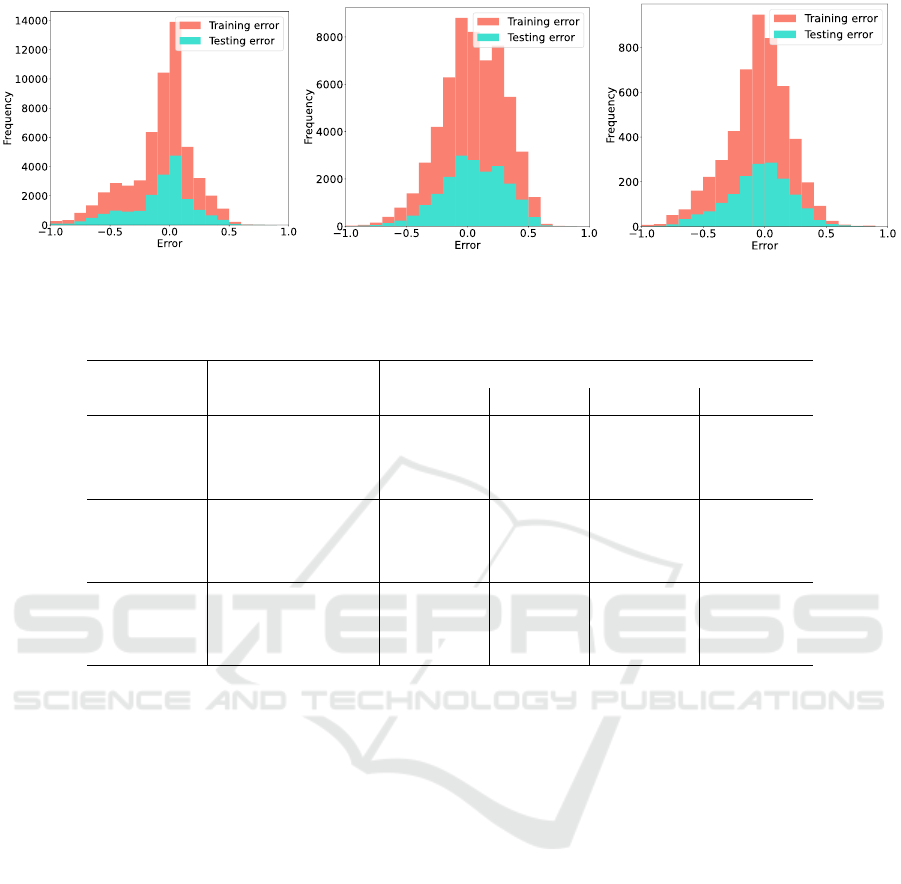
ure 6 illustrates the training and testing histograms for
each cluster. The models seem to be trained effec-
tively, as the training and testing errors are low and
A Data-driven Methodology towards Interpreting Readability against Software Properties
67
Small Size Cluster
Medium Size Cluster
Large Size Cluster
Figure 6: Error histograms of all cluster sizes.
Table 6: The cross-validation errors of the regression models.
Cluster Category
Training Testing
MAE MSE MAE MSE
Small
Complexity 18.56% 6.60% 18.5% 6.53%
Coupling 24.07% 8.27% 24.14% 8.30%
Documentation 23.65% 8.46% 23.52% 8.36%
Medium
Complexity 19.51% 5.52% 21.84% 7.11%
Coupling 22.83% 7.25% 23.02% 7.38%
Documentation 22.77% 7.09% 22.99% 7.19%
Large
Complexity 18.48% 6.53% 21.02% 8.68%
Coupling 21.24% 9.29% 22.54% 10.17%
Documentation 19.08% 7.12% 20.34% 8.94%
lie mostly around 0. At the same time, the distribu-
tions of the two errors are quite similar and the differ-
ences are minimal, indicating that the models avoided
overfitting.
5 EVALUATION
In this section we evaluate our constructed method-
ology for estimating software readability in a set of
diverse axes. At first, in an effort to evaluate the ef-
fectiveness and efficiency of our system, we apply our
methodology on a set of diverse projects that exhibit
different characteristics. As for the second axis and
towards assessing whether the calculated readability
scores are reasonable from a quality perspective, we
perform manual inspection on the values of the static
analysis metrics regrading methods that received both
low and high readability scores. Finally, in an attempt
to evaluate the effectiveness of our approach in prac-
tice, we harness the readability evaluation results in
order to improve the readability degree of a certain
Java method.
5.1 Readability Estimation Evaluation
In the first step towards assessing the validity of our
system, we evaluate its efficiency based on the read-
ability scores computed for five randomly selected
repositories (more than 20K methods and 350K Lines
of Code) that exhibit significant differences in terms
of size (number of methods and total lines of code)
and scope. Table 7 presents certain statistics regard-
ing the size and the readability evaluation for the five
examined repositories. In specific, the table contains
the number of methods as well as the lines of code
along with the mean values regarding the actual and
the predicted overall readability scores and the indi-
vidual score that targets each one of the evaluated
source code properties. In addition, in an effort to
further examine the readability interpretation results
against the evaluated source code properties, Figure 7
illustrates the percentage of the methods that received
low, medium and high readability scores. Low score
refers to values below 0.33 (or 33%), medium refers
to values in the interval (0.33, 0.66], while high refers
to scores above 0.7 (or 70%).
According to the provided results, it is obvious
ICSOFT 2020 - 15th International Conference on Software Technologies
68
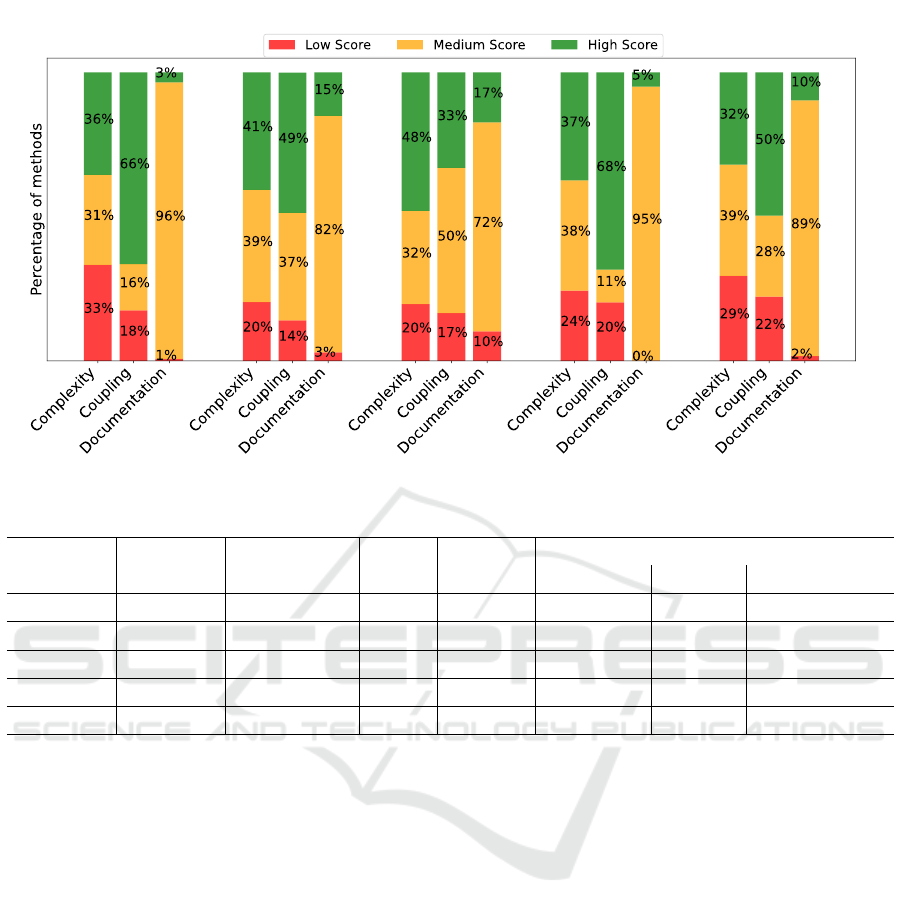
Figure 7: Percentage of scores per category.
Table 7: The readability score interpretation on evaluation repositories.
Repository
Number of Total Actual Predicted Readability Interpretation Scores
methods Lines of Code Score Score Complexity Coupling Documentation
#1 20,803 339,597 66.52% 56.81% 55.75% 57.83% 56.83%
#2 2,004 27,418 63.73% 53.51% 50.75% 55.45% 55.85%
#3 916 7,741 60.41% 53.88% 50.91% 54.87% 55.92%
#4 1,411 13,416 56.26% 52.35% 46.84% 54.31% 54.95%
#5 127 1,596 62.20% 56.43% 58.28% 56.04% 53.06%
that the overall predicted readability score, which oc-
curs as an aggregation of the respective scores for the
three source code properties, aligns with the one com-
puted using the number of identified violations. The
largest projects exhibit the highest differences (almost
10%), which is expected given that projects having
thousands of methods often include outliers from a
static analysis metrics point of view and thus may ex-
hibit higher errors. Even in such cases, our method-
ology appears to be efficient. In addition, given the
mean values of the readability score for the examined
properties, the results denote that in all cases the mean
value lies in the interval [40%, 60%] and thus one may
conclude that our models do not exhibit bias towards
making predictions aroung a certain value. This is
also reflected in the distribution of the scores as illus-
trated in Figure 7.
Upon further examining the calculated readability
scores in terms of decomposing the final score into
the three different axes under evaluation and in an ef-
fort to assess whether the calculated scores are logical
from a quality perspective, we examined the variance
of the scores for each respective property. The re-
sults showed that the scores regarding documentation
exhibit the lowest variance, while the ones regarding
complexity appear to have the highest variance. This
makes no surprise given that the way of documenting
source code in a certain project depends on the design
choices made by the main contributors that drive the
development process and thus refers to the project as a
whole. As a result, the within-project variance of the
documentation scores are expected to be low. This is
reflected in the percentage of methods receiving low,
medium, and high values regarding the five examined
projects. On the other hand, complexity and coupling
are properties that fully depend on the provided func-
tionality and thus methods with different scope and
target may exhibit high differences. This is also re-
flected in the percentage of methods receiving differ-
ent readability evaluation, where in the cases of cou-
pling and complexity this percentage is almost evenly
distributed in all five projects. At this point it is worth
noting that in the case of coupling, projects #1 and #4
appear to have a large number of methods that receive
a high score. This originates from the fact that these
projects contain several totally decoupled methods as
A Data-driven Methodology towards Interpreting Readability against Software Properties
69
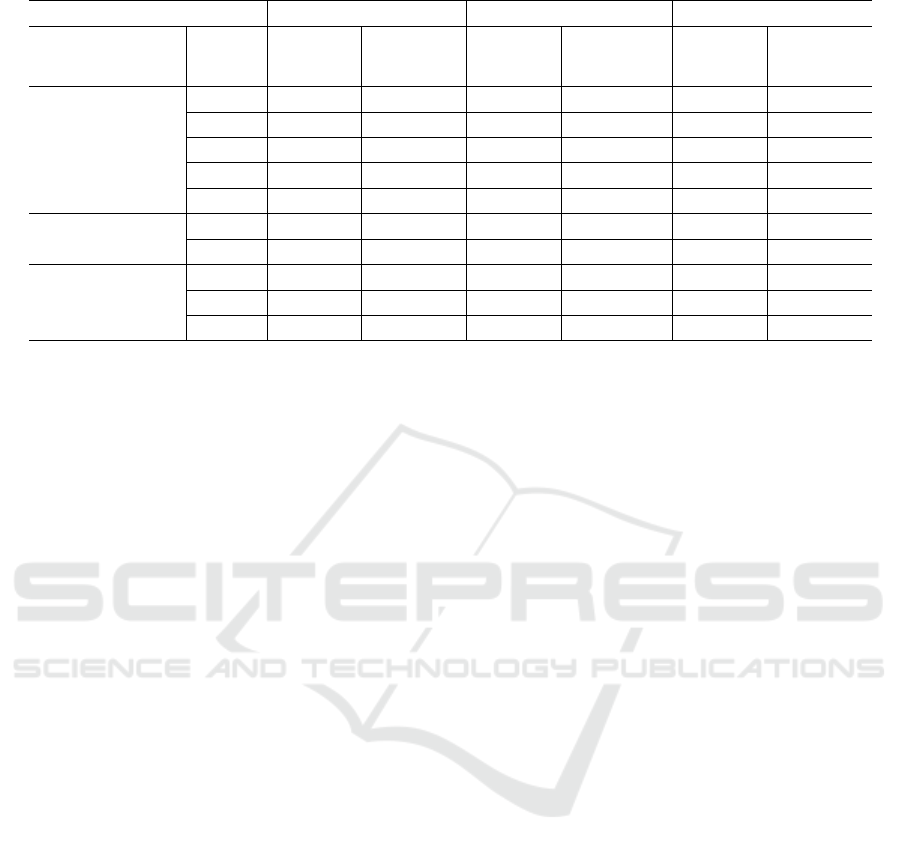
Table 8: Overview of the Static Analysis Metrics per Property for Methods with different Quality Scores.
Metrics Small Size Cluster Medium Size Cluster Large Size Cluster
High Low High Low High Low
Category Name Score Score Score Score Score Score
(77.2%) (28.18%) (85.2%) (15.43%) (76.1%) (24.83%)
NL 0 1 1 9 4 13
HDIF 16.25 16 61.92 42.54 121.47 114.83
Complexity HPV 20 28 59 95 126 227
McCC 1 2 4 14 12 64
MI 105.3 122.9 88.02 72.37 60.12 20.56
Coupling
NII 0 0 1 2 0 1
NOI 0 6 1 20 23 30
CD 0.23 0.00 0.34 0.08 0.27 0.0
Documentation CLOC 3 0 17 0 23 0
DLOC 3 0 23 5 15 0
reflected in the values of incoming and outgoing in-
vocations.
5.2 Example Readability Estimation
In order to further assess the effectiveness of our mod-
els and evaluate it from a software quality perspective,
we examined the methods that received high or low
readability score for each size cluster, along with the
values of the related static analysis metrics that led to
the predicted score. Table 8 presents these values re-
garding six different methods (two for each cluster)
that received low and high readability score, respec-
tively.
As for the methods of low size, it is obvious that
the method that received low readability score ap-
pears to have no documentation as reflected in the
zero value of the Comments Density (CD) metric. On
top of that and given the number of outgoing invoca-
tions (6), it appears to be highly coupled as it calls
six other methods during its execution. As a result,
the low readability score is logical from a quality per-
spective. The same applies for the method which re-
ceived high score given that it appears to exhibit no
coupling and has an average documentation level. It
is worth noting that both classes exhibit high scores
in terms of complexity.
As for the methods of medium size, it is obvious
that the method that received low readability score ap-
pears to be more complex and coupled than the one
that received high score as reflected in the values of
McCabe Cyclomatic Complexity (McCC) and Nest-
ing Level (NL), as well as in the number of incoming
and outgoing invocations. In addition, the class which
received a low score exhibits significantly higher vol-
ume as reflected in the value of Halstead Program Vol-
ume (HPV), which is calculated from the number of
distinct and total operations and operands. The same
conclusions are drawn, while inspecting the computed
values of the static analysis metrics of the methods in-
cluded in the large size cluster. In these methods, it is
worth noting that as size increases, the impact of com-
plexity into the readability degree becomes even more
evident. This is reflected in the high difference in the
values of Maintainability Index (MI) between the two
methods of the large size cluster. Given all the above,
the readability evaluation in all six cases appears to
be logical and can be explained by the values of the
static analysis metrics.
5.3 Application of Readability
Enhancement in Practice
Further assessing the effectiveness of our readabil-
ity evaluation system in terms of providing actionable
recommendations that can be used in practice during
development, we resort to the exploration of a certain
use-case where we harness the results of our system
towards improving the readability degree of a certain
method.
Figure 8 presents the initial source code of the
method under evaluation. This method is responsi-
ble for updating a certain database along with the
backup database and works in two different modes.
The first mode refers to the case when the variable
ForceUpdate is true and involves updating the main
database along with the backup database, while the
second refers to the case when the variable ForceUp-
date is false and involves only updating cache. At
this point, it is worth noting that no update operation
should be performed in the main database in cases
when isUpdateReady is false or synchronization is not
complete (isSynchCompleted is false). Upon evalu-
ating the respective method using our trained mod-
ICSOFT 2020 - 15th International Conference on Software Technologies
70

private static void updateDb(boolean isForceUpdate) {
if (isUpdateReady) {
if (isForceUpdate) {
if (isSynchCompleted) {
updateDbMain(true);
updateBackupDb(true);
} else {
updateDbMain(false);
updateBackupDb(true);
}
} else {
updateCache(!isCacheEnabled);
}
}
}
Figure 8: Initial version of method.
els the overall readability score is 0.428 (or 42.8%),
while the scores for the three properties were as fol-
lows: 0.637 (or 63.7%) for the Complexity, 0.472 (or
47.2%) for the Coupling, and 0.052 (or 5.2%) for the
Documentation. Given these results, it is obvious that
our method lacks proper documentation, while at the
same time we can see that there is a relatively large
nesting level as reflected in the NL value which is 3.
/∗∗
∗ Update mainDB, backupDB, and cache
∗/
private static void updateDb(boolean isForceUpdate) {
// Do nothing in case the update is not ready
if (!isUpdateReady){
return;
}
// Update cache in case of non forced update
if (!isForceUpdate) {
updateCache(!isCacheEnabled);
return;
}
// General Update Pipeline (Backup and Main DB)
updateBackupDb(true);
updateDbMain(isSynchCompleted ? true : false);
}
Figure 9: Final version of method.
We try to optimize our method in two directions.
At first, we add detailed documentation explaining the
different control flow paths in order to improve the
comprehensibility of the code. Our second audit tar-
gets reducing complexity by refactoring the naviga-
tion to the different available control flow paths and
thus improve clarity. Figure 9 presents the optimized
version of the source code, which originates from
the aforementioned audits. Upon evaluating the opti-
mized version, the overall readability score is 0.80 (or
80%), while the scores regarding the three properties
were as follows: 0.833 (or 83.3%) for the Complex-
ity, 0.472 (or 47.2%) for the Coupling, and 0.963 (or
96.3%) for the Documentation. As given by the com-
parison of the two code fragments, which are func-
tionally equal, the performed audits had a significant
impact on the readability degree, which is reflected in
the scores. Finally, given that the two code fragments
have the same number of incoming and outgoing in-
vocations, the score regarding the coupling property
remains the same. Finally, there is still room for im-
provement by splitting the method into multiple meth-
ods each being responsible for a certain task. In that
way, we can also improve coupling.
6 THREATS TO VALIDITY
Our approach towards readability evaluation interpre-
tation seems to achieve high internal validity, as it has
already been proved from the evaluation. The limi-
tations and threats to the external validity of our ap-
proach span along the following axes: a) limitations
imposed by the definition of our ground truth, and b)
the selection of our benchmark dataset.
Our design choice to quantify readability based on
the compliance of the source code with widely ac-
cepted coding practices as reflected in the number of
identified violations originates from the fact that the
primary target of coding violations is to set up a com-
mon ground between the development community in
terms of following certain code writing guidelines.
Apart from preventing the occurrence of various types
of errors (already known and documented), this com-
mon ground is crucial for improving the understand-
ability of the source code and thus influences read-
ability. Furthermore, given that we interpret readabil-
ity as perceived by developers, our benchmark dataset
is built upon harnessing crowdsourcing information
regarding the popularity and the degree of reuse for
a large number of GitHub Java projects. This in-
formation reflects the high adoption of the selected
projects among the community of developers and thus
was considered appropriate towards formulating our
benchmark dataset. Of course, our methodology can
be applied as-is using a different benchmark dataset
that covers the individual needs of specific evaluation
scenarios.
A Data-driven Methodology towards Interpreting Readability against Software Properties
71

7 CONCLUSIONS AND FUTURE
WORK
In this work, we proposed an automated and inter-
pretable readability evaluation methodology, which is
based on a large set of static analysis metrics and cod-
ing violations. The evaluation of our approach in a set
of diverse axes indicates that our system can be effec-
tive for evaluating readability on three axes, each cor-
responding to a primary source code property. Upon
providing results that lead to actionable recommenda-
tions regarding the audits that can enhance the read-
ability degree of the project under evaluation, our sys-
tem can be a valuable tool for developers.
Future work relies on several directions. At
first, we can expand our dataset by adding additional
projects with different characteristics and thus im-
prove the ability of our models to generalize. Finally,
the design of our target variable can be further investi-
gated for the incorporation of additional metrics other
than violations.
ACKNOWLEDGEMENTS
This research has been co-financed by the European
Regional Development Fund of the European Union
and Greek national funds through the Operational
Program Competitiveness, Entrepreneurship and In-
novation, under the call RESEARCH - CREATE - IN-
NOVATE (project code: T1EDK-04045).
REFERENCES
Bergland, G. D. (1969). A guided tour of the fast fourier
transform. IEEE Spectrum, 6(7):41–52.
Buse, R. and Weimer, W. (2010). Learning a metric for code
readability. IEEE Transactions on Software Engineer-
ing, 36:546–558.
Choi, S., Kim, S., Kim, J., and Park, S. (2020). Met-
ric and tool support for instant feedback of source
code readability. Tehnicki vjesnik - Technical Gazette,
27(1):221228.
Dorn, J. (2012). A general software readability model.
Drucker, H., Burges, C. J. C., Kaufman, L., Smola, A. J.,
and Vapnik, V. (1997). Support vector regression ma-
chines. In Mozer, M. C., Jordan, M. I., and Petsche,
T., editors, Advances in Neural Information Process-
ing Systems 9, pages 155–161. MIT Press.
Fakhoury, S., Roy, D., Hassan, S. A., and Arnaoudova,
V. (2019). Improving source code readability: The-
ory and practice. In Proceedings of the 27th Interna-
tional Conference on Program Comprehension, ICPC
19, page 212. IEEE Press.
Halstead, M. H. (1977). Elements of software science.
ISO (2020). ISO/IEC 25010. https://iso25000.com/index.
php/en/iso-25000-standards/iso-25010. Accessed:
2020-03-20.
Knight, J. C. and Myers, E. A. (1993). An improved in-
spection technique. Communications of the ACM,
36(11):50–61.
Mannan, U. A., Ahmed, I., and Sarma, A. (2018). Towards
understanding code readability and its impact on de-
sign quality. pages 18–21.
Mkaouer, M. W., Kessentini, M., Bechikh, S., Cinnide,
M., and Deb, K. (2015). On the use of many quality
attributes for software refactoring: a many-objective
search-based software engineering approach. Empiri-
cal Software Engineering.
Moha, N., Gueheneuc, Y., Duchien, L., and Le Meur, A.
(2010). Decor: A method for the specification and de-
tection of code and design smells. IEEE Transactions
on Software Engineering, 36(1):20–36.
Pantiuchina, J., Lanza, M., and Bavota, G. (2018). Im-
proving code: The (mis) perception of quality metrics.
pages 80–91.
PMD (2020). PMD static analysis tool. https://pmd.github.
io/. [Online; accessed March 2020].
Posnett, D., Hindle, A., and Devanbu, P. (2011). A simpler
model of software readability. In Proceedings of the
8th Working Conference on Mining Software Repos-
itories, MSR 11, page 7382, New York, NY, USA.
Association for Computing Machinery.
Raymond, D. R. (1991). Reading source code. In Proceed-
ings of the 1991 Conference on Centre for Advanced
Studies on Collaborative Research (CASCON), pages
3–16.
Rousseeuw, P. (1987). Rousseeuw, p.j.: Silhouettes:
A graphical aid to the interpretation and validation
of cluster analysis. comput. appl. math. 20, 53-65.
Journal of Computational and Applied Mathematics,
20:53–65.
Rugaber, S. (2000). The use of domain knowledge in pro-
gram understanding. Annals of Software Engineering,
9:143–192.
Scalabrino, S., Linares-Vsquez, M., Oliveto, R., and Poshy-
vanyk, D. (2018). A comprehensive model for code
readability. Journal of Software: Evolution and Pro-
cess, 30(6):e1958. e1958 smr.1958.
Scalabrino, S., Linares-Vsquez, M., Poshyvanyk, D., and
Oliveto, R. (2016). Improving code readability mod-
els with textual features. In 2016 IEEE 24th In-
ternational Conference on Program Comprehension
(ICPC), pages 1–10.
sourcemeter (2020). SourceMeter static analysis tool. https:
//www.sourcemeter.com/. [Online; accessed March
2020].
ICSOFT 2020 - 15th International Conference on Software Technologies
72
