
Quality of Experience of 360-degree Videos
Played in Google Cardboard Devices
Saket Vikram Singh
1
and Markus Fiedler
2a
1
Tarento Technologies, Bengaluru, India
2
Blekinge Institute of Technology, Karlshamn, Sweden
Keywords: Quality of Experience (QoE), Virtual Reality (VR), User Experiments, Comfort, Presence, Interactivity,
Opinion Scores, Statistics, Mean Opinion Score (MOS), Good or Better (GoB), Poor or Worse (PoW).
Abstract: Google Cardboard boxes provide a cost-efficient way to introduce users to Virtual Reality (VR) applications.
These devices are suitable to be utilized for entertainment, gaming, and online studies. The 360-degree videos
also known as immersive videos, play panoramic view in a video. The videos are played with a mobile phone
mounted on a cardboard box and are viewed by wearing or holding the cardboard box. This paper studies the
QoE of users (N=60) with QoE features user comfort, presence, and interactivity with panoramic video, based
on QoE factors such as lens quality, weight and handling properties of the device. The experimental data is
analysed in terms of statistical properties such as Mean Opinion Scores (MOS) including confidence intervals,
as well as Percents of Good or Better (%GoB) and Poor or Worse (%PoW). Furthermore, the correlations
between user ratings with respect to different groups of QoE features are investigated. Overall, the paper
shows cardboard boxes to yield good-to-fair QoE for viewing panoramic videos.
1 INTRODUCTION
Virtual Reality (VR) devices are increasingly being
used in many industries for entertainment,
educational, and training purposes. Cardboard boxes
are low cost, simple devices to view videos and
experience VR with mobile phones. Gaming and
educational content are important use cases for
Google Cardboard (Schlögl et al., 2017). There are
benefits of using VR (Choi et al., 2017) and Google
Cardboard (2019) as content delivery systems, with
sufficiently high user immersion (Lee et al., 2017; Di
Stefano and Battisti, 2017), but even risks for vertigo,
nausea, and headaches (Klein, 2017). Highly
immersive experiences using 360° videos provide
positive educational experiences while minimizing
simulator sickness (Rupp et al., 2019). Google
Cardboard and 360-degree videos have been used to
study bullying at school and ambiguous social
situations (Berg et al., 2016).
Given this background and potential, our study
aims at quantifying to which extent low cost
cardboard box devices can provide adequate Quality
of Experience (QoE), defined as “the degree of
a
https://orcid.org/0000-0001-8929-4911
delight or annoyance to the user of an application or
service. It results from the fulfillment of his or her
expectations with respect to the utility and/or
enjoyment of the application or service in the light of
the user’s personality and current state” (Le Callet et
al., 2013). Thus, we have analyzed QoE features such
as comfort, presence and interactivity of user, and
correlations between these factors. User experiments
have been conducted for 360-degree videos in mobile
phone virtual reality (VR) environments with three
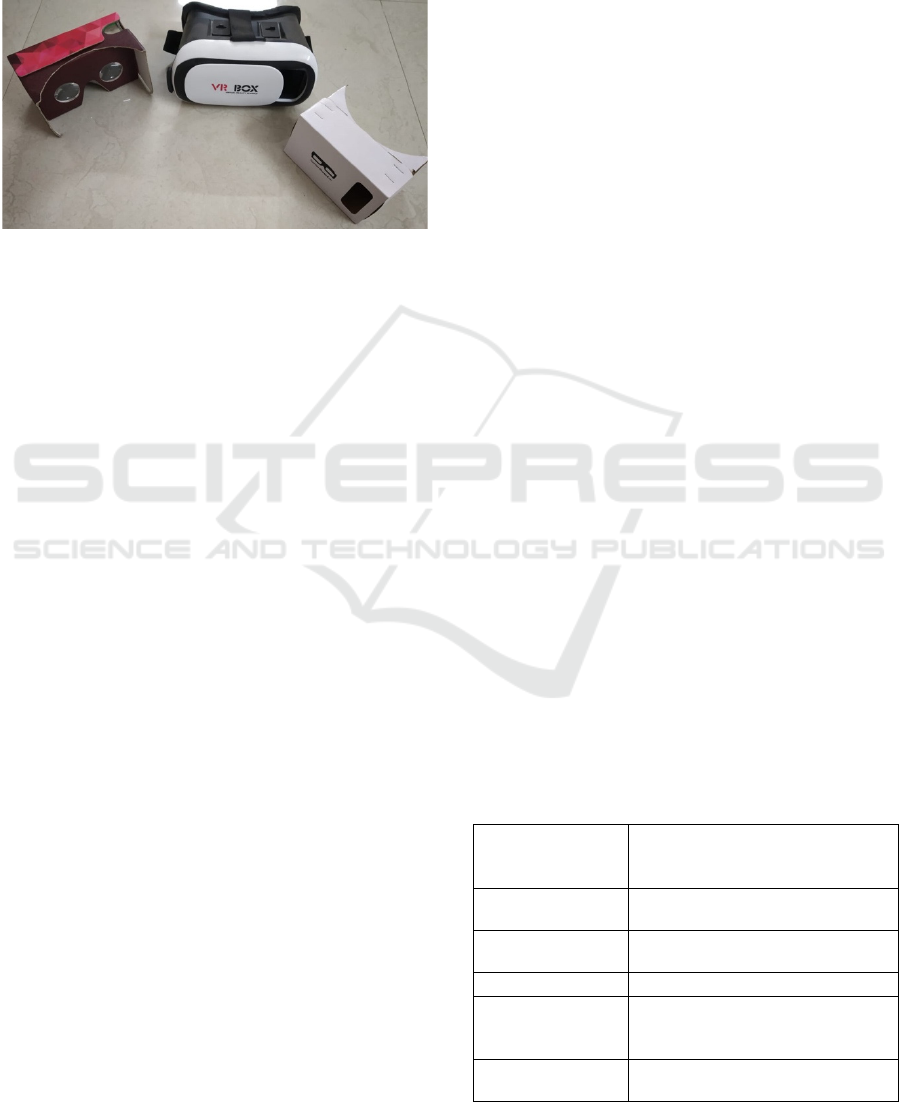
cardboard box devices as shown in Figure 1, namely
Irusu (2019),
Music Joy (2019)
and Getcardboard
(AuRAVR, 2019), along with the Coral Reef ocean
view, which is available inside the official Google
Cardboard video app (Google Cardboard, 2019). Our
work complements (Di Stefano and Battisti, 2017),
which reports on average QoE ratings of N=10 users
who evaluated Google Cardboard in a virtual museum
setting, without any further statistical analysis.
The remainder of the paper is structured as
follows. Section 2 discusses QoE features and
Section 3 shortly reviews QoE factors that are of
relevance to our experiments. Section 4 presents and
discussed the user experiments and the questionnaire
Singh, S. and Fiedler, M.
Quality of Experience of 360-degree Videos Played in Google Cardboard Devices.
DOI: 10.5220/0009886901150122
In Proceedings of the 17th International Joint Conference on e-Business and Telecommunications (ICETE 2020) - DCNET, OPTICS, SIGMAP and WINSYS, pages 115-122
ISBN: 978-989-758-445-9
Copyright
c
2020 by SCITEPRESS – Science and Technology Publications, Lda. All rights reserved
115
used. Section 5 presents the results of the user study
in terms of Mean Opinion Scores (MOS) with
confidence intervals, Percent of Good or Bad
(%GoB) and Poor or Worse (%PoW), as well as
correlations between different groups of QoE
features. Section 6 concludes the paper.
Figure 1: Google Cardboard boxes used in this study (from
left to right: Irusu, Music Joy and Getcardboard).
2 QoE FEATURES
A QoE feature is defined as “a perceivable,
recognized and namable characteristic of the
individual’s experience of a service which contributes
to its quality” (Le Callet et al., 2013). In the
following, we provide an overview of the features of
relevance for our use case and our specific study.
User comfort in terms of agreeability and
convenience is a basic and natural feature; being
uncomfortable may contribute to cybersickness
(Huyen et al., 2017).
User presence refers to a user’s subjective
psychological response to a VR system (Slater
and Wilbur, 1997). Presence is a subjective
parameter and only quantifiable by a user (Slater,
1999).
User interactivity depends on objective para-
meters of devices and videos played. The user is
able to interact with the video playout by opening
information popups, zoom in or zoom out the
viewport of cardboard. Interactivity is present in
only one of the devices (Irusu), with a button on
the top at the right-hand side of the device.
Furthermore, user immersion refers to the objective
level of sensory fidelity a VR system provides (Slater
and Wilbur, 1997), which we chose to leave for future
work. In their virtual museum case, Stefano and
Battisti (2017) have asked users about immersiveness,
usability, and utility.
3 QoE FACTORS
A QoE factor is “any characteristic of a user, system,
services, application, or context whose actual state or
setting may have an influence on the Quality of
Experience for the user” (Le Callet et al., 2013).
(Narciso et al., 2019) reported that both video and
audio formats did not produce a significant effect on
the sense of presence or cybersickness. The major
factor as to why this occurred is related to the nature
of the content used in the experiments. The authors
“found a statistically significant effect on Video and
Gender on both presence and cybersickness.”
(Narciso et al., 2019). In our study, we noted the
following features of particular importance:
Lenses: The capability of adjusting the lenses is
only present in Music Joy. The quality of the
lenses cannot be directly measured. However, the
impact of those factors is expected to be visible
through user ratings with respect to comfort and
presence.
Weight: Another factor of particular importance
is related to how heavy the box is, which is
expected to be seen in comfort-related ratings.
Handling: Whether the device has to be held
while watching or whether it can be worn is also
expected to contribute to comfort-related ratings.
Controls: The means of control available to the
user, as well as the way they are to be handled
are expected to primarily affect the interactivity-
related (and secondarily the presence- and
comfort-related) ratings.
4 USER EXPERIMENTS
The setup of the user experiments is summarised in
Table 1, followed by an overview of the experimental
procedure and the questionnaire, respectively.
Table 1: Details of the user experiments.
Users studied N=60, age 22–39 y (average: 28 y)
40 males, 20 females
29 novice cardboard box users
Duration 1 video, each of 1 minute, watched
by
ever
y
use
r
Environmental
conditions
Closed room with controlled
soun
d
an
d
tem
p
erature
Mobile device Apple Iphone 6S
Cardboard devices 1. Irusu
2. Music Joy
3. GetCardboar
d
Video used Coral Reef Ocean View inside the
Google Cardboard (2019) app
SIGMAP 2020 - 17th International Conference on Signal Processing and Multimedia Applications
116
The recruited participants are working in the IT
industry, and are well versed in handling mobile
phones and videos. They quickly grasped the
methodology of viewing and answering the
questionnaires, which allowed them to focus on the
videos and answer the questions in an efficient
manner.
The three cardboardbox devices that we used offer
different levels of interactivity and possibilities to
adjust the image. Unfortunately, the original
cardboardbox by Google was not available to be
included in the study.
4.1 Procedure
In a first step, the users were informed about the three
devices and their features, as well as the features of
360-degree video to be viewed by rotating the head in
all directions. The 360-degree video content is neutral
with natural environment settings, and viewing the
same video with three devices brings consistency in
comparison. Interactivity with the video happens by
clicking on information popups over different objects
appearing in the video and choosing options to view
different paths.
The users have a demo session to understand the
environment. During the experiment, the users watch
the video for one minute on each device. This is
followed by a questionnaire (cf. Section 4.2) to be
answered by each user based on their experience. The
questions appear in the same order to all the users for
each experiment. Before starting the questionnaire, the
rating scales are explained, while any confusion
regarding the questions is clarified while answering
them. The users conclude their questionnaire with
verbal feedback on their experience. This process is
repeated for all three devices for each user.
4.2 Questionnaire
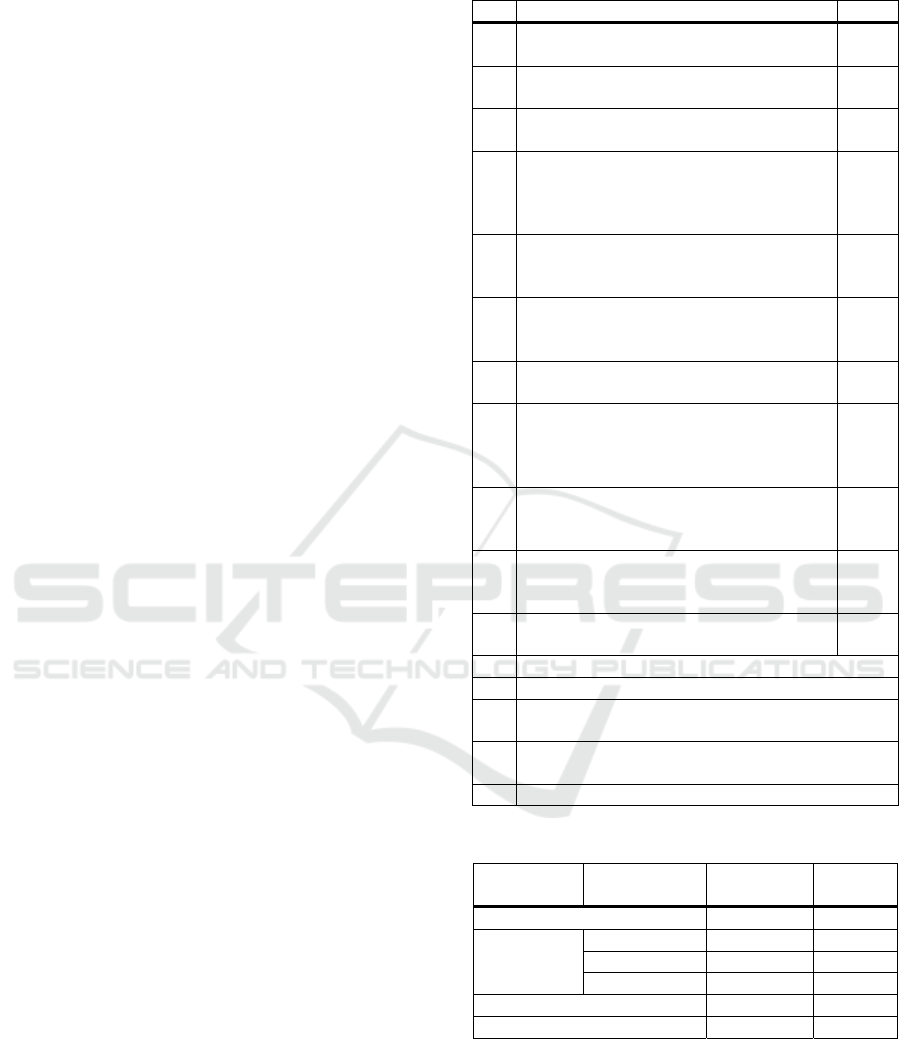
Table 2 shows the questionnaire used in this study.
The ACR scale (ITU-T P.910, 2008) stretches from 1
(= bad) to 5 (= excellent). Proprietary scales were used
for questions Q4, Q9 and Q11, also ranging from 1 (=
minimal level) to 5 (= maximal level).
Table 3 groups the questions and matches them to
the QoE features of interest, cf. Section 2. This
grouping will be of particular importance when
correlating the user ratings to each other, cf. Section 5.
Table 2: Questionnaire used.
Q# Question Scale
1 How comfortable you were in moving
y
our head to view the 360-de
g
ree video?
ACR
2 How do you rate the comfort of watching
video with Cardboardbox device?
ACR
3 How pleasant was your overall 360-
de
g
ree video viewin
g
ex
p
erience?
ACR
4 During the time of your experience in
virtual environment, how would you rate
your sense of somewhere else from the
virtual environment?
1–5
5 To which extent did your experiences in
the virtual environment seem consistent
with
y
our real-world ex
p
eriences?
ACR
6 When you think back of the experience,
how closely you think of the virtual
environment as a place that you visited?
ACR
7 Please rate your sense of being in the
virtual environment.
ACR
8 How aware were you of the real world
surrounding while navigating in the
virtual world? (i.e. sounds, room
tem
p
erature, other
p
eo
p
le, etc.
ACR
9 How often did you want to use control
buttons when u saw them on screen while
watchin
g
the 360-de
g
ree video?
1–5
10 To which extent did the presence of the
control button on headset device help you
in a more
p
leasant ex
p
erience?
ACR
11 How often did you adjust your device to
focus on the videos?
1–5
12 What is
y
our a
g
e
(y
ears
)
?
13 What is
y
our
g
ender
(
M/F
)
?
14 How experienced are you in using VR headsets
(
in months
)
?
15 Which device have you used in this session?
(Irusu/ Music Joy/ Getcardboard)
16 Please share
y
our feedback for the session.
Table 3: Grouping of questions.
Group Factor
(if applicable)
Number of
questions
Range
(Q#)
Overall QoE 1 3
Factors Comfort 2 1
–
2
Presence 5 4
–
8
Interactivit
y
3 9
–
11
User
p
rofile and device use
d
1 12
–
15
Sub
j
ective feedbac
k
1 16
5 RESULTS
For each of the three devices and questions Q1 to Q11,
we obtain a set of opinion scores set of N opinion
Quality of Experience of 360-degree Videos Played in Google Cardboard Devices
117
scores {OS
1
, OS
2
… OS
N
}. In the next subsections, we
analyse a set of statistics.
5.1 Mean Opinion Score (MOS)
The Mean Opinion Score (MOS) is defined as the
average of the user ratings,
𝑀𝑂𝑆
∑
(1)
and the Standard deviation of Opinion Scores (SOS)
as a measure of the deviation of said ratings from the
average,
𝑆𝑂𝑆
∑
(2)
The combination of both are used for outlier removal
(opinion scores outside the interval MOS 2 SOS are
not taken into account for the statistics) as well for
constructing 90% confidence intervals (CI)
𝑀𝑂𝑆 𝑡
,.
√
,𝑀𝑂𝑆𝑡
,.
√
(3)
with 𝑡
,.
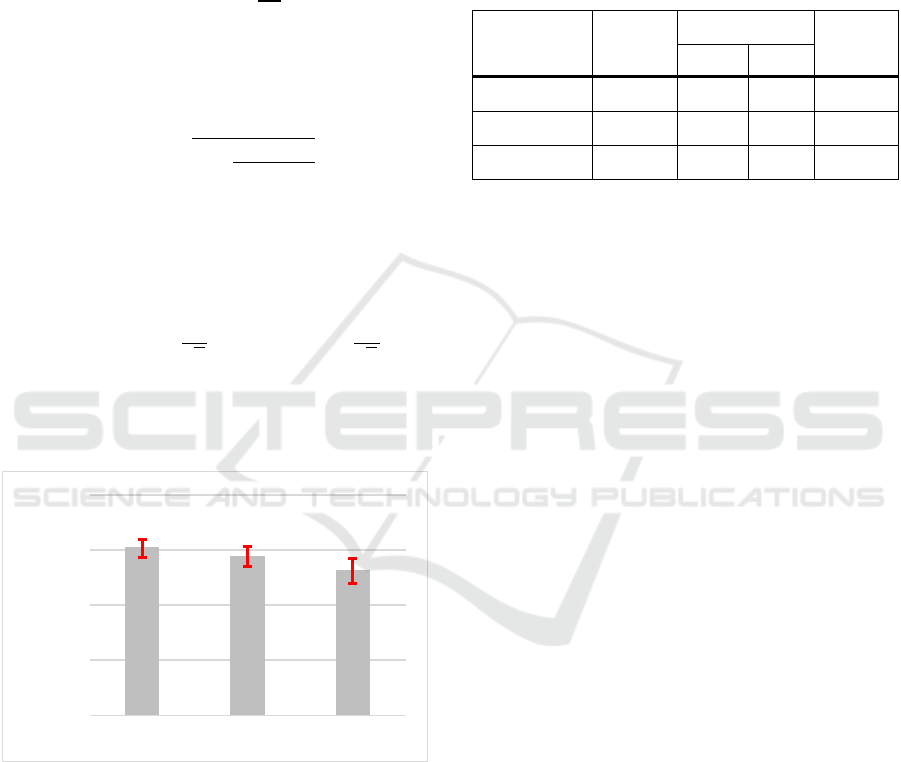
1.67 for N = 60. Figure 2 illustrates
the obtained results for the overall viewing
experience.
Figure 2: Mean Opinion Scores with 90% confidence
intervals for the overall viewing experience (Q3).
The Irusu device yielded the highest MOS ≈ 4.03
(excl. one outlier), followed by Music Joy
(MOS ≈ 3.88, excl. four outliers) and GetCardboard
(MOS ≈ 3.61, excl. three outliers). These values are
found in the upper part of the ACR scale, close to
good. Indeed, their magnitude is in agreement with
the immersiveness-related results reported by Di
Stefano and Battisti (2017). The confidence interval
of GetCardBoard overlaps with the other intervals,
which makes a clear distinction towards the other two
devices questionable. Yet, the confidence intervals
for Irusu and Getcardboard do not overlap, as seen in
Table 4. This implies that the overall rating of the
Irusu device can be considered significantly better
than that of Getcardboard with 90% confidence.
Table 4: Number of outliers, 90% confidence intervals and
SOS for the overall viewing experience (Q3).
Device
No. of
outliers
90% Conf. Int.
SOS
From To
Irusu 1 3.87 4.20 0.76
Music Joy 4 3.70 4.06 0.80
Getcardboard 3 3.39 3.84 1.03
Table 4 also reveals differences in SOS, representing
variations in the ratings. Indeed, the Irusu ratings had
the least variations, followed by those of Music Joy
and Getcardboard, which obviously had the largest
spread of user ratings of the overall QoE.
A complete set of statistics for the three devices
regarding Q1–11 are found in the Appendix.
5.2 Percents of Good or Better (%GoB)
and Poor or Worse (%PoW)
The N opinion scores {OS
1
, OS
2
… OS
N
} per question
and device have a discrete density
𝑓:
∑
𝑓
𝑂𝑆𝑖
1
(4)
The Percent of Good or Better (%GoB; ITU-T P.910,
2008) denotes the share of users that ranked at least
“good” on the ACR scale:
%𝐺𝑜𝐵 𝑓
4
𝑓
5
(5)
Likewise, the Percent of Poor or Worse (%PoW; ITU-
T P.910, 2008) denotes the share of users that ranked
at most “poor” on the ACR scale:
%𝑃𝑜𝑊 𝑓
1
𝑓
2
(6)
Table 5 shows the corresponding results. It is obvious
that the Irusu device has most users that rated good or
better. This share is reduced for Music Joy and
Getcardboard, but even in the latter case above 50%.
On the other hand, only one user has rated Irusu poor
or worse, while that percentage grows for Music Joy
and reaches 23% for Getcardboard.
1
2
3
4
5
Irusu MusicJoy Getcardboard
MOSwith90%CI
SIGMAP 2020 - 17th International Conference on Signal Processing and Multimedia Applications
118
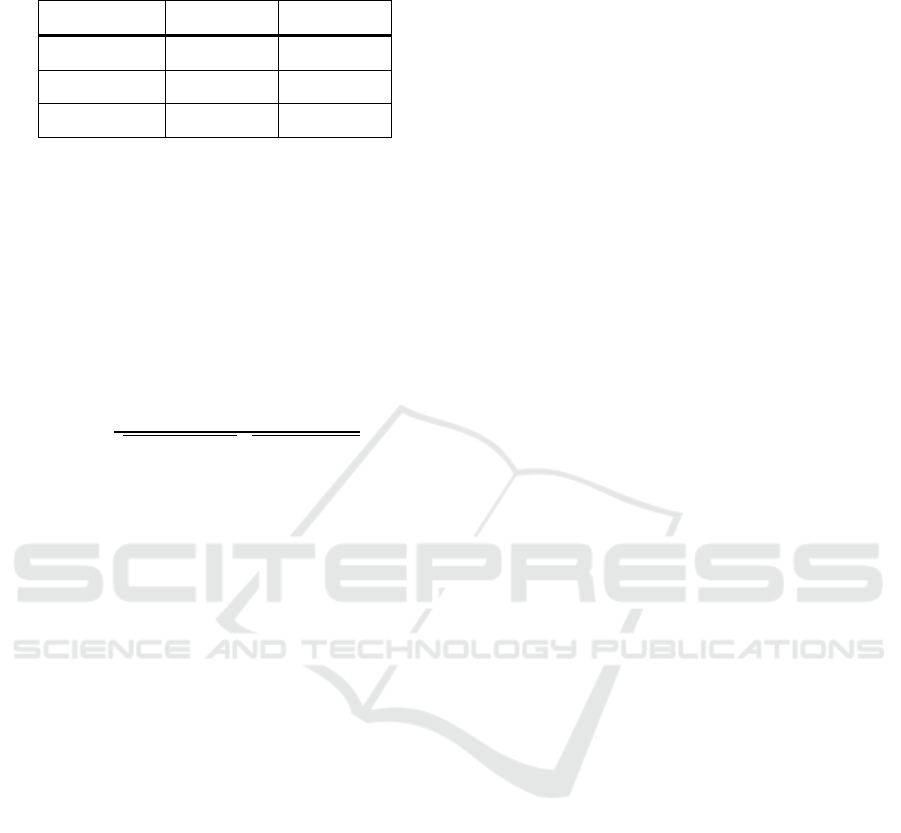
Table 5: Percents of Good or Better and Poor or Worse for
the overall viewing experience (Q3).
Device %GoB %PoW
Irusu 77% 2%
Music Joy 67% 7%
Getcardboard 57% 23%
Thus, along with the MOS, we can clearly see that
the users appreciate Irusu the most, followed by Music
Joy and Getcardboard. Most of the unsatisfied users
reported issues in handling the device and blurry
pictures.
5.3 Correlations
In the sequel, we are investigating Pearson
Correlation Coefficients
𝑟
∑
∑
∙
∑
(7)
that quantify ties between questions Qk and Ql (𝑘,𝑙 ∈
1,2…11
, as shown in Table 2).
Figures 3–5 show the correlation matrix charts for
the three devices, with fields corresponding to
questions Q1–Q11 from left to right, and from top to
bottom. While the fields on the diagonal illustrate the
distribution of the opinion scores (as used in
Section 5.2), the fields above the diagonal (in the
upper right triangle) contain the values r
kl
= r
lk
and an
indication of their significance level (*: p < 0.05; **:
p < 0.01; ***: p < 0.001) The fields below the
diagonal (in the lower left triangle) illustrate bivariate
scatter plots with least square fits of polynomials. We
will primarily focus on the strongest and most
significant correlations.
Starting with the Irusu device (Figure 3), we
observe mid-size positive correlations between Q5
(real-world experiences) and Q6 (place visited), as
well as between the comfort-related questions Q1/2
and Q7 (being inside the environment). Obviously,
comfort and presence features tend to go hand-in-
hand. It is also interesting to see a mid-size negative
correlation between Q5 and Q11 (adjustment),
meaning that the latter interactivity- and handling-
related issues had a negative impact on presence.
In the case of Music Joy (Figure 4), we observe
mid-size positive correlations within and between the
groups of comfort- and presence-related questions
(Q1–Q2, Q5–Q7) as well as the overall QoE rating
(Q3). Thereby, the strongest positive correlations
appeared between Q5 and Q6 and between Q5 and
Q3. On the other hand, Q4 (aiming at distraction)
correlates negatively with the above questions.
Obviously, there are rather strong ties between
comfort, overall rating, and presence (focus).
Finally, in the case of Getcardboard (Figure 5), we
observe a similar correlation pattern as compared to
Music Joy, however with even stronger positive
correlations between Q1–Q2 (comfort), Q3 (overall
rating) and Q5–Q7 (presence). One potential reason
lies in the stronger variations of the (Q3-related)
ratings for Getcardboard, pointing at the more
dispersed perception of different users, but with a
trend to judge above questions Q1–Q3/Q5–Q7 in
similar ways, i.e. either high or low.
For all devices, the negative mid-size correlation
between these questions and Q11 also provides
indications that the need for frequent adjustments
reduces the comfort, presence, and overall ratings.
Finally, we are considering the group of weak
(and less significant) correlations for any type of
device. Questions Q8 (awareness of surroundings),
Q9 (use of the control button), Q10 (impact of the
control button, only for Irusu) belong to this group.
Obviously, the presence of a control button (as
provided by Irusu) does not contribute much to
comfort, presence, and overall ratings.
5.4 Subjective Feedback
In their answers to Q16, many users appreciated the
fidelity of experience compared to real experience in
the 360-degree videos. Some users complained about
the lens quality. In the Music Joy device, the angle of
vision was considered narrow. Some information
popups encountered in 360-degree videos do not open
at expected locations (which is, however, a typical
phenomenon in 360-degree videos, and not specific
to these devices).
There was some confusion regarding the
interaction interface, where to click, and what
information the users would receive. Also, there was
some confusion in using the interface (e.g. whether
the button needs to be pressed once or twice) for
opening popups.
None of the users reported headaches dizziness or
nausea.
6 CONCLUSIONS
This study set out to investigate the Quality of
Experience of three low-cost VR cardboard devices,
through which a user can experience 360-degree
videos on a smartphone, running the Google
Quality of Experience of 360-degree Videos Played in Google Cardboard Devices
119
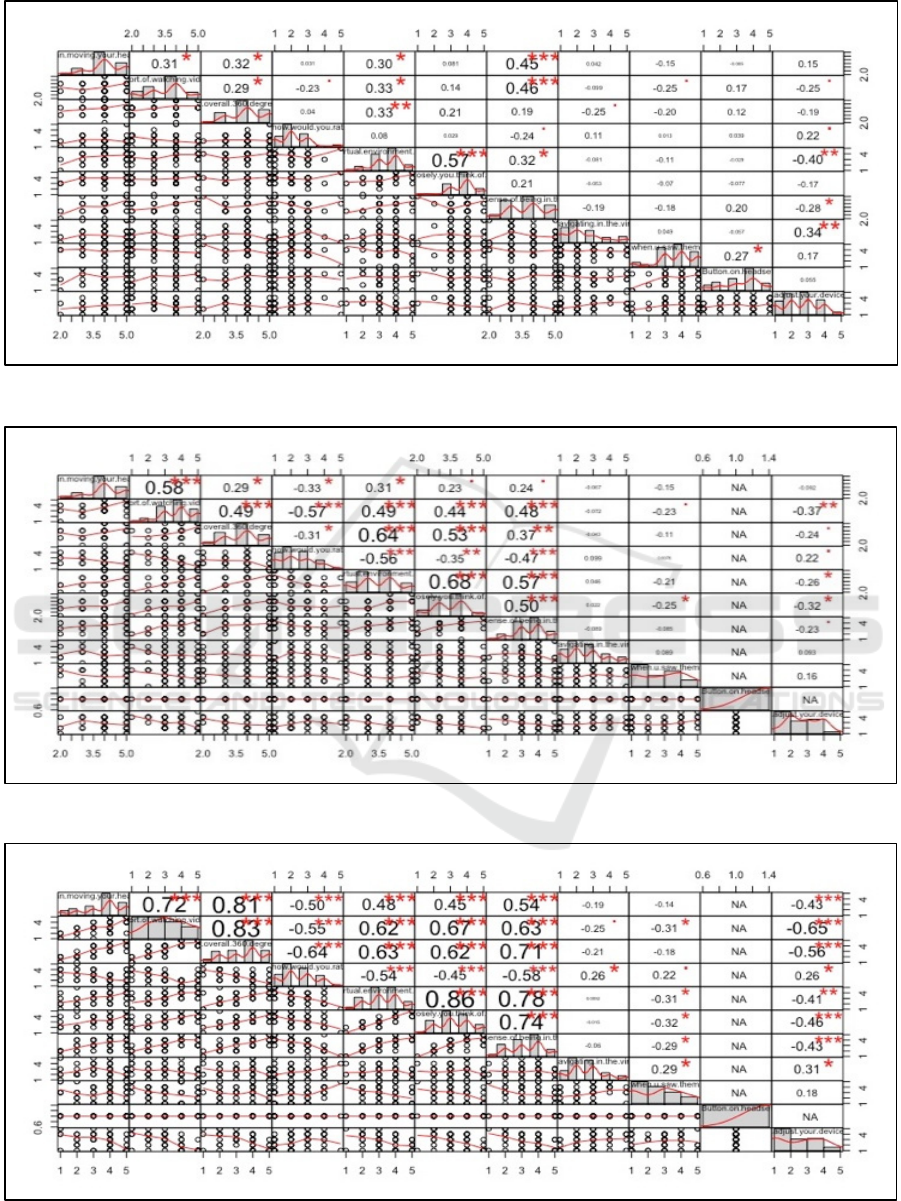
Figure 3: Correlation chart matrix for Irusu, questions Q1–11 (from left to right/top-down).
Figure 4: Correlation chart matrix for Music Joy, questions Q1–11 (from left to right/top-down).
Figure 5: Correlation chart matrix for Getcardboard, questions Q1–11 (from left to right/top-down).
SIGMAP 2020 - 17th International Conference on Signal Processing and Multimedia Applications
120

Cardboard app. N=60 users watched a scenic movie
for one minute and answered 16 questions (of which
11 were of quantitative nature) per device.
The results in terms of Mean Opinion Scores
reveal an overall good(-to-fair) experience, as it was
even observed in earlier work by Di Stefano and
Battisti (2017), with some partly significant
differences between the devices. While the top-
ranked device had a majority of Good-or-Better
(GoB) ratings, the lowest-ranked device had a
significant amount of Poor-or-Worse (PoW) ratings,
and more variability in the user ratings as such.
Considering the correlations between the 11
quantitative questions, it becomes obvious that
comfort, presence and overall assessment go hand-in-
hand with each other, while interactivity is of minor
relevance.
The factors with high positive correlations with
the overall MOS are User Comfort and Presence,
which positively boosted the user’s QoE. Low scores
due to unclear video quality caused by suboptimal
lenses were reported by users. Interactivity features
were either missed in the devices or reported to be
confusing.
We expect that our results can provide interested
stakeholders and in particular organizations that are
distributing these boxes for educational,
entertainment and gaming purposes with a view of the
overall quality perception, relationships between key
features, and a method of how to evaluate various
boxes as a basis for decisions which device to use for
a specific task: Upon introducing a user to the
cardboard devices of interest, the watching-and-
rating task and the questionnaire, the user experiences
one (or more) 360-degree video(s) per device. The
recorded opinion scores are analyzed with particular
focus
on MOS, SOS, confidence intervals and
correlations, as well as on subjective ratings. This
way, we obtain both quantitative and qualitative
indications about eventual superiority of devices and
impacts of the underlying factors.
Future work may address a study of additional
contents, features and factors, leading to further
generalization and a deeper understanding of our
results and findings.
ACKNOWLEDGEMENT
The user experiments were conducted at Tarento
Technologies Bangalore with explicit consent of the
users and the company.
REFERENCES
AuRAVR, Google Cardboard App on Apple Store, 2019.
https://apps.apple.com/app/id987962261
Berg, K., Larsson M., Lindh, F., Reimertz, P., Söderström,
B., 2016. Different Perspectives an immersive
experience using 360° video and Google Cardboard,
The 12
th
Student Interaction Design Research
Conference, Malmö, Sweden, http://publications.lib.
chalmers.se/records/fulltext/234852/local_234852.pdf
Choi, K., Yoon, Y. -J., Song, O.-Y., and Choi, S.M., 2017.
Interactive and Immersive Learning Using 360° Virtual
Reality Contents on Mobile Platforms. Mobile
Information Systems, Article ID 2306031.
https://doi.org/10.1155/2018/2306031.
Di Stefano, C. and Battisti, F., 2017. Caravaggio in Rome:
A QoE-based proposal for a virtual gallery, 2017.
3DTV Conference: The True Vision - Capture,
Transmission and Display of 3D Video (3DTV-CON),
Copenhagen, pp. 1–4.
Google Cardboard Inspired Virtual Reality Kit, 2019.
https://auravr.com/products/20-google-cardboard
inspired-virtual-reality-kit-do-it-yourself.html
Hossfeld, T., Schatz, R., Egger-Lampl, S., 2011. SOS: The
MOS is not enough!, 2011 3rd International Workshop
on Quality of Multimedia Experience, (QoMEX) pp.
131-136. DOI 10.1109/QoMEX.2011.6065690.
Huyen, T., Ngoc, N.P., Pham, C. T., Jung, Y. U., Thang,
T.C., 2019. A Subjective Study on User Perception
Aspects in Virtual Reality. Applied Sciences, 9. DOI
10.3390/app9163384.
Irusu VR Cardboard Box, 2019. https://irusu.co.in/
product/irusu-google-cardboard/.
ITU-T Recommendation P.910, 2008. Subjective video
quality assessment methods for multimedia
applications. https://www.itu.int/ITU-T/recommenda
tions/rec.aspx?rec=9317&lang=en
Klein, M., 2017. Google Cardboard: Virtual Reality on the
Cheap, but It Is Any Good? https://www.
howtogeek.com/221364/google-cardboard-virtual-
reality-on-the-cheap-but-is-it-any-good/
Le Callet, P., Möller, S., and Perkis, A., 2013. Qualinet
White Paper on Definitions of Quality of Experience.
European Network on Quality of Experience in
Multimedia Systems and Services (COST Action IC
1003). Available at http://www.qualinet.eu.
Lee, S., Sergueeva, K., Catangui M., and Kandaurova, M.,
2017. Assessing Google Cardboard virtual reality as a
content delivery system in business classrooms.
Journal of Education for Business, 92, pp. 1–8. DOI
10.1080/08832323.2017.1308308.
Music Joy VR Cardboard Box, 2019. https://www.
amazon.in/Music-Virtual-Reality-
GlassesAndroid/dp/B07M7973KP
Narciso, D., Bessa, M., Melo, M., Coelho, A., Vasconcelos-
Raposo, J, 2019. Immersive 360° video user
experience: impact of different variables in the sense of
presence and cybersickness. Universal Access in the
Information Society, 18, pp. 77–87.
Quality of Experience of 360-degree Videos Played in Google Cardboard Devices
121
Rupp M. A., Odette K. L., Kozachuk J., Michaelis J. R.,
Smither J. A., McConnell D. S., 2018. Investigating
learning outcomes and subjective experiences in 360-
degree videos. Computers & Education, 128, pp. 256–
268, https://doi.org/10.1016/j.compedu.2018.09.015.
Schlögl, S., Bergmann, M., Eder, V., Achleitner M., and,
Evangelatos, P., 2017, “Google Cardboard in Social
Science Research -- Exploring Low-cost Virtual Reality
and its Potential,” Proceedings of the Forschungsforum
der Österreichischen Fachhochschulen, pp. 814–818.
Slater G. M. and Wilbur, S., 1997. A Framework for
Immersive Virtual Environments (FIVE): Speculations
on the Role of Presence in Virtual Environments.
Presence: Teleoperators and Virtual Environments, 6,
https://doi.org/10.1162/pres.1997.6.6.603.
Slater, M., 1999. Measuring presence: a response to the
Witmer and Singer presence questionnaire. Presence:
Teleoperators and Virtual Environments, 8, pp. 560–565.
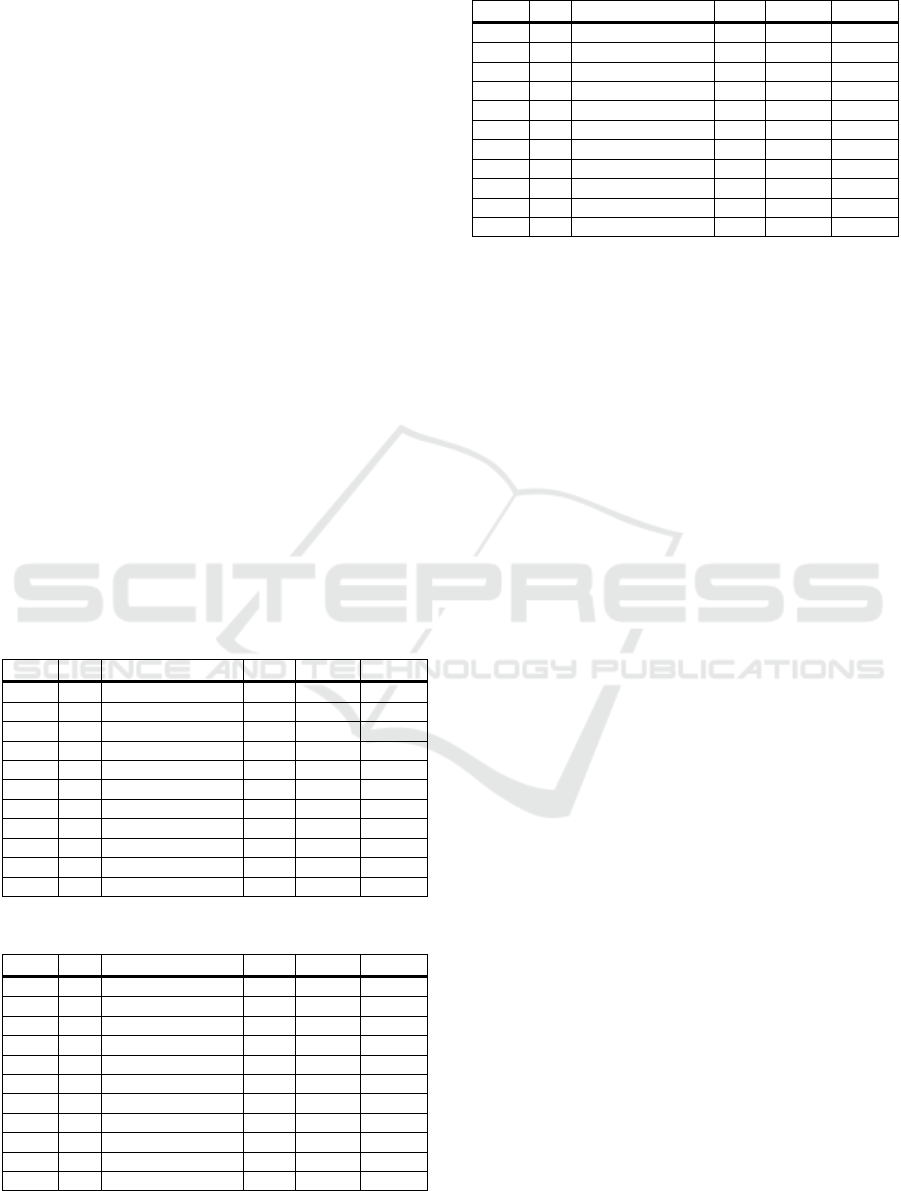
APPENDIX
In Tables 6 to 8, a complete set of statistics for the
three devices are presented. N
o
denotes the number of
outliers to be removed, before MOS and SOS are
calculated. %GoB and %PoW are merely applicable
to questions with the ACR scale, cf. Table 2, and Q10
relates to an interaction feature that only the Irusu
device has to offer.
Table 6: Statistics for device “Irusu”, Q1–11.
Q# N
o
MOS and 90% CI SOS %GoB %PoW
Q1 2 4.14 [3.99; 4.28] 0.66 82% 3%
Q2 0 3.58 [3.39; 3.78] 0.91 60% 15%
Q3 1 4.03 [3.87; 4.20] 0.76 77% 2%
Q4 2 2.09 [1.92; 2.25] 0.76 N/A N/A
Q5 1 3.61 [3.43; 3.79] 0.81 57% 10%
Q6 2 3.88 [3.74; 4.02] 0.65 70% 3%
Q7 4 3.88 [3.70; 4.06] 0.80 62% 7%
Q8 6 2.13 [1.92; 2.34] 0.93 18% 62%
Q9 5 3.86 [3.66; 4.05] 0.85 N/A N/A
Q10 0 3.32 [3.06; 3.57] 1.19 53% 25%
Q11 2 2.53 [2.31; 2.76] 1.03 N/A N/A
Table 7: Statistics for device “Music Joy”, Q1–11.
Q# N
o
MOS and 90% CI SOS %GoB %PoW
Q1 3 4.16 [4.01; 4.30] 0.65 82% 5%
Q2 5 3.95 [3.78; 4.12] 0.76 63% 8%
Q3 4 3.88 [3.70; 4.06] 0.80 67% 7%
Q4 1 2.29 [2.07; 2.51] 1.00 N/A N/A
Q5 0 3.48 [3.28; 3.69] 0.95 50% 17%
Q6 0 3.45 [3.28; 3.62] 0.79 50% 12%
Q7 1 3.61 [3.42; 3.80] 0.87 55% 12%
Q8 5 2.36 [2.14; 2.59] 0.99 22% 52%
Q9 0 2.87 [2.57; 3.17] 1.38 N/A N/A
Q10 - N/A N/A N/A N/A
Q11 2 2.83 [2.60; 3.06] 1.04 N/A N/A
Table 8: Statistics for device “Getcardboard”, Q1–11.
Q# N
o
MOS and 90% CI SOS %GoB %PoW
Q1 5 3.82 [3.60; 4.04] 0.96 63% 20%
Q2 0 3.18 [2.92; 3.44] 1.20 40% 30%
Q3 3 3.61 [3.39; 3.84] 1.03 57% 23%
Q4 1 2.44 [2.23; 2.66] 0.99 N/A N/A
Q5 2 3.40 [3.19; 3.60] 0.94 45% 22%
Q6 1 3.37 [3.16; 3.58] 0.96 43% 22%
Q7 2 3.41 [3.20; 3.62] 0.96 48% 23%
Q8 4 2.43 [2.23; 2.63] 0.91 18% 50%
Q9 0 2.77 [2.47; 3.06] 1.37 N/A N/A
Q10 - N/A N/A N/A N/A
Q11 0 2.62 [2.33; 2.91] 1.34 N/A N/A
SIGMAP 2020 - 17th International Conference on Signal Processing and Multimedia Applications
122
