
Statistical Model Checking of Distributed Programs within SimGrid
Marie Duflot-Kremer and Yann Duplouy
Université de Lorraine, CNRS, Inria, LORIA, F-54000 Nancy, France
Keywords:
Stochastic Distributed Systems, Distributed Programs, Statistical Model Checking, SimGrid, Simulation.
Abstract:
In this paper, we present an approach to perform statistical model-checking over stochastic distributed pro-
grams using the SimGrid framework. The distributed programs are modeled using SimGrid, a fast and
lightweight framework for the simulation of distributed programs, which we have enhanced in three ways:
a cleaner description of the probabilistic evolution of the capacities of resources, a centralized random number
generator, and a protocol for the observation of the simulations. We also propose a toolset for the statistical
model-checking of those simulated distributed programs, and in particular a prototype tool SimGridStatMC.
The toolset is illustrated to evaluate various properties of an implementation of the peer to peer BitTorrent
protocol.
1 INTRODUCTION
Distributed systems are, by definition, interesting and
complex to study. Indeed, their complexity relies not
only on the program run by different agents, but also
(and mainly) on the architecture of the system, the
communication between these agents and their het-
erogeneity. It therefore raises new questions and their
verification necessitates techniques that can scale to
very large systems.
SimGrid(Casanova et al., 2014) is a framework for
developing simulators of distributed applications. By
emulating both the application to run and the environ-
ment (network capacity, computing power of different
nodes,...) it enables to evaluate the appropriateness of
different algorithmic solutions, to measure their scal-
ability or to dimension a network to achieve a given
task. SimGrid is by design fast and lightweight in
terms of memory, which enables to simulate a quite
large network quickly and on a single machine.
Prior to this work, using SimGrid required a very
precise specification of the behavior of the distributed
system. For example, in the case of networks, we had
to know precisely when and how the bandwidth of the
different link would vary with time, but also whether
a server becomes unavailable or when its speed re-
duces. The precise description both of the program to
run and of the environment is a necessary requirement
to get realistic and reproducible simulations.
On the opposite, in order to verify a system, we
need to take into account all possible executions of
the program. These include possible modifications of
the computation time (due to a change in the workload
of a node), of the transmission delays (due to changes
in the amount of traffic in the network) and failures.
Work has already been done to add model checking
possibilities into SimGrid for both safety (something
bad will never happen) (Merz et al., 2011) and live-
ness (something good will eventually happen) (Guth-
muller et al., 2018), but so far for non probabilistic
systems. Such a verification necessitates (upper and
lower) bounds for parameters that can vary, e.g trans-
mission delays. Model-checking can then be applied
to this non deterministic system to check for exam-
ple if a computation can be done in a given amount of
time/memory.
A hurdle for this model-checking approach is that,
in many cases, there exist a (worst) case where the
goal is not met. For example if the application con-
tains deadlines, there is a possibility where the net-
work and/or a node are too slow to meet the deadline
and the answer to the question: will the message ar-
rive before the deadline is "no". Knowing that a bad
interleaving of actions can happen is in general not
sufficient, and it is interesting to get information about
how likely such an event is to happen, and thus insert
probabilities in the model and use methods that can
handle such probabilities to verify/evaluate our sys-
tem.
There are two main approaches for the model-
checking of stochastic models:
• The numerical approach, based on matrix calcu-
lus, is giving precise results (albeit sensitive to
Duflot-Kremer, M. and Duplouy, Y.
Statistical Model Checking of Distributed Programs within SimGrid.
DOI: 10.5220/0009875302330239
In Proceedings of the 10th International Conference on Simulation and Modeling Methodologies, Technologies and Applications (SIMULTECH 2020), pages 233-239
ISBN: 978-989-758-444-2
Copyright
c
2020 by SCITEPRESS – Science and Technology Publications, Lda. All rights reserved
233

numerical errors) but is requiring strong proba-
bilistic hypotheses and, as it stores the transition
relation for the whole system, requires a lot of
memory and is subject to combinatorial explo-
sion, which makes it impossible to use on large
systems such as realistic distributed systems.
• The statistical approach, based on Monte Carlo
simulations, has fewer restrictions and can handle
very large systems as it only requires a running
model. It is also easy to parallelize and a good ap-
proach for large systems. The counterpart is that
it only gives approximated results together with
a confidence level, and it requires a specific han-
dling for rare events.
Several tools already exist to perform both ap-
proaches of probabilistic model-checking. The most
popular by far is PRISM(Kwiatkowska et al., 2011).
It can perform both numerical and statistical model-
checking on systems modeled as (variants of) Markov
chains or probabilistic automata.
However, none of the existing tools is particularly
suited to handle network communication issues, and
from a practical point of view, using these require
a formalisation of the distributed program; SimGrid
allows for a faster conversion of an already imple-
mented distributed program to a simulator.
For this paper, since we aim at handling large
distributed systems, only the statistical approach is
doable. Furthermore, this approach has two advan-
tages. First, it makes it possible to benefit from the
power of SimGrid, that will be used to run simu-
lations. Second, our integration of our tool in this
framework makes a new verification approach avail-
able to Simgrid users.
2 STOCHASTIC MODELING AND
STATISTICAL
MODEL-CHECKING
In order to use the SimGrid platform to perform statis-
tical model-checking of distributed systems, we need
to enhance it with stochastic aspects and develop a
method that combines SimGrid and statistical tools
to evaluate the properties we want to consider. In
this section, we first explain how SimGrid has been
extended to neatly model stochastic distributed pro-
grams running in a stochastic environment (with a
probabilistic occurence of failures), and we then de-
scribe our statistical model-checking approach.
Original SimGrid Models. In a SimGrid model,
the distributed program and its associated distributed
system are usually described using three components:
• The actors, written in C++, are subprograms that
execute a task of the distributed program;
• The platform, usually a XML file, contains the in-
formation of each node and each link;
• The deployment, usually a XML file, associates
nodes with one of the actors.
We furthermore suppose that the developer of the
model uses the «SimGrid for you»
1
interface. Using
this interface, a simulator can be built in C++ by de-
scribing the actors with C++ classes, including Sim-
Grid librairies, initializing a SimGrid Engine object,
loading the platform file, and then loading the deploy-
ment file, and finally starting the simulation through
the SimGrid Engine object.
So far, it was possible to describe stochastic dis-
tributed programs by adding probabilities directly, via
C++ statements, to the actors. Concerning platform
and deployment files, the XML description files do
not have any field for stochastic descriptions. Prob-
ability distributions on bandwith or computational
power could be added by describing the whole plat-
form directly within the C++ main, which would re-
quire recompiling the simulator each time you want to
change the distributions. As it is a cleaner approach
to have platform and deployment files separated from
the C++ simulator code, we chose to use already ex-
isting SimGrid profiles meant to describe temporal
changes, and modify them to allow stochastic descrip-
tions.
A profile can be associated to each parameter of
a node or a link (such as the bandwidth or computa-
tional power) and describes the evolution of the pa-
rameter over time. The following profile could de-
scribe a latency that during the first second is set to its
default value (described in the platform file), then at
time 1 changes to 3ms and at time 3 seconds rises to
15ms.
1 0.003
3 0.015
The LOOP keyword can be added at the end of
the profile with the number of seconds to wait before
looping. If LOOP 2 is added to the previous file, then
the profile is reset after 5 seconds, setting it back to
the default value, then the latency at 6 seconds would
change back to 3ms, and after 8 to 15ms and so on.
Stochastic Profiles. We have enhanced SimGrid
with stochastic profiles which allow the user to eas-
ily model probabilistic aspects, such as for example
1
See https://simgrid.org/doc/latest/app_s4u.html
SIMULTECH 2020 - 10th International Conference on Simulation and Modeling Methodologies, Technologies and Applications
234

failures of the nodes. To do so we replace the de-
terministic times and values of the profiles with stan-
dard probability distributions. The STOCHASTIC key-
word must be added at the beginning of the profile,
then each line contains, separated by spaces, the time
distribution (either DET, UNIF, NORMAL or EXP), then
the parameters of the time distribution, then the value
distribution, and finally the parameters of the value
distribution. The following profile describes a param-
eter, e.g. a latency, that for the two first seconds is
set to its default value. At time 2 a new value for the
latency is drawn uniformly between 10ms and 20ms,
then a time instant t is drawn accordingly to an expo-
nential law of mean
1
0.05
and at time 2 + t the latency
drawn according to the normal law of mean 45ms and
standard deviation 5ms. Finally, at time
2
2 + t + 10,
the latency is drawn following to an exponential law
of mean
1
20
.
STOCHAST I C
DE T 2 U N IF 0. 0 10 0.02 0
EX P 0.0 5 N ORMAL 0.0 4 5 0 .00 5
DE T 10 EX P 20
As for non stochastic profiles, is possible to loop
a stochastic profile by adding the LOOP keyword after
STOCHASTIC. In that case, the last drawn time will be
used as a base for the loop. In the case of our example
of stochastic profile, at time 2+t +10+2, the latency
is drawn again according to the uniform law, due to
the looping of the profile.
Observed Variables and Protocol for Simulation
Observation. Before building tools to perform sta-
tistical model-checking, we introduce a protocol for
the observation of the simulation. The tool will com-
municate with the simulator, listening for a number
of observed variables that are defined for the study by
the SimGrid user, and controlling whether the simula-
tion should continue or not. These observed variables
must be initialized before the start of the simulation,
and their value may be modified by the actors during
the simulation. The communication with the simula-
tor is done by hooks on SimGrid signals; these signals
are sent at key moments of the simulation (start, end,
completion of a step). At each step of the simulation,
a line composed of the current time and the value of
each observed variable is sent to our tool; then the
simulator waits for the reply of our tool, i.e. whether
it should or not continue the simulation.
2
Note that we don’t handle time between changes as in
the original profiles that were specifying the time instants of
the changes since the start of the simulation (or of the loop).
Here, to avoid overlap of time intervals, the timing values
sampled denote the delay between two changes.
Randomness in SimGrid. SimGrid is meant to per-
form reproducible simulations of a distributed pro-
gram, yet we need different executions in order to
perform a statistical analysis. We also want to keep,
as best as we can, the reproducibility of the statisti-
cal analysis. In the SimGrid framework, the simula-
tions are made using the standard library’s Mersenne-
Twister random number generator. Calls from both
the actors (in the case of a stochastic distributed pro-
gram) and the generation of events from the profile
are redirected to the unique Mersenne-Twister ran-
dom number generator.
When performing multiple simulations in a row,
at the end of each simulation the current state of the
generator is saved to a file, to be read at the start of
the next simulation. Moreover, in the case of paral-
lel simulations, the first batch of executions is per-
formed by seeding the generator with consecutive in-
tegers. These two practices should ensure that the ran-
dom number generation avoids biases in the statistical
evaluation.
HASL. We now introduce the formalism that we
use for the statistical model-checking toolset that will
be introduced in the next paragraph. It comes from
the statistical model-checker Cosmos (Ballarini et al.,
2015) and is called the Hybrid Automata Stochas-
tic Language. A HASL formula consists of two el-
ements:
• First, an hybrid automaton that synchronizes with
the execution of the observed program (or more
generally of a Discrete Event Stochastic Process).
It permits both to select relevant paths and to
maintain indicators, using data variables evolving
along the path and the observed variables of the
distributed program;
• Second, an expression based on the data variables,
that describes the quantity to be evaluated. These
expressions include path operators, such as the
minimum and maximum values reached during an
execution, the last value, the integral over time or
the time average.
Note that the performance indices corresponding to
these expressions are conditional expectations over
the successful paths of the hybrid automaton. More
precisely, the results of the simulation count in the
computation of the value of the expression only if the
automaton reaches a final state during the execution.
Since we cannot in our tool synchronize with the sim-
ulator as precisely as we would with the Cosmos mod-
els, we have added rejecting states. If such a state is
reached, the simulation is ignored. This is equivalent
to a failed synchronization in Cosmos.
Statistical Model Checking of Distributed Programs within SimGrid
235

SimGridStatMC. In order to evaluate those ex-
pressions, we propose a prototype named SimGrid-
StatMC that performs statistical model-checking over
simulations performed with our enhanced version of
SimGrid. This prototype is based on the source of the
model-checker Cosmos, but reworked to support the
observation protocol described previously. It takes as
inputs (the path to) the executable of the simulator, the
deployment and platform files, and the file describing
the HASL formula, and other arguments that depend
on the statistical procedure being used.
As other statistical model-checking tools, Sim-
GridStatMC generates paths and relies on statistical
results to evaluate the precision of the value com-
puted. Our tool uses confidence interval, that aims at
establishing an interval for possible values of the pa-
rameter to estimate, together with a confidence level
for the parameter to really lie in that interval. For
confidence interval estimate, several methods can be
used:
• The Chernoff-Hoeffding bound (Hoeffding,
1963), for the estimation of the expectation of
a bounded random variable, requires two out of
three related parameters, and determines the third
one from the two others: the interval width, the
confidence level and the number of samples. This
procedure outputs a confidence interval whose
width satisfies the requirement and where the
probabilistic guarantee is exact;
• The Chow-Robbins bounds (Chow and Robbins,
1965), that applies to the estimation of a random
variable where no known bound is available. It re-
quires two parameters: the interval width and the
confidence level, and outputs a confidence interval
with the correct width. The number of simulations
is not precomputed; instead, the confidence inter-
val is computed regularly until it is small enough.
The number of samples will depend on the vari-
ability of the values obtained while performing
simulations.
Python Scripts. For some tasks (such as obtaining
a histogram of the different values of a HASL expres-
sion over a path), we prefer to use dedicated python
scripts. The general idea is unchanged: we start sev-
eral simulations in parallel, starting a new simulation
after the last one has completed, then gather the re-
sults at the end of each simulation, until the chosen
end condition is satisfied (for example, the number of
simulations).
Biases. Launching several simulators in parallel and
gathering the results at the end of each simulation may
introduce a bias in favor of the fastest simulations.
If the SimGrid model may have greatly varying ex-
ecution times, the slowest simulations are likely to be
still running and ignored when the tool reaches the
chosen end condition and all remaining simulations
are halted, resulting in some long simulations being
ignored in the computation of the result. However,
the number of ignored simulations is strictly lower
than the number of parallel simulations, in our case
32 maximum.
Repository. This toolset is available as a git repos-
itory at: https://framagit.org/pikachuyann/simgrid-
statmc/
3 CASE STUDY: BitTorrent
In order to illustrate the variety of properties that can
be evaluated using our approach, we apply it to a
stochastic SimGrid model, more precisely a model of
the BitTorrent protocol.
BitTorrent. BitTorrent (Cohen, 2008) is a peer-to-
peer protocol for distributing files. It is thus not a
big server that distributes the file to all nodes, but it
is the nodes themselves who exchange parts of the
file depending on the progress of their own download.
One particular node, called the tracker, maintains the
list of peers currently participating in the protocol,
and communicates a randomly chosen
3
list of peers to
each peer that connects and requests it. The peers are
usually distinguished by whether they already have
the full file (in which case they are called seeders) or
not (in which case they are called leechers). Finally,
the order in which pieces are requested to other peers
and then downloaded is also chosen randomly.
We have decided for our experiments to use a
100MB file divided in 100 pieces of 1MB each, with
76 peers (initially including one seeder), a 1MB/s
download and upload speed for each peer (which is
similar to the file used in (Testa et al., 2012)). Our
model is the BitTorrent example included in the Sim-
Grid distribution, that has been made more resilient to
unavailability of peers in order to measure the impact
of failures on the completion time, and now also sup-
ports a larger number of pieces. We consider that the
peers attempt to download a piece in one go. The ex-
3
More precisely, if there are more than n nodes known
by the tracker (usually, n = 50), a randomly chosen list of n
nodes is sent to the requesting peer; otherwise the entire list
is sent to the requesting peer.
SIMULTECH 2020 - 10th International Conference on Simulation and Modeling Methodologies, Technologies and Applications
236
periments are performed on nodes of Grid-5000, with
32 simulators being launched in parallel.
Experiments. In the first experiment, we measure
the average completion time without node failure. We
halt the simulations when the confidence interval has
reached a 0.5% relative width, with 99% confidence
level. In this case, we measure an average comple-
tion time of 1236.36 seconds (with a confidence in-
terval [1233.28;1239.47]), over 1213 simulations per-
formed within 533 seconds. We also measure the
mean download time for a peer which is 951.96 sec-
onds ([950.28;953.66]).
number of completed downloads
time
600s
700s
800s
900s
1000s
1100s
1200s
1300s
0 10 20 30 40
50 60
70
76
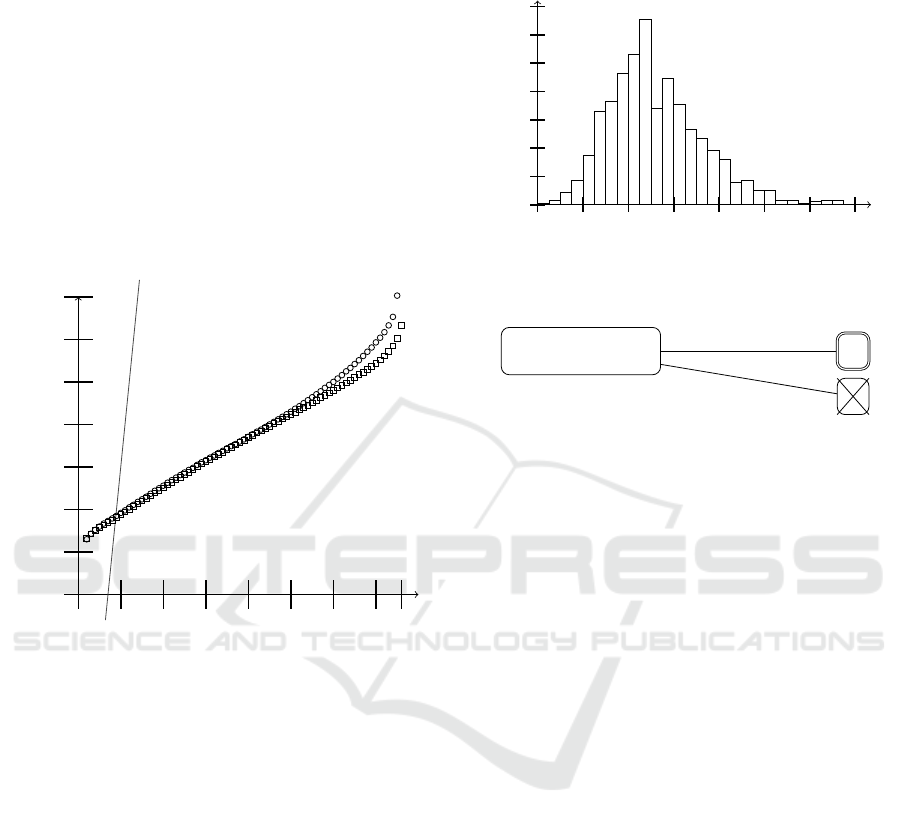
Figure 1: Average n-node completion time, out of 1,000
simulations on the standard protocol (squares) and on a vari-
ant where nodes leave as soon as their download is complete
(circles).
The graph in Figure 1 illustrates how long it takes,
depending on n, for the n fastest nodes to finish the
download. This is illustrated on two variants of the
BitTorrent protocol, the standard one (measures with
squares) and one where all peers except the seeder
stop the protocol upon completing their own down-
load (circles). The linear curve represents the time
taken for the download if all peers download directly
the file from the seeder. With our hypotheses, we see
that the peer-to-peer version becomes faster after 10
nodes. Note that for the upper curve, the 76
th
node is
missing due to very long completion time that led to
halted simulations.
In our last experiment of a system without node
failures, we produce in Figure 2 an histogram, over
1,000 simulations, of the total completion time. We
can see that the total completion time most often en-
countered lies within 1220 and 1230. Very few simu-
lations generated a completion time over 1350 and the
Completion time
Number of
simulations
0
20
40
60
80
100
120
140
1130 1170 1210 1250 1290 1330 1370 1410
Figure 2: Distribution of completion times of the BitTorrent
protocol, over 1000 simulations.
˙x = inprogress
˙
t = 1
E(LAST (x)/(nodes − seeders))
completed = nodes
t > 50000
Figure 3: HASL formula for the computation of the mean
download time.
fastest and slowest completion times are respectively
1134.62 and 1397.32 seconds.
We can measure the mean download time of a
node using the HASL formula shown in Figure3.
On this example, the variable t represents the time
(and hence evolves at constant speed 1 during the
simulation), whereas variable x counts the cumu-
lated waiting time of all the peers downloading (and
thus its evolution speed is the number of peers cur-
rently downloading). The formula E(LAST (x)) then
counts the average cumulated waiting time over a
simulation, and can be divided by the number of
non-initially seeder peers to get the mean waiting
time for a peer. One could also measure the aver-
age number of peers downloading at any time using
E(LAST (x)/LAST (t)).
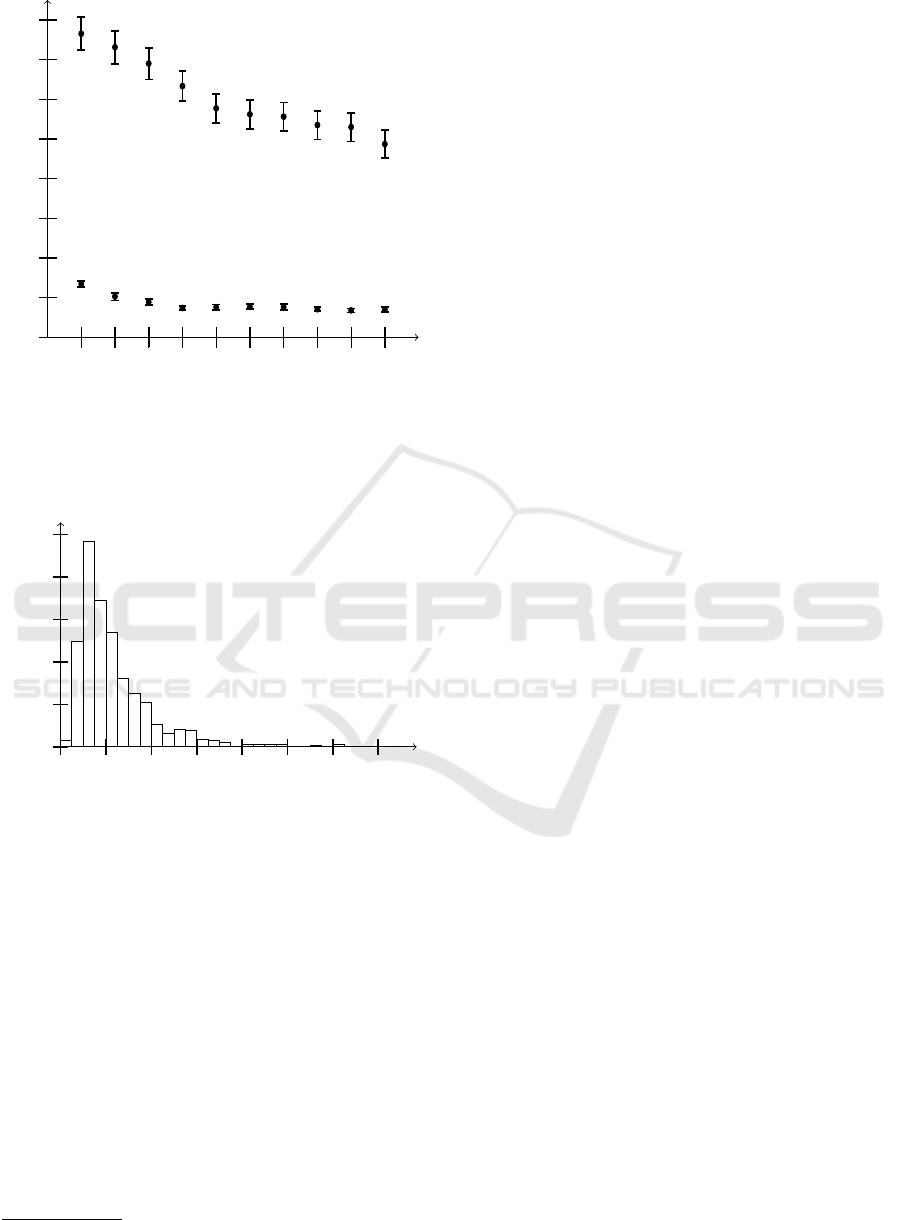
In the next experiment, we add failures to each
node, with a varying exponential rate and a fixed (10s)
repair time. We measure the completion and the mean
download time, with each a 99% confidence level and
5% relative width, with a minimum of 100 simula-
tions. Both the mean completion time for each expo-
nential and the mean download time depending on the
rate of failures are shown in Figure 4. The computation
of the mean completion time required between 421
(for the rate λ = 10000s) and 856 simulations (for the
rate λ = 3000s). For the mean download time, with
100 simulations the confidence interval was already
small enough for every value of λ.
Statistical Model Checking of Distributed Programs within SimGrid
237
failure rate λ
Completion time
Download time for one peer
1000s 2000s 3000s 4000s
5000s 6000s
7000s 8000s 9000s 10000s
900s
1000s
1100s
1200s
1300s
1400s
1500s
1600s
1700s
Figure 4: Mean completion time and mean dowload time
per peer for the BitTorrent protocol with introduced failures
with an exponential rate.
Completion time
Number of
simulations
0
50
100
150
200
250
1200 1600 2000 2400 2800 3200 3600 4000
Figure 5: Distribution of completion times of the BitTorrent
protocol with introduced failures with an exponential rate
λ = 1000s, over 1000 simulations.
In the case of a failure with an exponential rate
of λ = 1000s, we also produced an histogram of the
completion times, shown in Figure 5.
For the last experiment, we implemented a version
of super-seeding (Hoffmann, 2008), implemented in
libtorrent
4
. Super-seeding is a mode where a
unique seeder tries to minimize the amount of data
it sends. It does not announce itself as a seeder to
the other peers, but announces only one piece at a
time, announcing a different piece to each of the other
peers. Moreover, the piece announced to a node n has
been received by enough other nodes, then the super-
seeder announces a new piece to the node n. The goal
4
https://www.libtorrent.org/
is for the seeder to upload the least possible amount
of content while still sharing the entire file. We intro-
duce another observation variable, namely the num-
ber of pieces sent by the seeder. The average num-
ber of pieces sent by the seeder dropped from 189.61
without to 104.45 with super-seeding, but at the cost
of a longer completion time (3674 with super-seeding
instead of 1230).
4 CONCLUSION
In this article, we have presented how the SimGrid
framework can be used to perform statistical model-
checking of distributed programs. In particular we ex-
plained how the framework can be extended in two
ways: firstly enhancing the model with a stochas-
tic description of the capacities of a resource (the
stochastic profiles) and management of random num-
ber generation, and secondly adding indicators and
communication capabilities for the observation of a
simulation. We finally showcased these extensions
and their performance evaluation capabilities on a Bit-
Torrent model developed with the SimGrid frame-
work. We were able to compute expected times for
completion and compare different variants of the pro-
tocol, in particular super-seeding, in which less con-
tent is sent by the seeder, at the price of a longer com-
pletion time.
ACKNOWLEDGEMENTS
Experiments presented in this paper were carried out
using the Grid’5000 testbed, supported by a scientific
interest group hosted by Inria and including CNRS,
RENATER and several Universities as well as other
organizations (see https://www.grid5000.fr).
This work has been supported by IN-
RIA collaborative project IPL HAC-SPECIS:
http://hacspecis.gforge.inria.fr/
REFERENCES
Ballarini, P., Barbot, B., Duflot, M., Haddad, S., and Peker-
gin, N. (2015). Hasl: A new approach for performance
evaluation and model checking from concepts to ex-
perimentation. Performance Evaluation, 90:53 – 77.
Casanova, H., Giersch, A., Legrand, A., Quinson, M.,
and Suter, F. (2014). Versatile, scalable, and accu-
rate simulation of distributed applications and plat-
forms. Journal of Parallel and Distributed Comput-
ing, 74(10):2899–2917.
SIMULTECH 2020 - 10th International Conference on Simulation and Modeling Methodologies, Technologies and Applications
238

Chow, Y. S. and Robbins, H. (1965). On the asymptotic
theory of fixed-width sequential confidence intervals
for the mean. Ann. Math. Statist., 36(2):457–462.
Cohen, B. (2008). The bittorrent protocol specification.
http://www.bittorrent.org/beps/bep_0003.html.
Guthmuller, M., Corona, G., and Quinson, M. (2018).
System-level state equality detection for the formal
dynamic verification of legacy distributed applica-
tions. J. Log. Algebraic Methods Program., 96:1–11.
Hoeffding, W. (1963). Probability inequalities for sums of
bounded random variables. Journal of the American
Statistical Association, 58(301):13–30.
Hoffmann, J. (2008). Superseeding.
http://www.bittorrent.org/beps/bep_0016.html.
Kwiatkowska, M., Norman, G., and Parker, D. (2011).
Prism 4.0: Verification of probabilistic real-time sys-
tems. In Computer Aided Verification, pages 585–591.
Springer.
Merz, S., Quinson, M., and Rosa, C. (2011). Simgrid mc:
Verification support for a multi-api simulation plat-
form. In Bruni, R. and Dingel, J., editors, Formal
Techniques for Distributed Systems, pages 274–288,
Berlin, Heidelberg. Springer Berlin Heidelberg.
Testa, C., Rossi, D., Rao, A., and Legout, A. (2012). Ex-
perimental assessment of bittorrent completion time in
heterogeneous tcp/utp swarms. In Pescapè, A., Salgar-
elli, L., and Dimitropoulos, X., editors, Traffic Moni-
toring and Analysis, pages 52–65, Berlin, Heidelberg.
Springer Berlin Heidelberg.
Statistical Model Checking of Distributed Programs within SimGrid
239
