
Ways to Improve the Efficiency of the
Truck's Branded Service System
K. Shubenkova
a
, P. Buyvol
b
, I. Makarova
c
and L. Gabsalikhova
d
Kazan Federal University, 68/19 Mira Avenue, Naberezhnye Chelny, Russia
Keywords: Branded Service System, Dealer Service Center, Simulation Model, Statistical Data Analysis.
Abstract: The article discusses ways to improve the trucks maintenance efficiency. It is shown that only integrated
solutions will optimize the activities of the automotive corporation's branded service system (BSS). The best
solution in this situation is a decision support system (DSS) with an open architecture. The proposed method-
ology is aimed at improving the maintenance and repair system while expanding markets. Examples of de-
veloped modules applying as part of DSS, such as statistical data analysis and simulation models, are shown.
1 INTRODUCTION
The economy globalization, as well as the rapid
development of engineering and technology and
increased competition in the markets, have shortened
the launch time for new goods. High-tech products
require service during the entire life cycle, so should
ensure trouble-free operation, which implies the
responsibility of the manufacturer to the client. In the
automotive industry, this concept is implemented by
creating a branded service system (BSS). As a rule, the
system includes a network of dealer & service centers
(DSC). Regardless of format, such DSC operate in
accordance with the manufacturer standards. Two
aspects must be considered. The first is the vehicle's
maintenances & repair (M&R) systems quality, which
should keep the vehicle in working condition. The
second is the process quality of providing services to
the client - the vehicle owner. This is important
because manufacturer competitiveness and brand trust
depend on the BSS effectiveness. It is necessary to
correctly evaluate the performance services indicators
and risks, as well as provide actions that will help to
avoid risks or will be needed in risk situations case.
The most common way to ensure accessibility is to
create a reserve. These actions can be divided into two
directions. The main reserve capacities are formed on
a
https://orcid.org/0000-0002-9246-6232
b
https://orcid.org/0000-0002-5241-215X
c
https://orcid.org/0000-0002-6184-9900
d
https://orcid.org/0000-0003-3325-3285
the basis of demand forecasting and provide estimated
performance. This helps to insure against errors in
forecasts and from possible delays in the current orders
execution. The second direction of service efficiency
increase is realization of the customer-oriented
approach. Ensuring customer loyalty should be
considered as a prerequisite for achieving the success
of the company in the competition (Lovelock et al.,
2011).
One way to increase the competitiveness of both
the entire BSS and each of the DSCs is to regulate the
processes in each of them according to manufacturer
reviews. Currently, there are tools for working with big
data, so many vehicles manufacturers create tools for
collecting and processing large data amounts that
connect all production, logistics and service enterprises
into a single information space. This allows you to
control each vehicle throughout the entire life cycle
and helps to optimize all processes. At the same time,
it is possible to analyze the work results, compare them
with previous periods and give recommendations for
further adjustment of the development strategy. To
make adequate and justified decisions, Decision
Support Systems (DSS) are developed, the main
module of which is the intelligent core, which is
responsible for obtaining optimal decisions. This
approach is especially relevant in situations where
Shubenkova, K., Buyvol, P., Makarova, I. and Gabsalikhova, L.
Ways to Improve the Efficiency of the Truck’s Branded Service System.
DOI: 10.5220/0009839206730680
In Proceedings of the 6th International Conference on Vehicle Technology and Intelligent Transport Systems (VEHITS 2020), pages 673-680
ISBN: 978-989-758-419-0
Copyright
c
2020 by SCITEPRESS – Science and Technology Publications, Lda. All rights reserved
673

resources are limited, or in the case of the new vehicle
models launch on the market (Buyvol et al., 2019).
2 PROBLEM STATUS: BRANDED
SERVICE SYSTEM
2.1 Simulation Models in DSS as a Way
to Find Optimal Solutions
Upon entering new markets, vehicle manufacturers
create BSS abroad. As a rule, this is a network of DSC
authorized in accordance with the manufacturer's
standards. In most cases, they organize their activities
on the principle of “three S”: sale - service - spare parts.
For trucks, this approach is most relevant, since the
share of trucks in the total fleets number is rather small,
and it is more difficult to organize a maintenance in
small workshops than to cars. In addition, the
maintenance cost, as well as the complexity of
servicing trucks is higher (Makarova et al., 2013;
2015). Decision Support Systems (DSS) contain three
main subsystems: 1) module for data collection and
storage that comes from internal and external sources
(usually this is a data warehouse); 2) module for data
processing and analysis - the intellectual core; 3) the
user interface, which is necessary for interaction and
communication of clients using information flows.
This allows you to select data for analysis and
parameters that affect the management decision. The
DSS conceptual diagram is shown in Fig. 1. Simulation
models as part of the intellectual core provide the
search for the best solutions in various activity fields
of the entire service system and each of its subsystems.
Information from a common data warehouse in which
data is constantly updated is used to determine model
parameters. Updating the parameters allows you to
find the best solution in each specific situation.
The main problem here is the quality, completeness
and adequacy of statistics' data. Since the reliability of
complex technical systems depends on many factors,
the analysis quality will depend on the various data
groups quality. An incorrect situation interpretation
due to incorrect source data can significantly affect the
frequency of failures. Because of this, the information
quality about the vehicle technical condition at the
failure time and the conditions of its operation
preceding the failure allows the manufacturer to
improve not only the vehicle design, but also the
warranty service system. Statistical information is used
not only to create a simulation model, but also to verify
its adequacy and compliance with the real system
(validation and verification). When trucks M&R
planning during the warranty period, the information
quality problem and model adequacy can become
critical (Mikulec et al., 2017, Srinivasana et al., 2016).
This is due to the increased failures number in the
initial operation period, and the manufacturer must
remove the failure consequences in accordance with
the warranty service contract. In many cases, it is
related to use incomplete or subjective information,
which is contained in the complaint acts drawn up
when the vehicles owners contact the DCS. To obtain
more correct information, data is often used from an
intelligent vehicle on-board system. In the research
(Meeker et al., 2014), it is shown that various sensors
installed on the product can be used to collect
information about how, when, at what environmental
parameters and under what conditions the product is
operated. This approach is suggested in the paper (Last
et al., 2010). They state that it is possible to use multi-
target algorithm of estimated probability for a
probability prediction and a choice of failure time in
system of guarantee maintenance. For reliability
modeling authors use Weibull’s analysis.
2.2 Processes Organization in the
Branded Service System
Diagnosing faults in automotive systems is an
important stage in M & R, as it affects the duration to
complete the work. For fault taxonomy, a fault tree
diagram is often used. However, since the system's
structure is implicit, the article (James et al., 2018)
authors propose digraph modelling method, which
uses the graph theory's system approach. The proposed
approach contains recommendations for diagnosing
the main failures causes. Methodology
computerization will help in creating a knowledge base
about failures and how to resolve them. Therefore, this
approach is especially useful for M & R engineers.
Vehicle Health Management (VHM) often
includes real-time monitoring of operating conditions,
as well as decision-making on driving, operating, and
maintenance based on predicted conditions. The article
(Jaw et al., 2004) presents a universal, flexible
integration and testing concept for control evaluating,
including the accuracy of decision-making, algorithms
and models in real time and in closed cycle.
Meckel S. (Meckel et al., 2019) propose methods
for extracting knowledge from unstructured and
informal materials on Internet forums, offering more
effective and targeted actions for diagnostics and
maintenance in real time. This is necessary for the
synthesis of diagnostic graphs from the created
knowledge base for use in vehicle maintenance.
iMLTrans 2020 - Special Session on Intelligent Mobility, Logistics and Transport
674
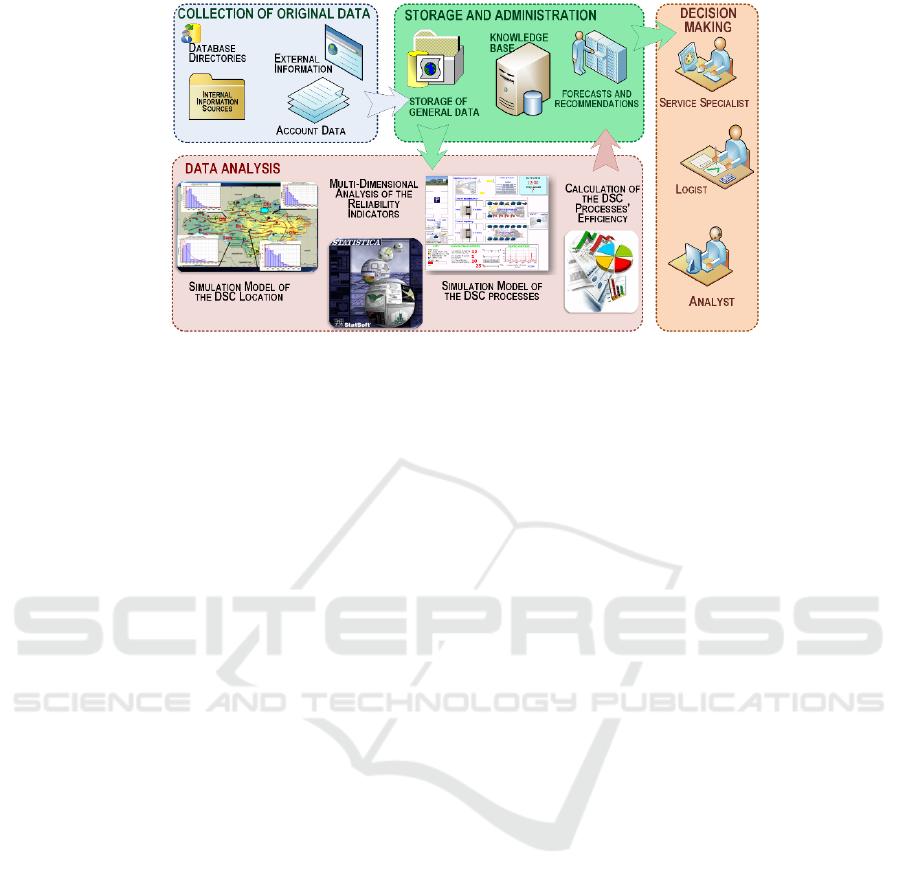
Figure 1: DSS conceptual scheme.
The study (Börger et al., 2019) goal is to reduce the
time required for trucks maintenance. It can be done by
applying the Lean methodology. The article (Vintr et
al., 2003) goal is to find ways to optimize the concept
of maintenance for reduce the life cycle cost (LCC) of
a vehicle based on operational reliability data. The
authors indicate that it is relatively easy to find reserves
and achieve significant savings in the vehicle LCC
using a simple administrative measure of change in the
maintenance frequency.
In order to maintain a high vehicle operability level
and the transport system safety as a whole, it is
necessary to adhere to a strategy and an appropriate
schedule for vehicle maintenance. In the paper (Kamlu
et al., 2019), to develop a fuzzy model, a condition-
based maintenance strategy is proposed that takes into
account various types of uncertainties for individual
vehicles, such as, for example, load, mileage and
terrain using either wired or wireless data and to
failure's predicts.
3 CASE STUDY: THE USE OF
MODELING TO SOLVE
PROBLEMS OF PROCESS
OPTIMIZATION IN THE BSS
3.1 Application of DSS in Strategic
Planning in the Corporate Service
System
Statistical data in the BSS can be used in the following
ways. Firstly, on the data array basis for a certain pe-
riod, it is possible to establish the main DCS activity
parameters (the requests flow intensity or services, the
requests number, the average services laboriousness)
and use them to perform an optimization experiment
and improve processes. Secondly, an analysis of the
failure distributions allows us to identify the problems
causes and find a way to eliminate them.
Thirdly, the failures flow trend analysis makes it
possible to predict the failures number in the
prospective periods of DSC activity and improve the
spare parts supplies management. The distribution
laws parameters analysis consists in comparing the
data set characteristics different periods and
developing methods for making managerial decisions.
In this case, as the optimal distribution in the current
period, a distribution law is selected that has the
estimates values (variance and mathematical
expectation) closest to the real data. Such laws are built
for each detail, unit and aggregate in a special DSS
software module “Statistical data analysis for DSC”.
A change in the distribution law parameters
indicates to change in the analysing indicator. For
example, if the optimal parameters among the
distribution laws in previous periods are the parameters
M = 16650 (km) And = 177560 (km
2
), and as a result
of the current data sample analysis, the parameters M
=14350 (km) and =213430 (km
2
), this indicates that
the average mileage of the vehicle to failure for
investigated vehicle's component has decreased, while
the random values spread has increased, which is most
likely caused by a quality decrease to this component's
manufacturing.
The user interface form of the module “Statistical
Data Analysis for DCS” has two tab cards: “Prediction
of component failures” and “Monitoring of service
parameters” (fig. 2). When you select the “Vehicle
mileage statistics” option, a selective two-dimensional
data set is formed according to two parameters:
“component name” and “vehicle mileage”, and then is
exported to the Statistica software application.
Ways to Improve the Efficiency of the Truck’s Branded Service System
675
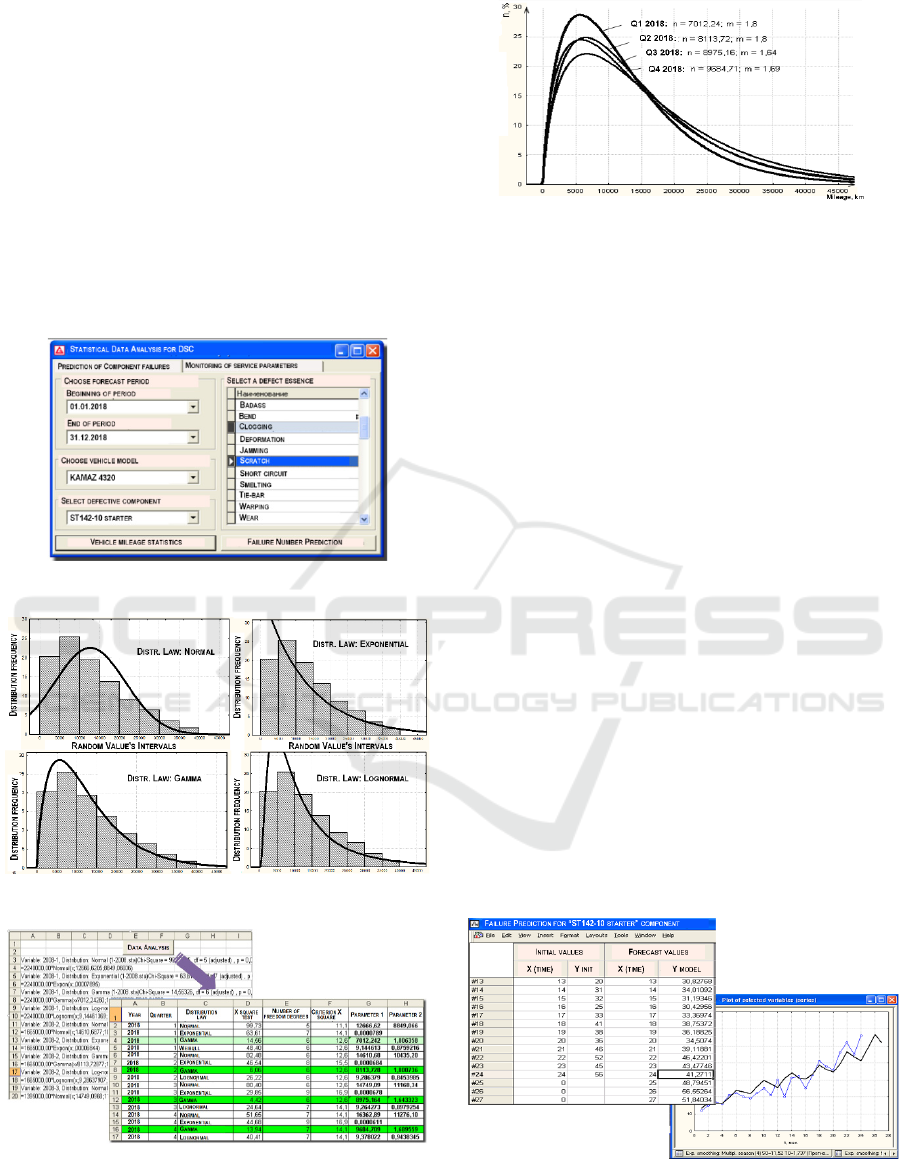
Based on this set, for a given component, a
frequency distribution histogram of the range values is
built, after which the distribution law that best
describes the resulting array is selected. As Fig. 3
shows the vehicle mileage value distribution laws until
the failure of the “ST142-10 starter” component on
KAMAZ 4320 truck model, according to data for the
2018 first quarter. The decision-making method
consists in choosing the distribution law with the best
agreement criterion and comparing this law parameter
of with the previous periods parameters. For this, the
data is transferred to a special decision-making module
developed in MS Excel (Fig. 4), in which compiles a
summary table of distribution laws parameters.
Figure 2: DSS statistical analysis module.
Figure 3: The distribution laws of the mileage to failure.
Figure 4: Decision-making module for DCS management.
Figure 5: Comparison of gamma-distribution law parame-
ters for the four quarters of 2018.
Thus, it can be seen from the presented example
that the random vehicle mileage to defective
component failure conform the gamma distribution
law, while the law parameters change in the direction
optimal for the enterprise (Fig. 5), that is, the shape
parameter increases, which affects the mathematical
expectation of the random magnitude, and also
decreases the scale parameter, affecting the random
variable's variance. In the general case, it can be
predicted that over time, the gamma distribution law
will be transformed into the normal distribution law.
The algorithm for the module “Forecasting the
failures number” allows you to create a time series of
the replacements number of the defective component
for the period specified by the user, which is also
exported to the Statistica software, where the model of
the seasonal component is selected (additive or
multiplicative), and a time series line and an
extrapolated trend line with a relative less than 10%
error (Fig. 6). The tool “Monitoring service
parameters” allows, on the basis of calls to the service
center, to determine the DCS activity parameters
during the period specified by the user. The data sets
corresponding to the selected service parameters are
transferred to the Statistica software (Data Science …,
2020), where they are processed statistically. The
module window view is shown in Fig. 7.
Figure 6: The problem solution to the component failures
numbers predicting.
iMLTrans 2020 - Special Session on Intelligent Mobility, Logistics and Transport
676
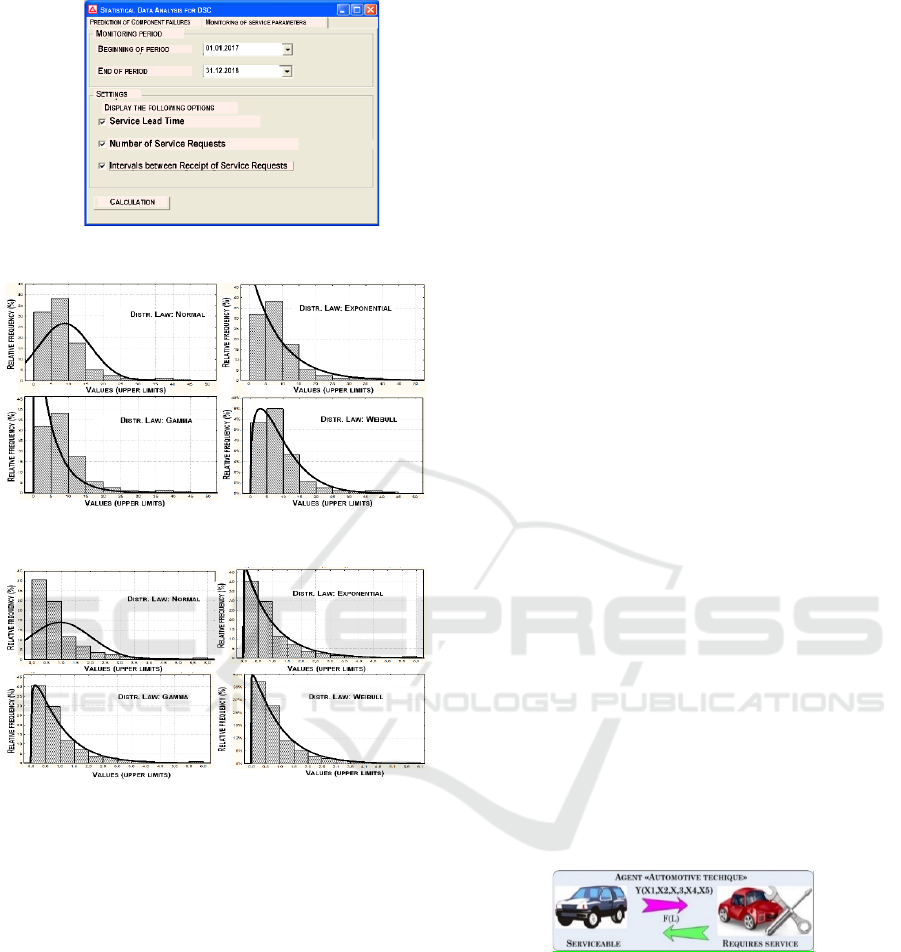
Figure 7: Select service monitoring options.
Figure 8: Service Time's Distribution Laws (hours).
Figure 9: Distribution Laws of interval between request re-
ceipt’s (hours).
In fig. 8 shows the distribution laws of the service
execution time value in hours (for all database defects).
From the above graphs it follows that the Weibull
distribution law with the parameters = 28.76 and =
1.29 is the most suitable, since it is the only one that
has a significance level p = 0.10125 that exceeds the
specified level = 0.1. Figure 9 shows the distribution
law of the random interval value between the service
requirements receipt in hours.
From the above graphs it follows that the most
suitable is the exponential distribution law with the
parameter = 1.035, since it is the only one that has a
significance level p = 0.13401 that exceeds the
specified level = 0.1. The calculations result of the
queuing system parameters are used to develop a
simulation model and conduct an optimization
experiment. The analysis results serve to develop and
adjust instructions intended for both service centers
and vehicle owners. Compliance with these
instructions can improve the vehicle operation
reliability.
Constant monitoring of the service system status
allows you to increase not only the vehicle reliability,
but also the DSC efficiency. If the distribution laws
parameters indicate a deterioration in the system state
(for example, a decrease in the average vehicle mileage
to failure), then the management in the previous step
was not rational, and the system needs a control action.
In this case, recommendations for the control action are
developed on the optimization experiment basis a
conducted on a simulation model. In the case when the
parameters values of the distribution law indicate an
improvement in the parameters of the system
functioning, we can conclude that the control in the
previous period was rational, that is, adequately by set
goals (Khabibullin et al., 2013).
3.2 M & R Processes Simulation in
DSC
When new vehicle models appear, it is necessary to
evaluate the capabilities of the existing dealer and ser-
vice network (DSN), which can be done using simu-
lation models. After simulation model creating and
checking its adequacy, it can be used for an optimiza-
tion computer experiment, why allows you to find a
control impact in which performance indicators will
be optimal for the system under certain external con-
ditions. When creating the model, two approaches
were combined: agent modeling (agents - vehicles)
and discrete event modeling (service process execu-
tion in the DCS). This made it possible to combine the
queuing system principles with the stochastic behav-
ior model of separate objects.
Figure 10: Agent-based model for «vehicle» object.
The agent “vehicle” can be in two states: “service-
able” and “repair required”.
The transition from the first state to the second is de-
termined by the vehicle's failure probability function
to mileage. The time to return to working condition
(“The average time of fault removal” - Y) is deter-
mined by the parameters: the percentage of requests
for spare parts directly from the warehouse (X1), the
number of workstations in the DSC (X2), the number
of workers per workstation (X3), the distribution of
Ways to Improve the Efficiency of the Truck’s Branded Service System
677

arrivals from the vehicles concentration point in the
DSC (X4), the schedule of the DSC (X5) (Fig. 10).
In addition, when generating “vehicle” for each
agent, the “type” property is determined (base vehicle,
truck tractor, trailer vehicle, dump truck, specialized
vehicle), which affects the repair work duration in ac-
cordance with the standards. To develop a simulation
model, we used the library of discrete event modeling
objects (Enterprise Library) in the AnyLogic software
application (Borshchev, 2014). Besause trucks in most
cases represent corporate fleets, two classes were cre-
ated during the simulation: Auto (agent class, models
one truck) and VCP (models the vehicle concentration
place). When the model is started, for each “Auto”
agent, the initial mileage value (which then constantly
increases by the flowAuxVar value), the maximum
vehicle mileage and the mileage to failure are gener-
ated. Upon reaching the mileage to failure, the agent
state goes from working (“Serviceable”) to Ou-
tOfOrder (“Repair is required”), a need for M&R is
formed, and vehicle is delivered to DSC for services.
After the vehicle is transportation to DSC, the ser-
vice algorithm corresponding to the created class
agent “Service station” is applied to it. So, if all the
parking spaces for vehicles awaiting repair are occu-
pied, the service request is rejected and the vehicle
leaves the DSC. After the repair station is vacated, the
availability necessary spare parts for repair are
checked. If there is no necessary spare part, the request
arrives at the delay unit simulating the spare parts ex-
pectation, after which the request falls into the “de-
ferred repair” block and leaves the service system. To
verify the proposed approach adequacy, we chose the
Kazakhstan Republic (RK) DSN, which has 16 DSS.
This market is actual for KAMAZ in competition with
Chinese manufacturers conditions, so improving the
efficiency of this BSS segment is important. Since the
RK territory has four climatic zones with different op-
erating conditions (Köppen, 2011), the law on the fail-
ure distribution was specific for each of them. Crite-
rion function of system management model estab-
lishes balance between of manufacturer investments
on DSN development and the lost profit from client’s
loss in view of admissible queue length excess:
Z
1
- Z
2
max (1)
where 𝑍
– benefit of additional clients' service at the
taken measures of DSN development,
Z
1
= E - KL
inv
(2)
E – average benefit of one served client, rub;
KL
inv
–
the difference between quantity of served clients be-
fore and after development; Z
2
– costs of investments
of DSN development,
Z
2
= P + N
inv
S
n
(3)
P – expenses on information support, rub; N
inv
- num-
ber of added DSC in DSN; S
n
– cost of additional DSC
building rub.
Full system effectiveness is defined by decrease in
client's losses that depend on excess of vehicle delay
time in BSA in comparison with a specified time on
declared works implementation, and also DSC ex-
pense minimization depending on equipment and
worker’s downtimes. The client’s losses connected
with delivery and vehicles delay in the DSC:
∑
𝑇
1
𝑇
𝑆
𝑁
→𝑚𝑖𝑛
where:𝑆
– the average client’s losses due to with ve-
hicle shutdown, rub/hour; 𝑁
– number of vehicles,
server in 𝑗 DSC; 𝐷
–average vehicle transportation
distance to the 𝑗 DSC, km; 𝑉 – vehicle transportation
speed to the DSC, km/h; 𝑅 – the number of DSC; 𝑇
– standard delivery time on spare parts to j DSC,
hours; 𝑇
– vehicle repairs average time in 𝑗 DSC,
hours; 𝑋
– number of workers per one station in 𝑗
DSC; 𝑇
–average expectation time in service queue
in 𝑗 DSC, hours; 𝑋
– satisfaction percent for spare
parts demands directly from a warehouse in 𝑗 DSC.
DSC expenses connected with shutdowns:
∑
𝑆
∙𝑋
𝑆
∙𝑋
∙𝑋
∙𝑇
→𝑚𝑖𝑛
(5)
where: 𝑆
– costs associated with stopping one work-
station on hour (missed profit), rub/hour; 𝑆
– average
salary per hour, rub/hour; 𝑇
– average time stopping
one workstation in j DSC, hours; 𝑋
–number of work-
station in j DSC.
Model's limitations:
1. Limitation on exceeding the investment
amount of economic benefits
Z
1
> 0 (6)
2. Limitation on the maximum investments
amount that the manufacturer is ready to invest for
progressing for the DSN development:
Z
2
>INV (7)
3. 𝑋
, 𝑋
– limitation on the warehouse
space size for storage of the minimum and maximum
spare parts volume:
4. 𝑋
𝑋
𝑋
(8)
5.
∑
𝑁
∑∑
𝑋
∙
𝑉𝐶𝑃
(9)
iMLTrans 2020 - Special Session on Intelligent Mobility, Logistics and Transport
678
𝑋
– distribution of arrivals from 𝑖-place of
fleet concentration to 𝑗 DSC, %,
𝑉𝐶𝑃
– number of inoperative vehicles in 𝑖-
place of park concentration.
6. 𝐾
, 𝐾
- coefficients of the min-
imum and maximum admissible workload of work-
stations in j-DSC.
7. 𝐾
∙
∙
∙∙
𝐾
(10)
where 𝐷 – quantity of days in simulated period; 𝑇
– the average time of vehicle repairs in j- district, hour;
𝑇
– working shift duration in j- district, hours; 𝑋
–
number of working shifts in j-district, hours.
8. 𝑋
, 𝑋
– minimum and maximum
normative workstations number of 𝑗 DSC (limit the
stations number).
𝑋
𝑋
𝑋
9. 𝑋
, 𝑋
– minimum and maximum
workers quantity on workstations in 𝑗 DSC (limit on
the labor resources number).
𝑋
𝑋
𝑋
The model was verified by the tracing method
(Sargent, 2011). Since each DSC is a queuing system
with a specified number of parallel workstations, to
verify the model, the average workload on the work-
station was compared with the calculated use coeffi-
cient for the selected time period 𝜌
𝑚∙𝑡
/
𝑛∙
𝑡
, where 𝑚 – vehicles quantity being repaired funds,
𝑡
– average repair time of one vehicle, 𝑛 – quantity
of workstations in DSC, 𝑡
– workstation capacity for
the considered period (Introduction to …, 2008). Dur-
ing the simulation experiment, data were used on the
fleet's species-age structure and the DSC characteris-
tics. As the system's response vector, we used the av-
erage time spent by the vehicle in the DSC, belonging
to the corresponding format's group, which were ob-
tained as a clustering result. Clustering was carried out
according to the estimated parameters by the k-means
method based on dendrograms based on project and
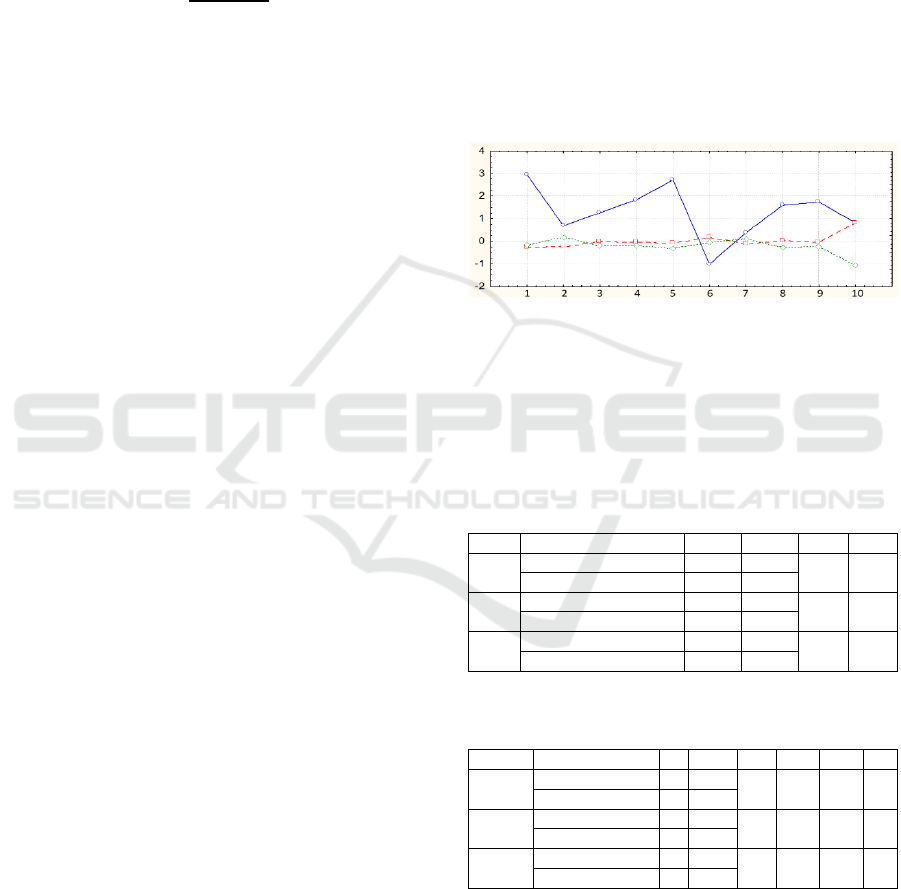
calculated parameters. The graph of cluster averaging
over estimated parameters is shown in Fig. 11.
The developed simulation model's adequacy was
evaluated according to the statistical theory of
assessment and hypothesis testing, using the following
criteria:
1. Dispersions of the model’s responses
deviations from the average values of systems
response. Dispersions comparison was performed to
Fisher criterion. The results, presented in Tab. 1, show
that in all three clusters 𝐹𝐹
, i.e. the hypothesis of
the differences importance between the two variance
estimates is rejected.
2. Using the Student t-test, we tested the
hypothesis that the average values of each n-
component of the Y
n
model responses are close to the
average values of the n-component of the real system
𝑌′
responses. For the real system and simulation
model, the expected value and dispersion 𝑌′
, 𝐷′
and
𝑌
, 𝐷
, were estimated (Tab. 2) (Buyvol et al., 2019).
The calculation results show that for all three clusters
𝑡
𝑡
, i.e. the hypothesis on proximity of the
responses average values for model and the system is
accepted.
Figure 11: Graph of a clustering averaging by estimated pa-
rameters (1 - complaints number; 2 - warranty vehicles num-
ber; 3 - services volume; 4 - sold spare parts cost; 5 - sold
vehicles cost; 6 - sold vehicles number (units); 7 - operations
results for the reporting period (profit/loss); 8 - profitability
of sales; 9 - services profitability; 10 - fulfillment of cus-
tomer service requirements.
Table 1: The results of comparing dispersions according to
the Fisher test.
№
system γ1 D
n
F F
kp
1
Real system 3 2.247
3.68 4.76
Simulation model 6 0.610
2
Real system 3 0.868
0.47 8.94
Simulation model 6 1.864
3
Real system 3 2.648
1.93 8.94
Simulation model 6 5.100
Table 2: The hypothesis verification results using t-student
test.
№ system N Y
n
D
pn
t
n
t
kp
∆ω
1
Real system 4 37.05
1.16 1.409 2.262 0.78
Simulation model 7 36.75
2
Real system 4 46.34
1.53 1.80 2.26 1.41
Simulation model 7 47.00
3
Real system 4 41.90
4.28 0.21 2.26 1.39
Simulation model 7 42.48
4 CONCLUSIONS
Scientific attitude at BSS improvement helps to react
to the arising problems at new model vehicles
Ways to Improve the Efficiency of the Truck’s Branded Service System
679

operation quickly, having provided possibility of it
constructions improvement. As the executed
researches have shown that only system solutions for
increasing the vehicle reliability at all life cycle stages
will make it possible to increase its safety, as well as to
ensure the possibility of trouble-free operation. The
decision-support systems for management
improvement use will allow to correct the actions,
which directed on strategic goal realization at each
stage. Statistical data analysis and simulation
modelling as the intelligent block main element of DSS
will allow selecting the most rational variant for each
real condition combination. At the same time, it is
necessary to create conditions for initial data timely
updating, its operative processing and ready solutions
storage.
ACKNOWLEDGEMENTS
This work was supported by the Russian Foundation
for Basic Research: grant No. 19-29-06008 \ 19
REFERENCES
Börger, A., Alfaro, J., León, P., 2019. Use of the Lean Meth-
odology to Reduce Truck Repair Time: A Case Study.
In: Rocha Á., Adeli H., Reis L., Costanzo S. (eds) New
Knowledge in Information Systems and Technologies.
WorldCIST'19 2019. Advances in Intelligent Systems
and Computing, vol 930. pp 655-665.
Borshchev, A., 2014 Multi-method modelling: AnyLogic, in
Discrete-Event Simulation and System Dynamics for
Management Decision Making. John Wiley & Sons Ltd.
Chichester, U.
Buyvol, P. et al., 2019. Forecasting of Changes in Service
System During the Launch Period of the New Automo-
bile Lineup. Helix. Vol. 9 (4): 5221- 5226.
Data Science Textbook. 2020. URL: https://docs.tibco.com/
data-science/textbook.
Introduction to Discrete-Event Simulation. Chapter 10.
2008. In: Cassandras C.G., Lafortune S. (eds) Introduc-
tion to Discrete Event Systems. Springer, Boston, MA.
pp. 557-615.
James, A.T., Gandhi, O.P. & Deshmukh, S.G. 2018. Fault
diagnosis of automobile systems using fault tree based
on digraph modeling. Int J Syst Assur Eng Manag 9,
494–508.
Jaw, L. and Wang, W. 2004. A run-time test system for ma-
turing intelligent system vehicle capabilities - SIDAL,
2004 IEEE Aerospace Conference Proceedings, Big
Sky, MT. Vol.6. pp. 3756-3763.
Kamlu, S., Laxmi, V., 2019. Condition-based maintenance
strategy for vehicles using hidden Markov models. Ad-
vances in Mechanical Engineering. Vol. 11(1) 1–13.
Khabibullin, R.G. et al., 2013. The study and management
of reliability parameters for automotive equipment using
simulation modeling. Life Science Journal. 10 (12s),
132, pp. 828-831.
Köppen, W., 2011. The thermal zones of the Earth according
to the duration of hot, moderate and cold periods and to
the impact of heat on the organic world. Meteorolo-
gische Zeitschrift, Vol. 20, No. 3, 351-360.
Last, M., Sinaiski, A., Subramania, H.S. 2010. Predictive
Maintenance with Multi-Target Classification Models.
Intelligent Information and Database Systems. Lecture
Notes in Computer Science. 5991: 368-377.
Lovelock, C.H., Wirtz, J. 2011. Services Marketing: People,
Technology, Strategy, 7th Edition. Published by Pren-
tice Hall. 612 p.
Makarova, I. et al. 2013. Improving of performance system
of warranty for automotive engineering abroad on the
basis of data of rejections analysis. Innovative Mechan-
ical Engineering Technologies, Equipment and Materi-
als-2013 Vol. 69.
Makarova, I. et al. 2015. Improving the system of warranty
service of trucks in foreign markets. Transport Prob-
lems. Vol. 10. Iss.1 pp. 63-78.
Meckel, S. et al., 2019. Optimized Automotive Fault-Diag-
nosis based on Knowledge Extraction from Web Re-
sources, 24th IEEE International Conference on Emerg-
ing Technologies and Factory Automation (ETFA), Za-
ragoza, Spain, pp. 1261-1264.
Meeker, W.Q., Hong, Y. 2014. Reliability Meets Big Data:
Opportunities and Challenges. Quality Engineering, 26.
pp.102–116.
Mikulec, N., Felke, T., Bangale, S. 2017. Analysis of War-
ranty Data to Identify Improvements to Vehicle Relia-
bility and Service Information. SAE Int. J. Passeng.
Cars – Electron. Electr. Syst. 10(2).
Sargent, R.G., 2011. Verification and validation of simula-
tion models. WSC '11 Proceedings of the Winter Simu-
lation Conference. Phoenix, Arizona, pp. 183-198
Srinivasana, R. et al. 2016. Modelling an Optimized War-
ranty Analysis methodology for fleet industry using data
mining clustering methodologies with Fraud detection
mechanism using pattern recognition on hybrid analytic
approach. Procedia Computer Science, 87, pp. 322 –
327.
Vintr, S.Z. and Holub R., 2003. Preventive maintenance op-
timization on the basis of operating data analysis. An-
nual Reliability and Maintainability Symposium, 2003.,
Tampa, FL, USA. pp. 400-405.
iMLTrans 2020 - Special Session on Intelligent Mobility, Logistics and Transport
680
