
Combination of Algorithms for Object Detection in Videos on Basis of
Background Subtraction and Color Histograms: A Case Study
Theo Gabloffsky
a
and Ralf Salomon
Institute of Applied Microelectronics, Univeristy of Rostock, Germany
Keywords:
Object Recognition, Object Detection, Background Subtraction, Histogram Comparison, Video Analysis.
Abstract:
This paper presents a combination of algorithms for an object detection and recognition in videos. These
algorithms are based on a background subtraction and an histogram comparison. The algorithm were imple-
mented and used for the detection of curling stones in videos from a dataset. These dataset includes three
different types of videos, which reaches from (1) only the curling stone is on the over (2) an athlete is behind
the stone and (3) an athlete moves in between the field of view from the camera. While analysing the videos,
the time was measured which the algorithms needed for their calculations, As the results show, the imple-
mented algorithms are able to recognise position of the curling stone with an detection rate of 100% under
best circumstances and with 71.11% under worst conditions.
1 INTRODUCTION
Curling is an Olympic sports discipline that has re-
ceived recent research interest. The goal of this re-
search is to better understand the interactions of the
curling stone with the ice surface on this it slides. In
that context, the current speed of the curling stone is
of major importance.
The speed of an object is often derived from two
time measurements. With a known distance s and a
time difference ∆t, the current speed calculates to v =
s/∆t.
In many application areas, the time difference ∆t
can be easily determined by two light barriers. Light
barriers are known as robust, precise, and low-cost
measuring tools. Despite their well-known advan-
tages, they do fail for the following reason when be-
ing used in curling: a moving curling stone might be
accompanied by one or two additional athletes, who
heavily sweep the ice in front of the curling stone. As
a consequence, the light barriers might be triggered
not only by the stone but also by the athletes’ legs or
brooms. A main technical problem is that the order of
the stone, the legs, and brooms is not specified. it is
well possible that a sweeping athlete positions itself
not in front, but aside or behind the stone. Thus, the
trigger events cannot be assigned to the curling stone
without further knowledge.
a
https://orcid.org/0000-0001-6460-5832
This knowledge could be archived through an
recording of the sceneries and an automatic video
analysis of the position of the curling stone. An im-
portant aspect of that is the correct detection of the po-
sition of the curling stone in the video while having a
possibly low computational cost to give an immediate
feedback to the athletes.
This paper introduces a combination of algorithms
for the detection of objects on the basis of color and
size information. This algorithm is used to detect
curling stones in a dataset of videos. The object de-
tection works in two steps, while both algorithms are
already known in the literature. Though there are no
contributions fusing both algorithms for object detec-
tion and recognition. The algorithm works in two
steps like the following: At first, the color informa-
tion of the scenario is reduced by a background sub-
traction. After that, the image is divided into multi-
ple tiles and for each tile, three histograms, for each
color channel in RGB one, are calculated. Those his-
tograms are compared with reference histograms of
the wanted object. The tile, with the biggest simi-
larity to the reference histogram, is considered as the
position of the object. Section (3.1) explains the algo-
rithm in more detail.
For an evaluation of the algorithm a dataset was
created, which includes three different scenarios of a
moving curling stone on the ice: (1) a moving curl-
ing stone alone on the ice (2) a moving curling stone
with an sweeping athlete behind the curling stone and
464
Gabloffsky, T. and Salomon, R.
Combination of Algorithms for Object Detection in Videos on Basis of Background Subtraction and Color Histograms: A Case Study.
DOI: 10.5220/0009832904640470
In Proceedings of the 17th International Conference on Informatics in Control, Automation and Robotics (ICINCO 2020), pages 464-470
ISBN: 978-989-758-442-8
Copyright
c
2020 by SCITEPRESS – Science and Technology Publications, Lda. All rights reserved

(3) a moving curling stone with an sweeping athlete
between the camera and the stone. Section (3.2) ex-
plains the dataset in more detail.
An implementation of the algorithm was used to
analyze the dataset. The results were compared with
a manual analysis of the videos. In addition, an imple-
mented timing mechanism measured the time the im-
plementation needed for analyzing the frames. Sec-
tion (3.3) gives more details of the used configurations
and implementations.
The results show an average deviation of
12.91Pixels, which is equal to a real world distance
error of 60.67mm from a camera distance of 7.5m for
videos with the curling stone alone, while maintaining
a high detection rate of 100%. For the other videos,
the detection rate is lower. The implementation took
around 0.7µs for analyzing one segment of a frame of
the video, which can lead to an on-line video analyz-
ing on a state of the art consumer computer system.
Section (4) presents the result of the comparisons and
the time measurements.
As the results show, the algorithm is very good in
detecting the curling stone alone on the ice and even
with an athlete in the background. It has a reduced
performance when a curling athletes blocks the view
partly to the curling stone. Section (5) discusses the
advantages and the limitations of the used algorithm.
2 STATE-OF-THE-ART
There are many strategies for object detection and
recognition in pictures and videos which not only dif-
fer in the precision of the detection but also in compu-
tational costs and the complexity of implementation.
(Huang et al., 2019) mentions a system for the posi-
tion detection of tennis balls in videos, which bases
on a deep neural network. As the authors mention,
the system has a very good performance of detecting
the position while having a very high computational
cost which makes the system not suitable for real time
applications.
Further strategies lie in the detection of structural
informations of the objects with the help of edge de-
tecting algorithms as described in (Belongie et al.,
2002).
Automatic feature extractors like SURF, SIFT, or
ORB, as introduced in (Rublee et al., 2011) show very
good results in detecting rotated objects and as shown
in (Wu et al., 2012), they can also be used for track-
ing objects in videos. As mentioned in (Pieropan
et al., 2016), they show a bad performance tracking
objects surrounded by multiple targets and struggle to
identify objects in complex environments as seen in
(Vaidya and Paunwala, 2017).
The proposed method in this paper searches for
objects on the basis of color informations through
color histograms. Similar approaches are already
mentioned in the literature. For example in (Swain
and Ballard, 1990) and (Mason and Duric, 2001). The
generating and histograms are very low in computa-
tional costs, which is an important aspect for the tar-
get scenario. In addition, most integrated graphic pro-
cessors have implemented routines for generating his-
tograms.
The background subtraction is also well docu-
mented in the literature. (Man Zhu et al., 2012) pro-
poses different methods and algorithm for the back-
ground subtraction in videos and compares them.
3 CONFIGURATION OF THE
PROPOSED METHODS
3.1 Object Detection and Recognition
This section presents the algorithm used for the ob-
ject detection. The algorithm used for the detection
were chosen because of two reasons: At first they
have a low computational cost and are known for giv-
ing good results.
The algorithm is composed of two steps:
1. Dividing the foreground from the background
through the calculation of a difference frame.
2. Detecting the object through a comparison of
color information in forms of color histograms
with reference histograms
Dividing Foreground and Background. The fol-
lowing approach was chosen because of its low com-
putational costs. As mentioned in (Man Zhu et al.,
2012), the calculation of a difference frame is suit-
able for simple scenarios, which are expected in the
present application area.
For the division of the foreground from the back-
ground of an image B
Pic
, as shown in the top of figure
(1), the used approach needs an image B
Background
, as
seen in the middle of figure (1), which only shows
the background of the scenario. The algorithm works
on every pixel P(x,y) of the new foreground im-
age B
Foreground
by calculating the color distance d
color
from the background image B
Background
to the actual
image B
Pic
like the following:
Combination of Algorithms for Object Detection in Videos on Basis of Background Subtraction and Color Histograms: A Case Study
465

Figure 1: Top: example picture for the background subtrac-
tion; mid: reference-Frame used for the background sub-
traction; bottom: result of the background subtraction.
∆R = P(x
i
,y
j
,R)
Pic
−P(x
i
,y
j
,R)
Background
∆G = P(x
i
,y
j
,G)
Pic
−P(x
i
,y
j
,G)
Background
∆B = P(x
i
,y
j
,B)
Pic
−P(x
i
,y
j
,B)
Background
d
(
x
i
,y
j
)
color
=
p
∆R
2
+ ∆G
2
+ ∆B
2
(1)
Is the calculated color distance d(x
i
,y
i
)
color
smaller then a chosen threshold distance t
distance
, the
color values of P
(
x
i
,y
j
)
f oreground
are set to 0. Is the
calculated distance larger, the color information of
P(x
i
,y
i
)
pic
are copied to the new pixel:
P
f oreground
=
(
P
(
x
i
,y
j
)
pic
, if d(x
i
,y
j
)
color
≥t
distance
0 otherwise
Recognition of the Object. For recognizing the
searched object, the algorithm compares extracted
color histograms from an image with reference his-
tograms provided to the algorithm.
The starting point for the search is an extracted
part of an image with a specific size x
r
,y
r
, which
only shows the wanted object. From this image
tile, the algorithm extracts three color histograms
H(0..256,R,G,B)
re f
.
The from the background-subtraction generated
image B
f oreground
is divided into multiple image seg-
ments. Each segment has the size of the provided ref-
erence image x
segment
= x
re f erence
,y
segment
= y
re f erence
.
The segments are overlapping each other and neigh-
boring segments have a pixel distance of 1.
From each of the segments, the algorithm extracts
three color histograms H(0..256,R, G, B)
segment,xi,yi
.
These histograms are then compared to the reference
histogram. The following equation provides a mea-
surement for the similarity of two histograms, H
a
and
H
b
, and is according to a comparison in (Qiuxiang
Liao, 2016) the fastest way of calculating the his-
togram distance s(H
a
,H
b
), compared to various other
approaches:
s(H
a
,H
b
) =
∑
255
i=0
min(H[i]
a
,H[i]
b
)
∑
255
i=0
H[i]
a
(2)
The result of the equation lies between 0, for no
similarity to 1, for identical. The similarity is calcu-
lated between each histogram of an image segment to
the corresponding reference histogram.
s
Segment,Histogram
= s(H
Segment,R
,H
Re f erence,R
)
+ s(H
Segment,G
,H
Re f erence,G
)
+ s(H
Segment,B
,H
Re f erence,B
)
(3)
The segment with the highest similarity is consid-
ered as the position of the wanted object but only if its
bigger then a threshold value t
histogram
to prevent false
positive detection.
For an image of the size X
pic
,Y
pic
and a segment
size of X
seg
,Y
seg
the algorithm generates an amount of
z segments:
z = (X
pic
−X
seg
) ∗(Y
pic
−Y
seg
) (4)
3.2 Dataset of Curling Videos
The dataset consists of overall 9 Videos, which show
a curling lane from the side in a distance from 5m.
The top image of figure (1) shows an example frame
of one of the videos of the dataset.
In all the videos a curling stone can be seen, which
is accelerated by an athlete. At a specific line (the so
called Hog Line), the athlete releases the stone and it
glides over the curling lane. The dataset consists of
three different types of videos:
1. A curling stone moves alone over the curling lane.
2. A curling stone moves over the curling lane with
an sweeping athlete behind the stone.
3. A curling stone moves over the lane with an
sweeping athlete between camera and stone.
The top image of figure (1) shows the first scenario
of the dataset. the second and third can be seen in
figure (2). Each of the video has a duration of 45s
and is recorded in a ∗.h264 format with a resolution
of 1640x512Pixels. The framerate of the videos is
25FPS.
The videos were recorded with a Raspberry Pi
Cam V2.1 with a horizontal aperture angle of 62.4
◦
,
ICINCO 2020 - 17th International Conference on Informatics in Control, Automation and Robotics
466
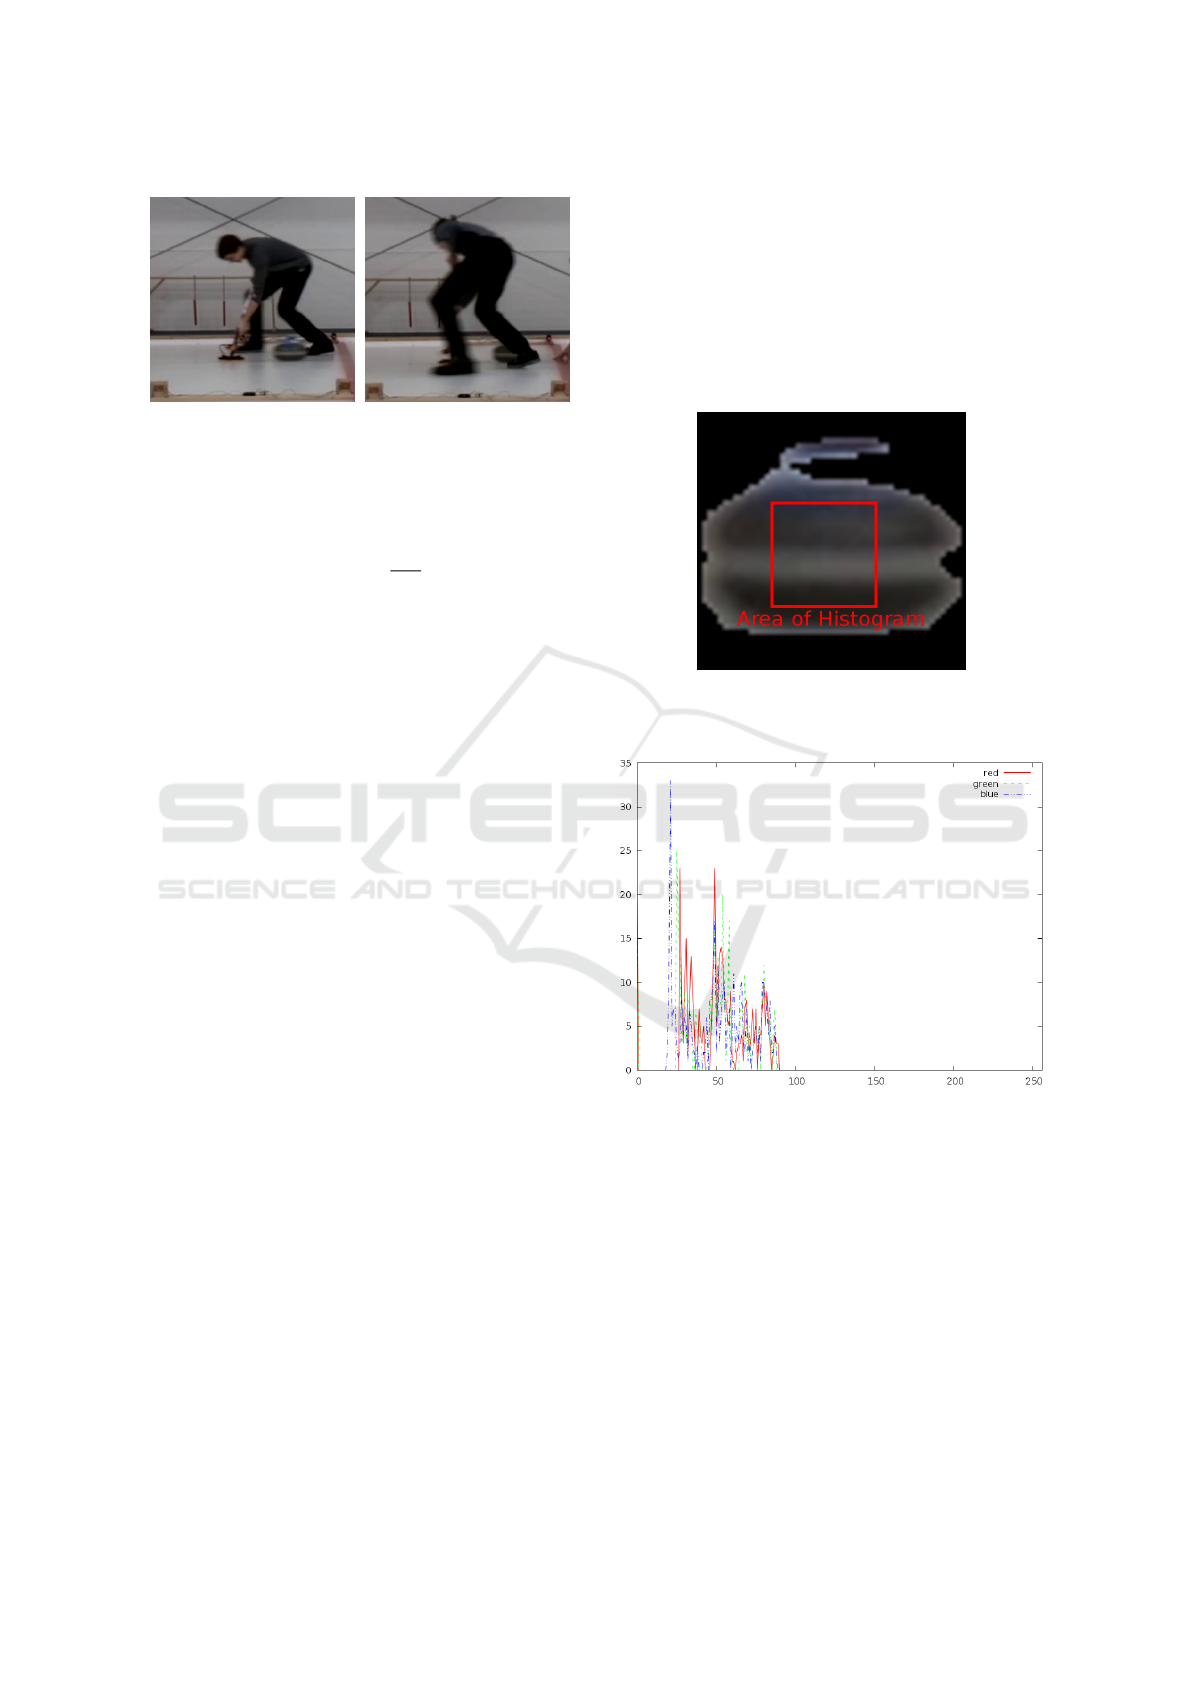
Figure 2: Extracted Image Sections: Top Image shows ath-
lete behind stone; Bottom Image shows athlete in front of
stone.
connected to a Raspberry Pi 3B+. The camera was
positioned in a distance of around 7.5m from running
corridor of the curling stone. This results in a aver-
age distance per pixel of 4.71
mm
pixel
. The illumination
of the scene was artificial and flicker-free.
3.3 Configuration of Experiments
General Information. For evaluation of the algo-
rithm explained in section (3.1) they were imple-
mented into a program with the programming lan-
guage C. All the videos mentioned in section (3.2)
were analyzed with that implementation. The goal
was to find the position of the curling stone in every
frame of the video in which it occurred. As a refer-
ence, all videos were also analysed by hand and then
compared to positions found by the algorithm.
Though the videos of the dataset are in a ∗.h264-
Format, they were converted with the tool f f mpeg
into an RGB888-Format.
The calculations run on a Ryzen 7 3800X Proces-
sor which runs on Debian 9.
Background Subtraction. The reference back-
ground image needed for. the background subtraction
is generated by taking the second frame of each video
as the reference image. The threshold value t
bg
has to
be evaluated by hand through testing different values
and needs an adjustment for different sceneries and
enlightenments. If the value is to low, e.g., a value of
t
bg
= 30, the background is still visible. If the value is
to high, e.g., a value of t
bg
= 150 the moving objects
are not detected correctly. The threshold value is set
to a value of 75.
Histogram Comparison. The reference histograms
used for the histogram comparison can be seen in
figure (4). These histograms were generated by the
algorithm out of an extracted image tile of the size
of 20x20Pixel. The tile was extracted from a video
not in the dataset and can be seen in figure (3). The
minimum value for recognizing the stone is set to
t
histogram
= 1.5 This value was also the result of a test
with a video, which shows the same scene, but is not
in the dataset. If the value is to low, the histogram
comparison results in more false positive results.
Calculation Time. Through the calculations the time
for the background subtraction and histogram com-
parison was taken by taking timestamps with the help
of the standard C-Library < time.h >. These times-
tamps were taken before and after the execution of
each of the algorithms.
Figure 3: Extracted Frame from a Video which was used for
creating the color histograms. The red area marks the area
of histogram.
Figure 4: Extracted Reference Histograms.
4 RESULTS
Detected Positions. The tables (1),(2) and (3) shows
the following results:
1. # Frames: Amount of frames which contain the
stone, counted manually
2. min: is the closest difference of distance the algo-
rithm matched with the manual detection
3. max: is the maximum difference of distance the
algorithm matched with the manual detection
Combination of Algorithms for Object Detection in Videos on Basis of Background Subtraction and Color Histograms: A Case Study
467

Figure 5: Extracted example of a detected curling stone.
4. mean: is the mean difference of distance the algo-
rithm matched with the manual detection
5. false positive: is the amount of frames in which
the algorithm falsely detected the stone
6. not detected: amount of frames in which the algo-
rithm did not detected the stone which was in the
frame
The results shown in table (1) are from the videos
without an athlete in the videos. The algorithm de-
tected the positions of the curling stone with a mean
deviation of 12.91Pixels over 236Frames in which
the stone occurred in the video. The detection rate
is 100%, but with false positives which reduces the
accuracy to 94.17 %.
If an athlete moves behind the curling stone, the
mean deviation rises to 10.47Pixel and the not de-
tection rate rises to an average of 5.6 frames with an
summary of 288 frames in which the stone occurred.
If an athlete is between the camera and the curl-
ing stone, the mean deviation rises to 18.23Pixel and
the rate of not detected frame rises up to an average
of 26.0 f rames, which means an not detection rate of
28.69%.
Calculation Time. The mean calculation time for
generating the foreground image was 0.0041s. The
Object Detection took 0.5698s for analyzing all seg-
ments.
5 DISCUSSION
Object Recognition and Detection. The results
show that the used algorithm is very good in detecting
the stone alone with a detection rate of 100%. The
mean deviation of the measured distances is 12.91
Pixel, which can be interpreted as a shift in x,y di-
rection of ∆x = ∆y =
√
12.91 = 3.59Pixel. Converted
Table 1: Results with stone alone.
Video Name 11-11 11-12 12-01 mean
# Frames 83 75 78 78.6
min 2.0 1.41 3.16 2.19
max 21.47 22.00 23.25 22.24
mean 12.47 11.85 14.41 12.91
σ 5.98 5.91 5.12 5.67
false positive 4 3 4 3.66
not detected 0 0 0 0
Table 2: Results with athlete behind stone.
Video Name 13-27 13-44 13-48 mean
# Frames 96 93 99 96.0
min 1.0 1.0 1.41 1.13
max 29.27 22.56 29.73 27.18
mean 9.58 10.03 11.51 10.37
σ 5.93 5.26 7.14 6.11
false positive 3 8 6 5.6
not detected 9 8 0 5.6
into the real scenario that pixel distance means a dif-
ference of 12.91pixels ∗4.7
pixels
mm
= 60.67mm. Over a
distance of 7.5m from the camera to the actual stone,
it is quite an acceptable result.
For the second scenario, the mean deviation of
the measured distances stays roughly the same with a
value of 10.37Pixel which is equal to a real world dis-
tance of 48.73mm. In comparison with scenario 1, the
not detection rate rises up to an average of 5.6 Frames
which means an detection rate of 94.17%, which is
quite accurate. The reason for the drop of frames is
the shadow the athlete throws onto the ice. In contrast
to the usual color of the ice, the ice in combination
with the shadow reduces the color distance between
the curling stone and the ice. This leads into black
pixels on the curling stones, because they are detected
as the background.
In the third scenario, the not-detection rate rises
up to a value of 28.89%. This high value comes from
the fact, that the athlete blocks the vision onto the
stone. While the stone was slightly visible for the hu-
man eye when checking the positions manually, it was
not enough for the algorithm to recognise the curl-
ing stone. Possible solutions for solving that problem
could be to use (1) a smaller histogram for a better
detection of small visible parts of the curling stone or
(2) to use multiple histograms for the detection. For
a example two histograms: the first is a histogram of
the curling stone, the second is a histogram which in-
volves the curling stone and also the leg of an athlete.
The false positives values for the three scenarios
are roughly equal with values between 3.66 Frame for
ICINCO 2020 - 17th International Conference on Informatics in Control, Automation and Robotics
468

Table 3: Results with athlete in front of stone.
Video Name 13-24 13-29 13-42 mean
# Frames 88 92 92 90.66
min 4.24 1.0 1.0 2.08
max 83.0 95.02 65.19 81.07
mean 17.46 20.196 17.03 18.23
σ 15.32 14.90 10.20 13.49
false positive 9 7 6 7.33
not detected 13 33 32 26.0
the first scenario to 7.33 Frames for the third scenario.
These values could have been reduced by choosing a
higher value for the minimum similarity for the his-
tograms. The false positive values reduce the overall
accuracy for the first scenario to 95.3 %, second to
88.33 %, and third to 63.26 %.
Computational Costs. The analyzing of an image
with the size of 1640x512Pixel with an histogram
containing 20x20Pixel results in an amount of 797040
images tiles. With a calculation time of 0.5698s
the time for analyzing one segment is 0.7µ. With
a framerate of 25FPS, the algorithm has a time of
1/25FPS = 40ms for calculating all the necessary
segments of the image to achieve the ability of an
online analyzing. This leads to an maximum num-
ber of segments of 55952 segments, which could be
achieved by a Region Of Interests which is limited to
an area of 256x256Pixel, according to equation (4).
When switching from the one core calculation on the
processor, used in the measurements to a multicore
application, and the simplified assumption, that the
number of segments per calculation time is equal to
the numbers of cores calculating on them, the Re-
gion of Interest could be increased. With all 16 cores
of the used processor, it would be possible to cal-
culate 55952Segments ∗16Cores = 859,232segments
which leads to an area of 946x946pixels. This values
are only theoretical, and only work when timings for
tasks like memory allocation and video converting are
neglected.
6 CONCLUSION
This paper presents a combination of two algorithms
for the detection of objects in videos. The two al-
gorithm are based on a background subtraction and a
histogram analyzing and were tested on an dataset of
videos which show a running curling stone in differ-
ent scenarios. These scenarios are (1) the stone runs
alone on the ice, (2) the stone runs with an sweeping
athlete behind the stone and (3) the stone runs with
an sweeping athlete between camera and stone. The
results of that analysis were compared to an manual
checking of the position of the curling stone in ev-
ery frame of the video. The result of the compari-
son shows a quite good accuracy for the first and the
second scenario with an average real world distance
error of 60.67mm from a distance of 7,5m from the
camera. Also the detection rate is excellent in the first
scenario, with a detection rate of 100% and 94.17%
for the second scenario. The third scenario is quite
difficult for an object detection, because an athlete is
partly blocking the view onto the curling stone, which
led to a quite high not detection rate of 28.89%.
While maintaining a good accuracy for the detec-
tion rate the computational costs went into the right
direction: The single core implementation of the al-
gorithm were able to search through one frame of the
image, with a resolution of 1640x512 in a time of
0.5698s. Using all cores the computation time would
shrink drastically. In combination with the use of a
Region Of Interest the algorithm could be able to an-
alyze videos on-line.
Future work on this topic will involve a multicore
implementation of the algorithms and the comparison
of computation time saving alternatives for the his-
togram analysis. Further investigation will also target
on reducing the amount of tiles, which the algorithm
has to analyze.
REFERENCES
Belongie, S., Malik, J., and Puzicha, J. (2002). Shape
matching and object recognition using shape contexts.
IEEE Transactions on Pattern Analysis and Machine
Intelligence, 24(4):509–522.
Huang, Y., Liao, I., Chen, C.,
˙
Ik, T., and Peng, W. (2019).
Tracknet: A deep learning network for tracking high-
speed and tiny objects in sports applications*. In
2019 16th IEEE International Conference on Ad-
vanced Video and Signal Based Surveillance (AVSS),
pages 1–8.
Man Zhu, Shuifa Sun, Shuheng Han, and Hongying Shen
(2012). Comparison of moving object detection algo-
rithms. In World Automation Congress 2012, pages
35–38.
Mason, M. and Duric, Z. (2001). Using histograms to de-
tect and track objects in color video. In Proceedings
30th Applied Imagery Pattern Recognition Workshop
(AIPR 2001). Analysis and Understanding of Time
Varying Imagery, pages 154–159.
Pieropan, A., Bj
¨
orkman, M., Bergstr
¨
om, N., and Kragic, D.
(2016). Feature descriptors for tracking by detection:
a benchmark. CoRR, abs/1607.06178.
Qiuxiang Liao (2016). Comparison of several color his-
togram based retrieval algorithms. In 2016 IEEE
Advanced Information Management, Communicates,
Combination of Algorithms for Object Detection in Videos on Basis of Background Subtraction and Color Histograms: A Case Study
469

Electronic and Automation Control Conference (IM-
CEC), pages 1670–1673.
Rublee, E., Rabaud, V., Konolige, K., and Bradski, G.
(2011). Orb: an efficient alternative to sift or surf.
pages 2564–2571.
Swain, M. J. and Ballard, D. H. (1990). Indexing via color
histograms. In [1990] Proceedings Third Interna-
tional Conference on Computer Vision, pages 390–
393.
Vaidya, B. and Paunwala, C. (2017). Comparative analy-
sis of motion based and feature based algorithms for
object detection and tracking. In 2017 International
Conference on Soft Computing and its Engineering
Applications (icSoftComp), pages 1–7.
Wu, S., Fan, Y., Zheng, S., and Yang, H. (2012). Object
tracking based on orb and temporal-spacial constraint.
In 2012 IEEE Fifth International Conference on Ad-
vanced Computational Intelligence (ICACI), pages
597–600.
ICINCO 2020 - 17th International Conference on Informatics in Control, Automation and Robotics
470
