
UniSim-Design Simulation and Analysis of a Sulphuric Acid
Manufacturing Plant with Double Absorption Process
Amine Mounaam
1,2
, Yasser Harmen
2,4
, Younes Chhiti
2,3
, Ahmed Souissi
1,2
, Mohamed Salouhi
1
and Mohamed El Khouakhi
2
1
All Laboratory, Ecole Mohammadia d’Ingénieurs, Mohammed V University, Rabat, Morocco
2
Innovation Lab for Operations, Mohammed VI Polytechnic University, Ben Guérir, Morocco
3
Ibn Tofail University, Kenitra, Morocco
4
Science Engineer Laboratory for Energy (LabSIPE), National School of Applied Sciences,
Chouaib Doukkali University, El Jadida, Morocco
msalouhi@gmail.com, mohamed.elkhouakhi@um6p.ma
Keywords: Sulphuric Acid, Modelling, Simulation, UniSim-Design, Chemical Reactions, Double Absorption Process,
UniSim-Thermo, Peng-Robinson, NRTL.
Abstract: In the sulphuric acid manufacturing industries, plant modelling and simulation is a challenging task to
minimize emissions, maximize production performance and revenue. In this context, this study presents the
steady behaviour of a double absorption process of an industrial sulphuric acid plant. The closed-loop process
is modelled and simulated using UniSim Design R451 simulator and validated with plant data. The model
includes principally: conversion reactor, plug flow reactors, absorbers, heat exchangers, pumps and
compressors. The parameters of the converter kinetic were fitted to the real plant data, while the other
parameters were estimated using conventional correlations. The results show a good agreement for the
complete plant, with an accuracy that exceeds 97 %. Besides the optimization aspects, UniSim Design plant
model is also useful for operator training, simulation of diverse scenarios and development of processes digital
twin.
1 INTRODUCTION
Worldwide, sulphuric acid is the most used chemical
products in the basic chemical industry (Moats et al.,
2006). Particularly, sulphuric acid plants are very
important in the modern processing industry, because
of its various applications; by far, in the phosphate
fertilizer industry (Kiss et al., 2010). The industrial
production of sulphuric acid was started with the
combustion of sulphur in the presence of steam and
natural nitrate. Nowadays, various technologies are
available to produce sulphuric acid. The contact
process is the most popular (Oni et al., 2018), overall,
sulphuric acid is produced in two main steps: (1)
oxidation of sulphur dioxide SO
2
to sulphur trioxide
SO
3
, and (2) absorption of SO
3
by diluted sulphuric
acid to form concentrated sulphuric acid. Indeed, the
contact process has passed through two stages: single
absorption process, where 97 % of SO
2
is oxidized to
SO
3
and the unoxidized SO
2
is emitted to the
environment. Next, in 1968, the double contact
process was introduced to achieve 99.5 % or higher
conversion rate, whereas the unreacted SO
2
and SO
3
are released to the environment (Moeller & Winkler,
1968). In this context, improving the performance of
the double contact process to achieve high energy
efficiency and maximize revenues, and minimize
environmental impact remain major challenges (Lee
et al., 2019).
In such case, two approaches are available:
experimental tests and/or simulation and modelling.
In fact, the experimental tests exhibit some
drawbacks, such as high cost of materials acquisition
and maintenance, and validity area of the solution
complexity. In contrast, the main benefits of
simulation and model-based control and optimization
applications for industrial plants can be summarized
as: minimization of the experimental tests time and
cost, high flexibility in the process flowsheet
elaboration with the ability to change and replace
equipment (Boschert & Rosen, 2016), and also the
development of processes digital twin (Parrott &
Mounaam, A., Harmen, Y., Chhiti, Y., Souissi, A., Salouhi, M. and El Khouakhi, M.
UniSim-Design Simulation and Analysis of a Sulphuric Acid Manufacturing Plant with Double Absorption Process.
DOI: 10.5220/0009832300910100
In Proceedings of the 10th International Conference on Simulation and Modeling Methodologies, Technologies and Applications (SIMULTECH 2020), pages 91-100
ISBN: 978-989-758-444-2
Copyright
c
2020 by SCITEPRESS – Science and Technology Publications, Lda. All rights reserved
91

Warshaw, 2017). Therefore, several stationary and
dynamic modelling and simulation studies have been
performed to optimize the sulphuric acid
manufacturing plant. In particular, numerous studies
have been conducted on the steady and dynamic
modelling of SO
2
oxidation reactors, which focused
on the design and operating conditions. For example,
Günther et al. (Günther et al., 2012) developed a
mathematical model to describe the dynamics
oxidation of SO
2
to SO
3
. The results proposed a new
design for zero-emission to the environment. Also,
Mann et al. (Gosiewski, 1993) proposed a new
dynamic simulation based on ordinary differential
equations, which describes the behaviour of a single-
bed reactor in the contact sulphuric acid plant, thus,
several variables have been studied, such as flow
start-up and initial fixed-bed reactor temperatures.
Interestingly, the results showed that the model can
be used for the qualitative analysis of SO
2
oxidation.
Recently, Sørensen et al. (Sørensen et al., 2015)
validated a dynamic model of SO
2
oxidation using
experimental data from a sulphuric acid pilot plant.
The results demonstrated that the dynamic simulation
can efficiently be used to evaluate operating
conditions, equipment sizing with respect to the
environmental impact.
In contrast to the previous studies, few studies
were conducted for the complete sulphuric acid plant.
Notably, Kiss et al. (Kiss et al., 2010) presented a
complete model of an industrial sulphuric acid plant
using gPROMS tool. The results demonstrated that
40% of SO
x
emissions can be reduced by the
optimization of the split fraction or feed flow rates. In
addition, they developed an excel interface, which
simulates the real behaviour of the plant. Also, the
results of Oni et al. (Oni et al., 2018) showed that the
process can be operated at different optimal
conditions, and the ideal conditions was 9.5 ppm of
SO
x
and 70.9 ppm of acid mist and 143.0 M$/y of net
revenue. Likewise, Rahman et al. (Rahman et al.,
2019) developed a new model that offers a cost-
effective solution to reduce energy demand and limit
emissions of aromatic compounds. In addition to the
above-mentioned study, Chowdhury et al.
(Chowdhury et al., 2012) simulated and optimized a
simplified process for the production of sulphuric
acid using Aspen HYSYS simulator. The results
exhibited that the process plant simulation is an
effective approach to optimizing annual profit. On the
other hand, various limitations are noted in the
models mentioned, for example, the non-
consideration of the thermal kinetics of the
conversion reactions, which is a key step in the
sulphuric acid manufacturing plant.
Based on the previous investigations, a
considerable effort has been made to improve the
performance of the double-absorption contact
process. Indeed, these studies were based on multi-
objective optimization, which considers
environmental impact as a main objective such as
sulphuric acid production. In this context, it is
important to dispose of more powerful and flexible
modelling and simulation solutions, which reflect the
experimental plant reality, and resolve the limitations
of the existed models. In this study, the closed loop
of sulphuric acid process is modelled and simulated
using UniSim Design R451 simulator and validated
with plant data.
2 PROCESS DESCRIPTION
The simplified bloc-flow diagram of the sulphuric
acid manufacturing process with double absorption is
presented in Figure 1.
Firstly, moist air is filtered in an air filter to
eliminate particles contained in the air. To reduce its
moisture content, the air is dried by absorption in a
drying tower using the circulating sulphuric acid
H
2
SO
4
. The liquid sulphur that has been prepared in
the melting unit is burned with the dry air in the
sulphur burner, which forms the sulphur dioxide SO
2
.
The reaction of sulphur combustion is exothermic;
thus, a waste heat boiler is paced at the outlet of the
sulphur burner to recover the heat of the sulphur
combustion and generate the saturated steam. As the
optimal required temperature for the sulphur dioxide
SO
2
conversion is 420°C, a by-pass of the sulphur
burner is mixed with the waste heat boiler outlet to
regulate the desired temperature. The conversion of
SO
2
into SO
3
is carried out in a converter formed by
four catalytic bed. The vanadium oxide V
2
O
5
is used
as a catalyst to accelerate the SO
2
/SO
3
conversion. In
order to reach the high desired conversion on SO
2
, the
gaseous outlet flow of the 1st converter bed passes
through an inter-pass heat exchanger to regulate its
temperature before feeding the 2nd converter bed.
Between each bed of the four converter beds, heat
exchangers and economizers are used for the same
raison. After passing the three first beds of the
converter, the outlet flow of the 3rd bed feeds the first
absorption tower, in which the SO
3
formed reacts
with the H
2
O presented in the diluted circulating
H
2
SO
4
98% to form the concentrated H
2
SO
4
99%.
The outlet gas flow of the first absorption tower
feeds the 4th bed of the converter where the remained
SO
2
is converted to SO
3
, before feeding the second
absorption tower in order to absorb the formed SO
3
.
SIMULTECH 2020 - 10th International Conference on Simulation and Modeling Methodologies, Technologies and Applications
92
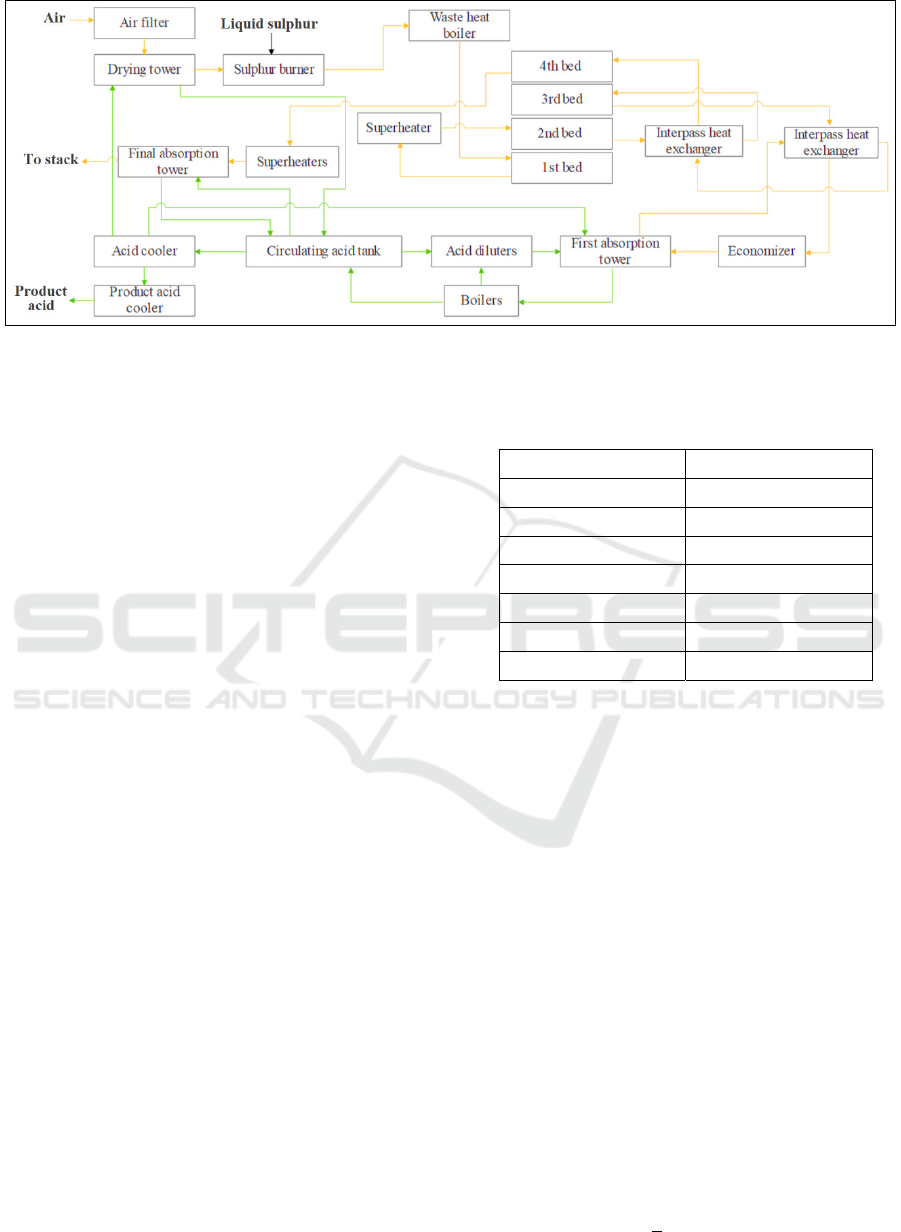
Figure 1: Bloc-flow diagram of the studied process.
The conversion rate of SO
2/
SO
3
is 99.99%, and the
absorption rate of SO
3
absorption in water is around
99.98%. Also, a sulphuric acid circulation tank is
used to feed the drying tower, the first and the final
absorption tower with the circulating sulphuric acid.
The cold fluid used to cool the sulphur acid in the acid
cooler and the product acid cooler is sea water.
Boilers at the liquid outlet of the first absorption
tower is used to recover the energy produced by the
absorption reaction.
3 PROCESS SIMULATION
3.1 Components
In this study, UniSim-Design R451 simulator was
used to perform the simulation of the studied
sulphuric acid manufacturing process.
The simulation goes through two principal steps:
the basis environment configuration and the
simulation environment configuration. At the basis
environment stage, the necessary components
included in the manufacturing process are added, and
the appropriate fluid-packages must be chosen to
ensure a correct prediction of flow and mixture
properties according to their temperature and pressure.
At the simulation environment stage, material and
energy streams are added and configured. Also, the
flowsheet of the studied process is elaborated. Finally,
the different reactions that governs the process must be
specified. For the sulphuric acid manufacturing
process, all the required components are available in
the simulator components library, except the raw solid
sulphur which has been replaced directly by the liquid
sulphur. The components used in this simulation are
represented in the following table:
Table 1: UniSim Design components list for the sulphuric
acid process simulation.
Component name Component formula
Oxygen
2
O
Nitrogen
2
N
Water O
2
H
Sulphur liquid S
Sulphur dioxide
2
SO
Trioxide sulphur
3
SO
Sulphuric acid
4
SO
2
H
3.2 Fluid-packages
The UniSim-Thermo was selected as advanced
thermodynamics in this simulation. The non-random
two-liquid model (NRTL) model was selected for the
liquid phase. It is used to correlates the activity
coefficients of the different components presented in
liquid phase according to their mole fractions. The
Peng-Robinson (PR) model was selected for the
vapor phase. Henry’s Law was selected for the Henry
constant and solubility coefficients estimation of
gaseous components in sulphuric acid, especially
water and trioxide sulphur.
3.3 Reactions
As mentioned above in the process description
section, four reactions are involved in the acid
sulphuric manufacturing process:
SO
SO
(1)
SO
1
2
O
SO
(2)
UniSim-Design Simulation and Analysis of a Sulphuric Acid Manufacturing Plant with Double Absorption Process
93
SO
H
O H
SO
(3)
H
SO
2H
O2H
O
SO
(4)
The reaction (1) represents the sulphur
combustion within the sulphur burner. The reaction
(2) describes the conversion of the sulphur dioxide
SO
2
to the sulphur trioxide SO
3
using V
2
O
5
. The
reaction (3) represents the sulphur trioxide SO
3
absorption in water H
2
O within the two absorption
towers, while the reaction (4) represents the sulphuric
acid H
2
SO
4
dilution with the water absorbed in the
drying tower. All four reactions are exothermic and
generate an enormous amount of energy
3.4 Unit Operations Simulation
The combustion of the liquid sulphur was simulated
using an adiabatic conversion reactor. The
combustion is considered complete with full
consumption of liquid sulphur. The mass balance of
the sulphur burner is given by the following equation:
N
,
N
,
ν
.ξ
(5)
H
H
ξ.H
𝑟𝑒𝑎𝑐𝑡𝑖𝑜𝑛
(6)
H
∑
h
,
N
,
(7)
h
,
C
,
T
.dT
(8)
H
∑
h
,
N
,
(9)
h
,
C
,
T
.dT
(10)
Where:
N
,
, N
,
: inlet and outlet molar flow of the
component i (mol/h);
ν
: stoichiometric coefficient of the component
i in the reaction (1);
ξ N
,
.
H
, H
: inlet and outlet heat flows (kJ/h);
H
: molar enthalpy of the reaction (1)
(kJ/mole);
h
,
, h
,
: inlet and outlet molar enthalpy of
the component i (kJ/mole);
C
,
: specific heat of the component i (kJ/mole.
°C);
T
,T
,T
: reference, inlet and outlet
temperature of the sulphur burner, respectively
(°C).
The catalytic conversion of the SO
2
to SO
3
was
simulated by a plug flow reactor with as a kinetic
heterogenous reaction. In 1997, Froment and
Bischoff have proposed a kinetic model to estimate
the rate of this conversion by the following equation
(Anton A. Kiss et al, 2010):
r
K
.P
.P
.1
P
K
. P
.P
1
K
.P
K
.P
²
(11)
Where:
r
: kinetic reaction rate of the reaction (2)
(kmol/kg.cat. s);
P
: pressure of the component i (atm);
K
1
: first rate constant (1/atm1/2);
K
p
: second rate constant (kmol/lh.cat.atm².s);
K
2
: third rate constant (atm-1);
K
3
: third rate constant (atm-1).
The rate constants K
1
, K
p
, K
2
, K
3
were calibrated and
adjusted using the simulated plant data, and they are
given by:
K
exp15.31
45501
RT
(12)
K
exp41.30
93943
RT
(13)
K
exp71.74
71655
RT
(14)
K
exp15.31
437269
RT
(15)
The absorption reactions (3) and (4) were
simulated using the absorber model integrated in the
simulator and based on column theory. The multi-
stage absorption towers present a series of
equilibrium and non-equilibrium flash stages. At each
stage, there can be a mass and heat transfers between
the two phases that feed the column in counter
current. The following equations show the mass
transfer balance between the components i and j in the
gas and liquid streams respectively, within an
absorption tower:
4
π.D
.
d
dz
Q
.C
,
N
.A
(16)
4
π.D
.
d
dz
Q
.C
,
N
.A
(17)
N
.
.
.C
,
; N
N
(18)
SIMULTECH 2020 - 10th International Conference on Simulation and Modeling Methodologies, Technologies and Applications
94
Where:
D: absorber diameter (m);
Q
,Q
: gas and liquid volumetric flow rates
(m3/h);
C
,
,C
,
: component i and component j
concentration in the gas and liquid respectively
(mole/m3);
N
: molar flow rate of the component i
(mole/m2.h);
A
: specific area (m2/m3);
k
,k
: gas and liquid partial mass transfer
coefficients;
H
: Henry coefficient of the component i;
P
: partial pressure of the component i (Pa);
D
: mass diffusivity of the component i.
The simulation of the heat transfer operations
within the process was realized using the heat
exchanger model presented in the simulator library.
This model is based on the material and energy
balance equations. The Log-Mean Temperature
Difference LMTD method is adopted to calculate the
heat transfer flow rate W
exchanged between the
two flows:
W
U
.A
.ΔT
.F
(19)
ΔT
T
,
T
,
T
,
T
,
ln
T
,
T
,
T
,
T
,
(20)
Where:
W
: heat transfer flow rate (W);
U
: heat transfer coefficient (W/m². K);
A
: heat transfer areas (m²);
F
: correction factor.
The pumps used to increase the pressure of liquid
streams were simulated using the centrifugal pump
model assuming that that fluid is incompressible. The
pump simulation is based on the general pump
equation that gives the ideal power required to rise the
liquid pressure according the inlet and outlet
pressures, flow rate and density:
W
P
P
.M
ρ
(21)
W
H
H
(22)
Effenciency %
W
W
(23)
Where:
W
: ideal required power (W);
W
: actual required power (W);
P
,P
: inlet and outlet pressure (Pa);
M
: inlet mass flow rate (kg/h);
ρ: fluid density (kg/m3);
H
,H
: inlet and outlet heat flow rates (W);
Effenciency %: pump efficiency (%).
The compressors used to increase the pressure of
the gas streams were simulated by the centrifugal
compressor model based on the isentropic efficiency.
The isentropic ideal power and the actual power
required for gas compression is defined as follow:
W
M
.
𝑛
n1
.
P
ρ
.
P
ρ
1.F
(24)
W
H
H
(25)
Effenciency
%
W
W
(26)
Where:
ρ
: gas inlet density (kg/m3);
n: volume exponent;
F
: correction factor;
Effenciency %: compressor efficiency (%).
The following table regroups the different
UniSim-Design equipment models used to perform
this simulation:
Table 2: UniSim Design equipment models for the studied
process simulation.
Equipment model Description
Conversion reactor Sulphur combustion
Plug flow reactor SO
2
conversion
Absorber H
2
O and SO
3
absorption
Heat exchanger Heat transfer
Cooler Fluids cooling
Pump Liquids pumping
Compressor Gas compression
Splitter Flows division
Mixer Flows mixing
Valve Flows control
4 RESULTS AND DISCUSSION
In order to configurate the basis environment of the
simulator, the chemical components involved in the
UniSim-Design Simulation and Analysis of a Sulphuric Acid Manufacturing Plant with Double Absorption Process
95
sulphuric acid manufacturing process were defined
(Table 1). In addition, the necessary fluid-packages
(PG for the gaseous phase and NRTL for the liquid
phase) were specified. The four principal reactions
governing the process (liquid sulphur burning,
sulphur dioxide conversion, sulphur trioxide
absorption and sulphuric acid dilution) were also
defined with their reaction rates. Next, in the
simulation environment of the simulator, the
equipment models were inserted, and the global
flowsheet of the studied process was elaborated
including the gas circuit and the acid circuit.
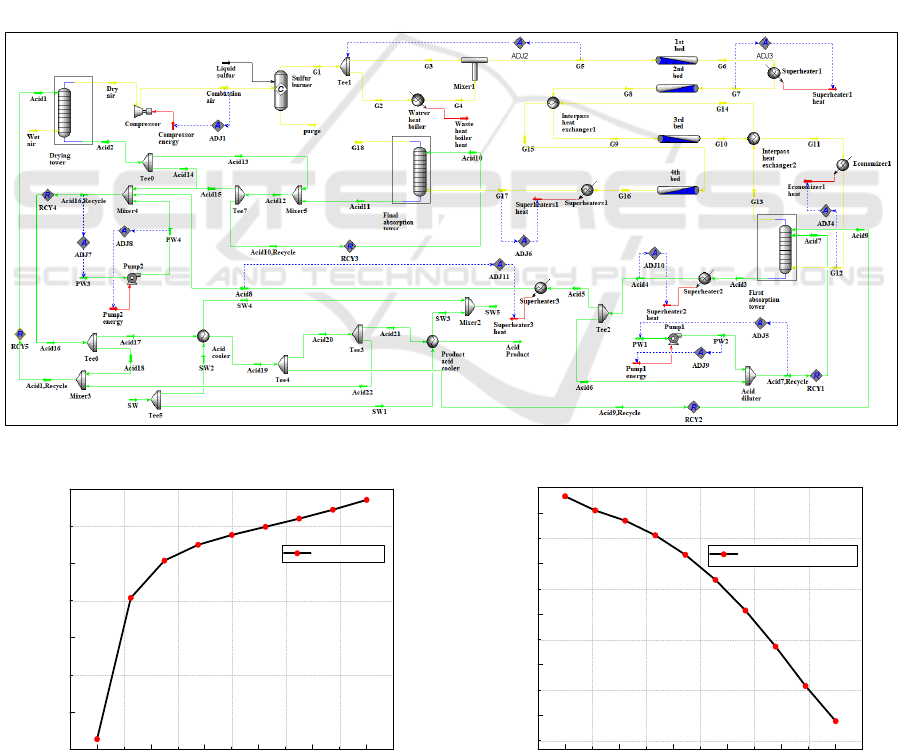
Figure 2. shows the simulation of the sulphuric
acid manufacturing plant with double absorption
performed under the UniSim-Design R451 simulator.
The key streams used to perform this simulation are
summarized in Table III. for the liquid sulphur and
the wet air properties, Table IV. for the operating key
streams of the circulating sulphuric acid, and Table
V. for the dilution and cooling water key streams.
Figure 3 presents the simulation results of the
sulphuric acid concentration within the drying tower.
The circulating sulphuric acid used for air-drying
feeds the column from the top at the concentration of
98.6%, and absorbs the water contained in the wet air
that feeds the column from the bottom. The sulphuric
acid is diluted and leaves the drying column at the
concentration of 98.33% as shown in the simulation
results. It is observed that the dry air entering the
column at 25°C leaves at the temperature of 65.8°C,
which is justified by the exothermicity of the
sulphuric acid dilution reaction.
The dry air leaving the drying column is
compressed before feeding the sulphur burner. An
adjustment of the compressor energy stream is used
in order to maintains the pressure of the dry air at 153
kPa. The energy required to increase the air
Figure 2: UniSim-Design simulation of the sulphuric acid manufacturing process with double absorption.
0,0 0,2 0,4 0,6 0,8 1,0
60
62
64
66
Temperature
(a)
Temperature (°C)
Stage Position
0,0 0,2 0,4 0,6 0,8 1,0
0,9834
0,9840
0,9846
0,9852
0,9858
H
2
SO
4
Concentration
(b)
Mass Fraction (% H2SO4)
Stage Position
Figure 3: Temperature (a) and sulphuric acid concentration (b) variations in the drying tower stages.
SIMULTECH 2020 - 10th International Conference on Simulation and Modeling Methodologies, Technologies and Applications
96
Table 3: Liquid sulphur and wet air properties.
Stream Wet air Liquid sulphur
Flow rate (m
3
/h) 540 32
Temperature (°C) 25 130
Pressure (kPa) 101.3 1920
O
2
(%) 20.68 0
N
2
(%) 78.04 0
H
2
O (%) 1.28 0
S (%) 0 100
Table 4: Sulphuric acid operating key streams.
Stream Acid 1 Acid 7 + Acid 9 Acid 10
Description
Sulphuric acid in the
drying towe
r
Sulphuric acid in the first
absorption towe
r
Sulphuric acid in the final
absorption towe
r
Flow rate (m
3
/h) 1245 2890 1030
Concentration (%H
2
SO
4
) 98.6 98.97 98.6
Table 5: Water operating key streams.
Stream SW PW1 PW3
Description
Sea water for the
sulphuric acid cooling
Process water for the
strong sulphuric acid
dilution
Process water for the
circulating sulphuric acid
dilution
Flow rate (m
3
/h) 2765 28 3
pressure from 98 kPa to 154 kPa (Figure 4) is
estimated by the simulator at 8302 kW, with an
adiabatic efficiency of 75% and a polytropic
efficiency of 76.52%.
60 70 80 90 100 110 120 130 140
90
100
110
120
130
140
150
160
Pressure (kPa)
Temperature (°C)
Figure 4: P-T curve of the air compressor.
The liquid sulphur feeds the sulphur burner at
130°C and 1920kPa and reacts with the dry air to
form the SO
2
. The combustion gas mixture produced
at the sulphur burner leaves at the temperature of
1216 °C with a complete combustion of the liquid
sulphur. The reaction heat of liquid sulphur
combustion is calculated at 25°C as 298190 kJ/mole.
A small amount of the SO
3
is also produced because
of the high temperature within the sulphur burner.
The molar composition of the combustion gas is:
9.7% of O
2
, 79.16% of N
2
, 10.87% of SO
2
and 0.27%
of SO
3
. The hot combustion gas passes through a
waste heat boiler to recover a part of the combustion
heat and to promote the required temperature of the
SO
2
conversion. An adjustment of the by-pass
fraction at the inlet of the waste heat boiler is used to
maintain the desired temperature.
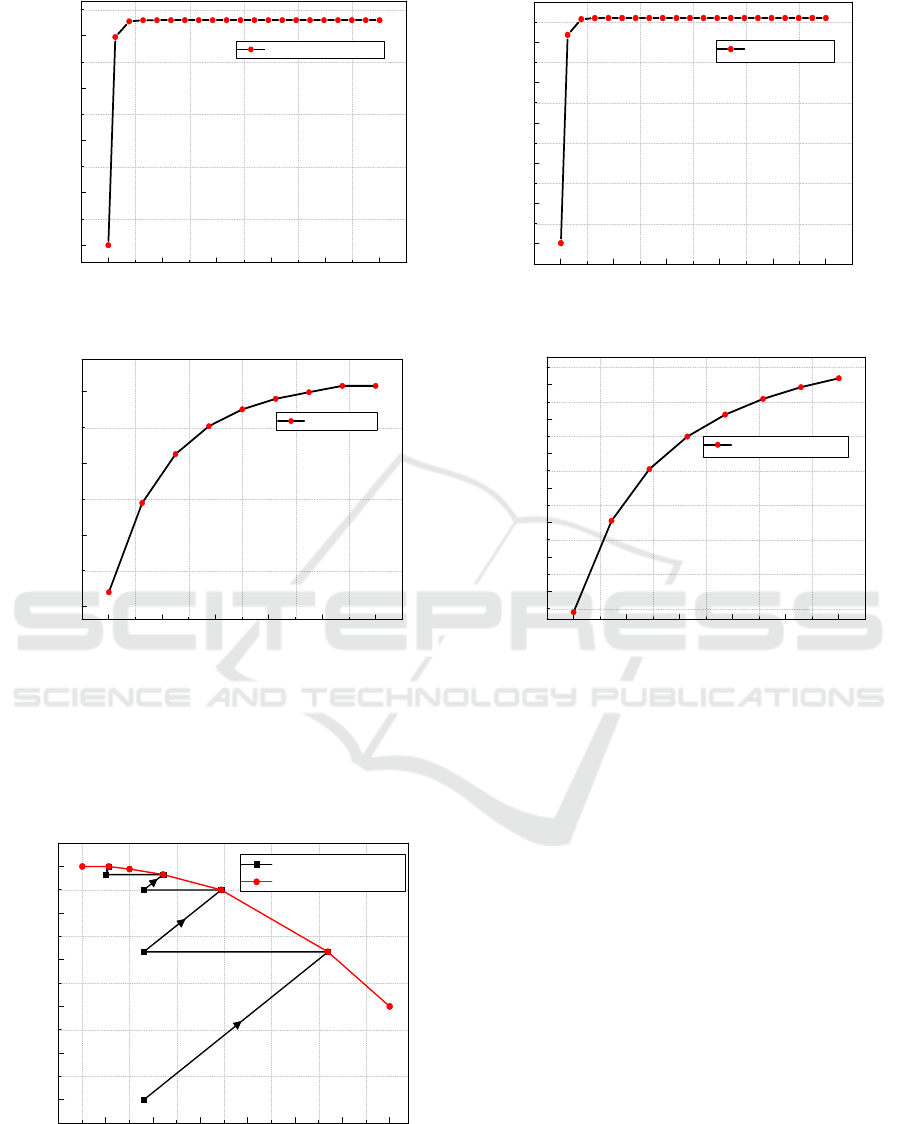
As mentioned in the process description section,
the converter is formed by four catalytic bed, and
each bed is simulated by a plug flow reactor. The
temperature at the inlet of the three first beds is
adjusted to 440°C by superheaters and inter-pass heat
exchangers, and at 400 °C for the last bed. As
illustrated in the SO
2
conversion-Temperature curve
(Figure 5), the four operating lines represents
progress of the conversion rate within the four beds
of the converter. The SO
2
conversion rate is
accompanied with a temperature increase since the
conversion reaction is exothermic. Once the
conversion rate riches the equilibrium curve, a
cooling step is required to achieve a higher
conversion rate. Several conversion stages and inter-
UniSim-Design Simulation and Analysis of a Sulphuric Acid Manufacturing Plant with Double Absorption Process
97
0,0 0,2 0,4 0,6 0,8 1,0
390
393
396
399
402
(a)
Temperature (°C)
Reactor Len
g
ht
Reactor Temperature
0,0 0,2 0,4 0,6 0,8 1,0
0
10
20
30
40
50
60
(b)
SO
3
Molar Flow (10
3
mole/h)
Reactor Lenght
SO
3
Molar Flow
Figure 5: Temperature (a) and SO
3
molar flow (b) variations in the 4
th
catalytic bed.
0,0 0,2 0,4 0,6 0,8 1,0
188,10
188,65
189,20
189,75
Temperature
(a)
Temperature (°C)
Stage Position
0.0 0.2 0.4 0.6 0.8 1.0
0.9900
0.9905
0.9910
0.9915
0.9920
0.9925
0.9930
H
2
SO
4
Concentration
(b)
Mass Fraction (% H
2
SO
4
)
Stage Position
Figure 6: Temperature (a) and sulphuric acid concentration (b) variations in the first absorption tower.
step cooling are necessary. The outlet temperatures
are 643°C, 527°C, 462°C and 404°C for the converter
stages, respectively. The SO
2
conversion rates in the
three first beds are 63.43%, 89.95%, 96.54%
respectively.
350 400 450 500 550 600 650 700
0
20
40
60
80
100
SO2 Conversion Rate (%)
Temperature (°C)
SO2 Conversion rate
Equilibrum curve
Figure 7: Conversion-Temperature curve of the catalytic
converter.
The outflow gas of the 3rd bed is cooled and sent
to the first absorption tower in order to absorb the SO
3
produced by the SO
2
catalytic conversion, then gone
back to the 4th bed in which the remaining SO
2
is
converted into SO
3
. Figure. 6. Shows the temperature
and the SO
3
mole flow variations along the 4th bed.
The SO
2
conversion rate at the last bed achieves
99.97%. However, the conversion of the SO
2
into SO
3
is accompanied with a temperature increase due to the
heat generated by the reaction as illustrated in Figure
6. The molar enthalpy of this reaction is given by the
simulator as 98925 kJ/mole.
The absorption rate of SO
3
is around 99.98% in the
first absorption tower and 100% in the second
absorption tower. As shown in the simulation results
of the first absorption tower of Figure 7, the
absorption of SO
3
is an exothermic reaction that
generates 97333kJ/mole. The circulating sulphuric
acid 98.97% feeds the first absorption tower at
189°C, and leaves at the concentration and
temperature of 99.30% and 173°C, respectively.
However, it feeds the second absorption tower with a
concentration of 98.60% and a temperature of 65°C,
SIMULTECH 2020 - 10th International Conference on Simulation and Modeling Methodologies, Technologies and Applications
98
1st bed 2nd bed 3rd bed 4th bed
55
60
65
70
75
80
85
90
95
100
(a)
SO
2
Conversion Rate (%)
Plant data
Unisim-Design
1st tower 2nd tower
99,6
99,8
100,0
(b)
SO3 Absorption Rate (%)
Plant data
Unisim-Design
Figure 8: UniSim Design converter (a) and absorption towers (b) simulation results versus plant data.
0 100 200 300 400 500 600
0
100
200
300
400
500
600
R² = 0.9989
Unisim-Design
Plant data
Flow rate (m
3
/h)
(a)
0 200 400 600 800 1000 1200
0
200
400
600
800
1000
1200
R² = 0.9991
Unisim-Design
Plant data
Temperature (°C)
(b)
60 80 100 120 140 160 180 20
0
60
80
100
120
140
160
180
200
R² = 0.9773
Unisim-Design
Plant data
Pressure (kPa)
(a)
98,0 98,5 99,0 99,5 100,
0
98,0
98,5
99,0
99,5
100,0
R² = 0.9897
Unisim-Design
Plant data
H
2
SO
4
Concentration (%)
(d)
Figure 9: Simulation results versus plant data correlation for the flow rates (a), temperatures (b), pressures (c) and sulphuric
acid concentrations (d).
and leaves the tower at a concentration of 98.67% and
the temperature of 82.76°C (after absorbing the SO
3
generated in the 4th catalytic bed).
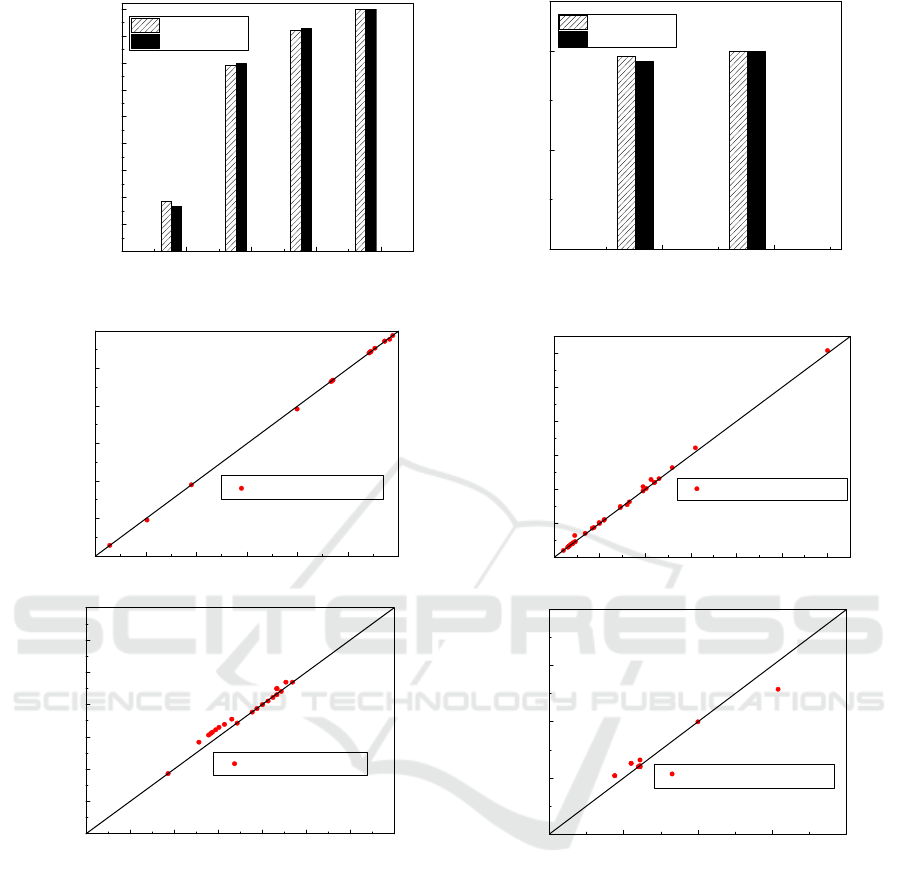
In order to validate the process simulation, the
simulation results of the SO
2
conversion rate within
the four catalytic beds of the converter, and the SO
3
absorption rate within the two absorption towers were
compared to the plant data as shown in Figure 8. In
addition, the temperature, pressure, flow rate and
sulphuric acid concentration values found in the
simulation were compared to the real plant
measurement and have shown a high accuracy
(Figure 9) between 97% and 99%. The comparison of
the results indicates that the simulations performed
under UniSim Design R451 simulator represent a
high level of validity to accurately describe the
industrial process.
5 CONCLUSIONS
In this study, a steady-state simulation of a double
absorption sulphuric acid plant was conducted using
Honeywell UniSim-Design R451 simulator. The
simulated process includes gas and acid circuits, with
a SO
2
conversion rate of 99.9%, and a SO
3
absorption
UniSim-Design Simulation and Analysis of a Sulphuric Acid Manufacturing Plant with Double Absorption Process
99

rate of 99.98%, and an average of 140 ppm of SO
2
gas
sent to the atmosphere. The developed model and
simulation includes the different manufacturing
process units: drying tower and air compressors,
sulphur burner and heat recovery boiler,
SO
2
converter and heat exchangers, first absorption
tower and energy economizers, second absorption
tower, acid and water pumps, acid diluter systems,
acid cooling systems and acid circulating tank. The
results obtained were validated using the real data
extracted from the manufacturing plant under the
same operating conditions, and a considerable
accuracy of 97% was observed. Thus, the plant
modelling and simulation using UniSim Design R451
simulator can be used to efficiently calculate mass
and energy balances. Furthermore, it can be used to
improve the manufacturing process, test advanced
process control methods and develop digital twins to
facilitate the digital transformation of industries.
REFERENCES
Boschert, S., & Rosen, R. (2016). Digital twin-the
simulation aspect. In Mechatronic Futures: Challenges
and Solutions for Mechatronic Systems and Their
Designers.
Chowdhury, N. B., Hasan, Z., & Biplob, A. H. M. (2012).
HYSYS Simulation of a Sulfuric Acid Plant and
Optimization Approach of Annual Profit. Journal of
Science (JOS).
Gosiewski, K. (1993). Dynamic modelling of industrial so2
oxidation reactors part I. model of “hot” and ’cold’start-
ups of the plant. Chemical Engineering and Processing.
Günther, R., Schöneberger, J. C., Arellano-Garcia, H.,
Thielert, H., & Wozny, G. (2012). Design and modeling
of a new periodical-steady state process for the
oxidation of sulfur dioxide in the context of an emission
free sulfuric acid plant. In Computer Aided Chemical
Engineering.
Kiss, A. A., Bildea, C. S., & Grievink, J. (2010). Dynamic
modeling and process optimization of an industrial
sulfuric acid plant. Chemical Engineering Journal.
Lee, J., Cameron, I., & Hassall, M. (2019). Improving
process safety: What roles for digitalization and
industry 4.0? Process Safety and Environmental
Protection.
Moats, M., Davenport, W. G., & King, M. J. (2006).
Sulfuric Acid Manufacture. In Sulfuric Acid
Manufacture.
Moeller, W., & Winkler, K. (1968). The double contact
process for sulfuric acid production. Journal of the Air
Pollution Control Association.
Oni, A. O., Fadare, D. A., Sharma, S., & Rangaiah, G. P.
(2018). Multi-objective optimisation of a double
contact double absorption sulphuric acid plant for
cleaner operation. Journal of Cleaner Production.
Parrott, A., & Warshaw, L. (2017). Industry 4.0 and the
digital twin. Deloitte University Press.
Rahman, R. K., Ibrahim, S., & Raj, A. (2019). Multi-
objective optimization of sulfur recovery units using a
detailed reaction mechanism to reduce energy
consumption and destruct feed contaminants.
Computers and Chemical Engineering.
Sørensen, P. A., Møllerhøj, M., & Christensen, K. A.
(2015). New dynamic models for simulation of
industrial SO2 oxidation reactors and wet gas sulfuric
acid plants. Chemical Engineering Journal
SIMULTECH 2020 - 10th International Conference on Simulation and Modeling Methodologies, Technologies and Applications
100
