
Impact of Human and Content Factors on Quality of Experience of
Online Video Streaming
Omer Nawaz, Markus Fiedler and Siamak Khatibi
Dept. of Technology and Aesthetics, Blekinge Institute of Technology, Karlshamn, Sweden
Keywords:
Quality of Experience, Mean Opinion Score, User Perception, Multimedia Communication.
Abstract:
Although expensive, but the most reliable measure of user perception is by direct human interaction by taking
input from the user about a stimulus quality. In our previous studies, we have identified some subjects getting
bored and losing focus by rating lots of video clips of small duration during subjective quality assessments.
Moreover, the psychological effects, i.e. user delight, frequency of watching online videos (experience), mood,
etc. must not influence the user Mean Opinion Score (MOS) for determining the quality of the shown stimuli.
In this paper, we have investigated the impact of user delight, frequency of watching online video content
(experience) and different mood levels on MOS for streamed video stimuli in various network conditions by
subjective quality assessments. We have observed a slight tendency of better scores when the user likes the
stimulus. However, our results show that if the subjective assessments are conducted by carefully following
the guidelines, the users impartially rate the video stimuli solely based on the quality artifacts irrespective of
their delight towards the shown content. Although, we have observed an effect of user mood on MOS ratings;
for almost all the stimuli, but the results suggest the need of more detailed study; i.e. with a large and diverse
set of subjects, to obtain significant statistical relevance.
1 INTRODUCTION
The video traffic accounts for 75% of global Internet
traffic with per-capita share of 16 GB in 2017 and it’s
forecasted to reach a share of 82% with per-capita of
50GB by the year 2022. There would be more than
28 billion estimated networked devices and the share
of traffic generated by wireless and mobile devices is
forecasted to reach around 71% (Cisco, 2018). This
shows a clear trend of watching online video content
on the go, i.e. IPTV, video on demand, etc. The re-
sult is 11-year low subscription rate of television ser-
vice in United States due to the low-cost and flexi-
bility associated with online video streaming alterna-
tives as per American Customer Satisfaction Index of
2018 (Johnston, K., 2018). According to the same
report, the video streaming services have grown ex-
ponentially in the previous years and there is no indi-
cation that the trend is slowing down. Thus, there is a
massive interest and stake associated with the user ex-
perience for both Internet service providers and video
content creators. The Quality of Experience (QoE) is
defined by ITU-T as ’The degree of delight or annoy-
ance of the user of an application or service.’ (ITU-
T Rec. P.10/G.100, 2017), with reference to the full
definition that continues with ’It results from the ful-
fillment of his or her expectations with respect to the
utility and / or enjoyment of the application or ser-
vice in the light of the user’s personality and current
state’ (Qualinet, 2013).
The effects of neglecting QoE are evident from
the latest report of comparing Internet service qual-
ity in UK, which suggests that 84% of the customers’
complaints for fixed broadband were related to slow
speeds and intermittent or total loss of service with
only 12% complaining about billing, pricing or pay-
ment (Ofcom, 2019). Although expensive, the most
reliable measure of user perception is by direct hu-
man interaction and subjective assessments are done
by taking direct input from the user about a stimu-
lus quality via conducting a survey. The Mean Opin-
ion Score (MOS) is defined by ITU-T in (ITU-T Rec.
P.910, 2008) and has become a de-facto standard due
to its wide range of adoptability for speech quality
and multimedia applications. The validity of these
qualitative subjective tests is primarily dependent on
obtaining the user response in a tightly controlled en-
vironment. There are many factors that may influ-
ence the user ratings and recommendations have been
provided by ITU-R to control the monitoring con-
Nawaz, O., Fiedler, M. and Khatibi, S.
Impact of Human and Content Factors on Quality of Experience of Online Video Streaming.
DOI: 10.5220/0009831400590066
In Proceedings of the 17th International Joint Conference on e-Business and Telecommunications (ICETE 2020) - DCNET, OPTICS, SIGMAP and WINSYS, pages 59-66
ISBN: 978-989-758-445-9
Copyright
c
2020 by SCITEPRESS – Science and Technology Publications, Lda. All rights reserved
59
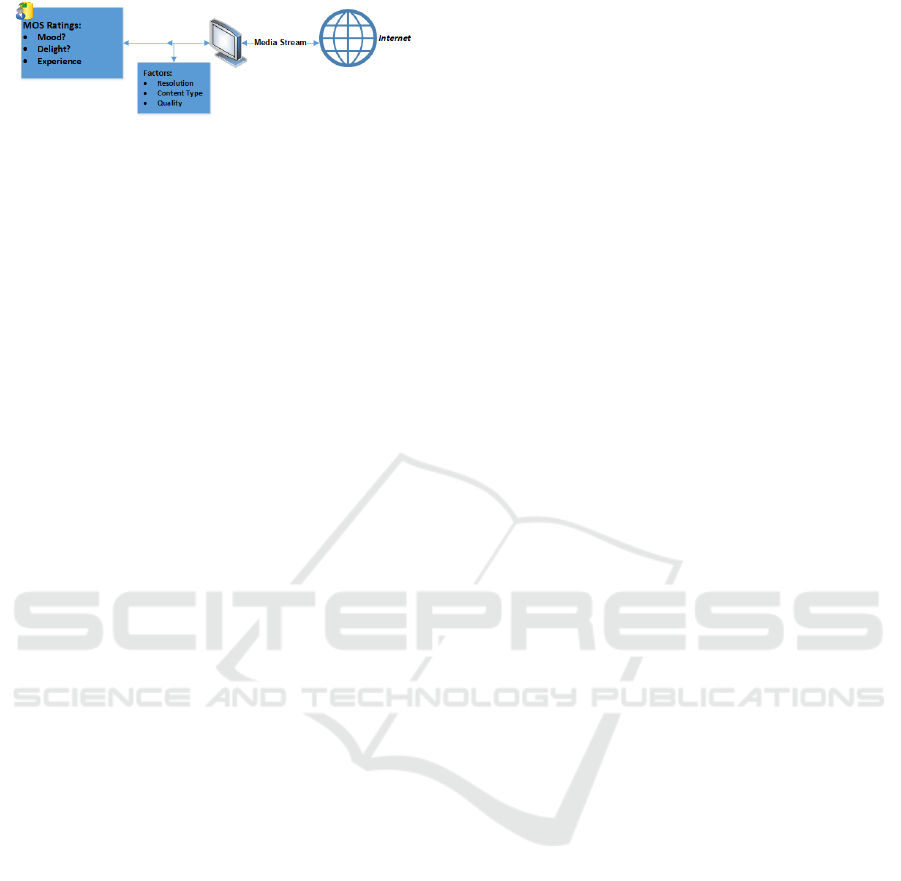
Figure 1: User information including watching frequency.
ditions (ITU-R Rec. BT.500-10, 2012). The term
Influence Factor (IF) is defined as ’Any character-
istic of a user, system, service, application, or con-
text whose actual state or setting may have influence
on the Quality of Experience for the user’ (Qualinet,
2013). This elaborates that these IFs have a ten-
dency to affect the MOS. The QoE measurement was
primarily centered on the system IFs; such as per-
ceived video quality in different network conditions
or video encoding protocols/algorithms irrespective
of environment of the experiment; i.e. in emulated en-
vironment or user-centric situations in real life. One
common objective in all these studies is to benchmark
the QoE objective metrics with subjective quality as-
sessments or/and QoS parameters. This is partly due
to the challenges related to the operationalisation of
the wide spectrum of potential influence factors, but it
could also be associated with the shortcomings of cur-
rent practices. It’s important to mention that although
the effectiveness of MOS is questioned by many stud-
ies regarding whether the difference between excel-
lent and good is equivalent to distance between fair
and poor, etc. but the critical observations and in-
terpretations have not been unequivocally in this re-
gard (Streijl et al., 2016; Pinson et al., 2012).
In this paper, we have extended our previous
study (Minhas et al., 2019) to investigate the impact
of user delight towards the shown content (ITU-T
Rec. P.10/G.100, 2017; Qualinet, 2013), frequency of
watching online video content (experience) and dif-
ferent mood levels on MOS for streamed video stim-
uli in different network conditions as shown in Fig-
ure 1.
As the MOS is a group-based perceived quality
indicator of a stimulus, we expect the user ratings
to be independent of these emotional effects (Minhas
et al., 2019). Finally we have obtained MOS ratings
from ITU-T recommended Perceptual Evaluation of
Video Quality (PEVQ) software for multimedia qual-
ity measurements (ITU-T Rec. J.247, 2008). We
have benchmarked PEVQ MOS with real MOS of all
subjects and MOS values of different user groups’ in
terms of delight, experience or mood. The result of
benchmarking is an interesting indicator to validate
and justify the subjective assessments in comparison
to a typical objective assessment.
The paper is structured as follows: In Section 2,
we provide an overview of the related work. Section 3
gives a brief overview of the related technologies. The
detailed experimental setup information with impor-
tant parameters is shown in Section 4. The assessment
results and corresponding interpretations are available
in Section 5. Finally, the conclusions are outlined in
Section 6.
2 RELATED WORK
There are many studies that highlighted the effect of
human psychological states on her behavior and per-
ception of a service. Moreover, many psychological
studies have shown the impact of stimuli on evoking
human emotions and influencing the user behavior.
(Schleicher and Antons, 2014) have summarized
the effect of evoking emotions on the user behav-
ior based on visual, audio and audiovisual stimuli.
The stimuli used in those studies were categorized
as pleasant, unpleasant and neutral based on the con-
tents. They have observed that video clips of a film
have a far-greater impact on evoking emotions as
compared to pictures and brief sounds. Their study
also suggests that the user may be asked to rate their
emotions to obtain a mean opinion score similar to the
perceived quality evaluation.
(Zhu et al., 2015) have observed the influence
of human factors such as age, gender, watching fre-
quency, cultural background, etc. in terms of social
context (co-viewers). The quality ratings were col-
lected in a controlled laboratory setting and via open-
source software and benchmarked. They have ob-
served that social context does play a role in user’s
enjoyment.
(Engelke et al., 2012) measured the rating time in-
volved in assigning a score to stimulus during quali-
tative subjective assessment. The experiment was fo-
cused on obtaining MOS of images subjected to net-
work impairments during transmission on a wireless
network. The scope of the study was quite limited as
only 15 subjects took part in the assessment and rat-
ings times were recorded manually using a stop watch
which may compromise the accuracy. The authors did
notice correlation of rating time with the MOS score
and influence of user confidence.
(Robitza and Hlavacs, 2014) reported the effect of
user confidence on the MOS using a video database.
The user ratings were recorded using a tablet device,
and authors claim to have maintained the viewing dis-
tance but viewing angle and other constraints were not
addressed. A total of 27 subjects took part in the sub-
jective assessment, and the results have shown a ten-
dency of relatively high or low MOS for shorter rat-
DCNET 2020 - 11th International Conference on Data Communication Networking
60

ing times. In our analysis, the core of this study is
based on the assumption that faster rating means that
the user has higher confidence.
In the previous study (Minhas et al., 2019), we
have observed a minor impact of user delight on MOS
by the subjects. Although, this provided motivation
for a detailed future work but due to the limited num-
ber of subjects in sub-categories, the results were not
statistically significant. Moreover, the user mood lev-
els were not taken into consideration.
3 OVERVIEW
In this section, we will provide a basic overview of
the video streaming technologies used to obtain video
stimuli for this paper. We will also highlight different
QoE based metrics and subjective quality assessments
for obtaining MOS.
3.1 Protocols and Codec for Video
Streaming
The nature of live video streaming makes it more re-
silient to packet losses and traditional approach of
RTSP/UDP/IP is the common technique to transmit
video contents. The H.264/AVC codec is responsible
for video presentation, coding, compression, decom-
pression, etc. and is the most widely used video stan-
dard for online video delivery. The H.264/AVC codec
is used for this paper due to its wide implementation,
support and low computational requirements, which
makes it suitable for the low cost devices. Although
the latest H.265/HEVC is on the horizon, we used the
old standard as our focus was primarily on effect of
additional factors on the QoE. Moreover, this selec-
tion helped us to benchmark the results with previous
studies.
3.2 A QoE Perspective
The QoE is focused on user perception of the ser-
vice based on the quality of the shown content. Al-
though, there is no general consensus on what actu-
ally is meant by QoE, there is a massive interest of
service providers to gain insight about user perception
towards their service. The methods used to quantize
QoE are generally classified as objective and subjec-
tive where:
• Objective techniques assess the quality of a con-
tent, e.g. image or video, automatically and in full
reference objective assessment the original refer-
ence image or video is compared with the image
or video exposed to network artifacts and their
subsequent structural effects like as brightness,
contrast, blur, etc. Typical objective metrics are
MSE, PSNR, SSIM and PEVQ (Opticom-GmbH,
2016).
• The subjective assessment is done by taking direct
input from the user about a stimulus quality via
conducting a survey. The MOS is normally ob-
tained on a five-point Likert scale where a score
of 5 means excellent. The important aspect is
to make sure that the human subject’s feedback
is taken under well-defined repeatable conditions.
The amount of time and money associated with
these subjective assessments incline operators and
service providers to go for objective metrics de-
spite their shortcomings in number of scenarios
for video delivery.
Thus, the QoE provides a holistic approach of service
quality perceived from user standpoint, and this idea
is supported by introducing a QoE hour glass model
such as QoE= f (QoS,QoP,QoD) (Minhas and Fiedler,
2013). In this model, QoE is defined as a composite
function of traditional Quality of Service (QoS) met-
rics, Quality of Delivery (QoD) of the content and fi-
nally the Quality of Presentation (QoP).
(Reiter et al., 2014) have discussed that users
might not be aware of the influence factors that affect
their liking or disliking of a content. The physical,
mental or current social state of a user may impact
her behavior and corresponding decisions. Thus hu-
man based influence factors such as user mood, moti-
vation or attention have a tendency to influence the
QoE. They have also discussed the user frequency
of using a system or a service as a temporal aspect
that can influence the user perception. (Robitza and
Hlavacs, 2014) have shown that confidence of a user
plays a significant role in final MOS. Moreover, in our
previous qualitative subjective assessments (Nawaz
et al., 2014; Nawaz et al., 2017), we have noticed
that videos with different spatial and temporal as-
pects may receive different MOS values, although the
videos were streamed under identical network impair-
ments. Moreover, from human IFs, we have observed
the lack of focus and attention from subjects as nor-
mally the assessments were around 35 minutes long.
We have also observed temporal factors that the users
who are not acquainted with watching online content
regularly, didn’t bother too much about quality arti-
facts in general. Based on these findings, we carried
out a research to choose a small set of video stimuli
and record additional information from users regard-
ing their liking of a particular video and frequency of
the watching content as already discussed in the pre-
vious Section 2.
Impact of Human and Content Factors on Quality of Experience of Online Video Streaming
61

Table 1: Video Specification for streaming and subjective
evaluation.
Parameters H.264/AVC
Streaming Software VLC Media Player
Frame Rate 25 fps
Duration 10–11 s
Profile Main
Resolution 352 × 288
In this paper, we have extended our study and
taken the user mood into account along with user de-
light and frequency of watching online content. The
mood states are chosen from the Circumplex Model
of Affect (Russell, 1980). The model shows that all
human emotions arise from two fundamental neu-
rophysiological states, i.e. pleasure and alertness.
We have chosen excited, happy, relaxed and calm
from the Pleasant axis. Although, excited and happy
demonstrate high alert level as compared to the re-
laxed and calm, we have focused only on Pleasant
and Unpleasant categories in this study. Tense, upset,
bored, nervous and fatigues fall into the Unpleasant
category as per the model. To incorporate the tem-
poral aspects, each user was also asked about the fre-
quency of watching online content at the start of the
training session. The reason behind this selection is to
benchmark the content delight for a particular video
taken at the start of the session with corresponding
MOS.
4 EXPERIMENTAL SETUP
The experimental setup used is based on an emu-
lated network, and the reason for an emulated ap-
proach is tightly controlled network setup to repli-
cate the real-world scenario exhibiting the actual im-
pact of packet loss and other network artifacts along
with the ability to repeat results under identical con-
ditions. This hardware is already used in multiple ex-
periments for different studies, and more details about
hardware/software can be found in reference (Nawaz
et al., 2014). The H.264/AVC streaming server was
used to broadcast video streams using the VLC me-
dia player. The traffic shaper is a Linux based system
with Netem emulation software for packet drop, de-
lay, etc.
4.1 Video Selection
In order to stream videos over the experimental
testbed, we have chosen three videos from xiph.org
test media. The technical specifications of these
videos are available in Table 1.
The choice of these videos is in-line with our pre-
vious studies as in order to evaluate the effect of ad-
ditional factors at the user end, we need to compare
the findings. This factor was foremost important to
find any discrepancies in user ratings with additional
factors in mind apart from the quality evaluation. The
Football video involves the highest level of associated
motion, but news is also considered fast in terms of
temporal aspects. The Foreman, on the other hand,
is regarded medium in both spatial and temporal do-
mains, so the selection of video stimuli was in par
with the specifications. It’s important to mention that
we have selected the lowest resolution QVGA that is
available for both the high and low end smart phones.
Due to low Internet speed in third world countries,
this choice will result in decent video quality on low
cost devices.
4.2 Network Impairments
As the focus of our study is on the validity of subjec-
tive quality assessment and corresponding MOS, so
we have chosen seven packet loss scenarios ranging
from 0.1% to 10% for streaming videos on the em-
ulated setup. There was no delay or jitter associated
with these videos during the experiment. The reason
for this arrangement is to remain focused on qualita-
tive measures but this choice resulted in output of a
total of 21 streamed videos for the qualitative assess-
ment.
4.3 Subjective Assessment
As we were analyzing various human factors like
habits (frequency of watching online video clips),
mood, delight (likeness) and their subsequent com-
binations so one set with a single QoS metric was se-
lected. The videos were shown to the users as per the
guidelines given in (ITU-R Rec. BT.500-10, 2012)
regarding viewing distance and display characteris-
tics. A training session was conducted before every
assessment, and users were provided with both verbal
and written instructions. The input was taken from
the user regarding their frequency of watching online
video clips with options to select among often, daily,
sometime and never. The user’s mood was also taken
with the options of excited, happy, relaxed, calm, up-
set, bored, tense, fatigued and nervous. In the next
step, test media without distortions was shown to the
user, and they were asked whether they liked it or not
based on a binary scale of ‘Yes’ and ‘No’. The users
were also requested to provide their ranking of the
content based on their delight towards the shown con-
tent on the 1–9 scale, where 9 indicates the most de-
DCNET 2020 - 11th International Conference on Data Communication Networking
62

lightful content. These ratings were scaled down to
five-point scale with a step size of 0.5 using the for-
mula 5 − (9 − R)/2 where R stands for delight rating
on the nine-point scale. This conversion helped us
in comparing the effect of content delight with cor-
responding MOS. The user ratings for video quality
were obtained using the Single-Stimulus method on a
5-point Absolute Category Rating (ACR) scale. The
selection of test media for this paper meant a total of
24 videos, including the originals resulting in a total
assessment time of around 10–12 minutes.
As a complement, we have used the PEXQ
software (V1.3) to obtain objective metrics like
PSNR and estimated subjective ratings, i.e. PEVQ
MOS (Opticom-GmbH, 2016). In this paper, we have
only used estimated PEVQ MOS ratings to compare
with real MOS ratings obtained from the subjects.
5 RESULTS AND DISCUSSION
The results from the subjective assessment are re-
ported in Table 2. A total of 64 participants rated the
test media out of which three outliers were identified
and subsequently removed. Out of the remaining 61
subjects, 40 males and 21 females participated with a
mean age of 21.05 and mode 21. The MOS with 95%
confidence intervals is calculated using the Student t-
distribution, taking care of varying sample sizes. As
there were multiple groups to test and in some cat-
egories, the number of subjects fell to single digit,
we have calculated confidence intervals at a mini-
mum of 10 subjects. We have also calculated one-way
ANOVA using the SPSS software (IBM Corp., 2019)
to determine the significance of the ratings among
various categories with Tukey in case of significant
values for Frequency and Mood. In general, we have
observed that the majority of videos starts to show
the freeze effect at a packet loss percentage of 1% or
higher.
5.1 Impact of Delight of Shown Video
Content
The average scores of content ratings on a five-point
scale and MOS values for seven different packet loss
ratios are shown in Figure 2.
The subjects that feel delighted on a binary scale
by the content of video clips have rated the content
high on the 9-point ordinal scale, which is an obvi-
ous choice. However, the important observation is the
matched rating of the shown video stimuli with the
overall MOS. We have calculated one-way ANOVA
with α=0.05 and found Foreman videos at 1%, 5%
and 10% packet loss ratio to have a p (significance)
value of less than 0.05. The only other significant dif-
ference was observed in one News clip at packet loss
percentage of 0.1%. So out of 21 video clips, where
network artifacts have to be rated, we have noticed
slight deviation in ratings for only 4 videos. Hence,
we may conclude that in most cases, the users were
able to accurately rate the stimuli regardless of their
delight towards a particular content.
5.2 Impact of Frequency of Watching
Online Video Content
The frequency of watching online content and its ef-
fect on content rating and average MOS are shown in
Figure 3.
In one-way ANOVA analysis at significance level
0.05, we were unable to find a single user input in-
cluding content rating where the output value is less
than 0.05. The only ratings close to be significant are
Football at 0.3% packet loss ratio with significance
p = 0.056 and News at 1% packet loss with the sig-
nificance value of p = 0.090 as shown in Table 3.
We observed a sample size of 37, 18, 6 for Daily,
Often and Sometime, respectively. In order to get
any statistical difference, we combined the Often and
Sometime categories into a new Not-Daily category
with a sample size of 24. Nevertheless, apart from
Football at 0.3% packet loss ratio, we were unable to
find any significant value to show any impact of the
users’ frequency of watching online content on MOS.
Moreover, the ANOVA results from previous user
group having three categories are completely random
as compared to this new group and thus show no sta-
tistical difference in MOS as shown in Table 3.
These results clearly show that the user back-
ground of watching online videos daily, frequently or
sometime hardly affects the user ratings, and these re-
sults are in line with our previous study (Minhas et al.,
2019).
5.3 Impact of User Mood on Video
Ratings and MOS
In case of user mood, we had only one sample of more
than 10 subjects when the user is feeling Calm. So in
order to do any interpretations of the available data,
we aggregated the ratings from nine mood categories
into two groups as already discussed in Section 4:
1. Pleasant which includes Relaxed, Excited, Calm,
Happy;
2. Unpleasant which includes Tense, Upset, Bored,
Nervous, Fatigued.
Impact of Human and Content Factors on Quality of Experience of Online Video Streaming
63
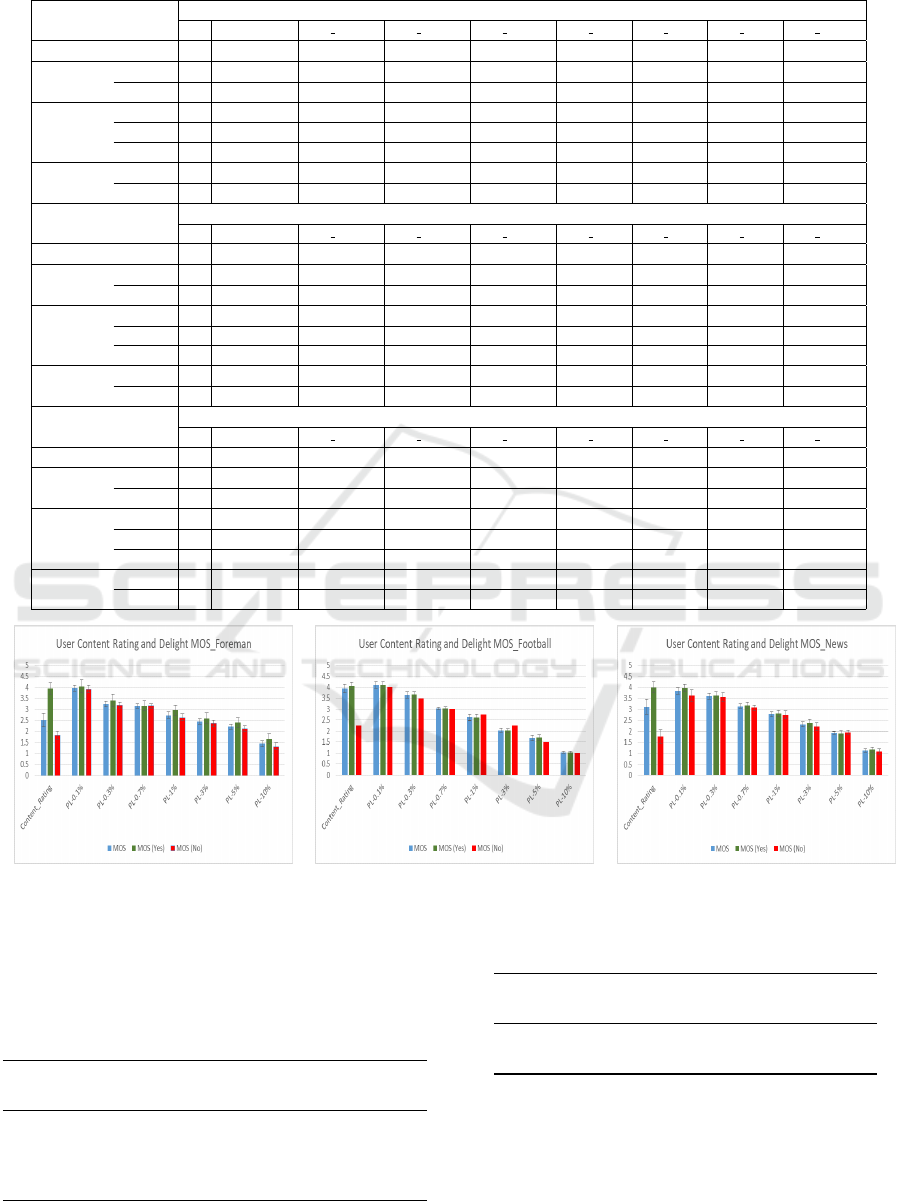
Table 2: MOS with 95% confidence intervals for different videos, categories and packet loss ratios (PL).
Video
Foreman
Users Content Rating MOS PL 0.1% MOS PL 0.3% MOS PL 0.7% MOS PL 1% MOS PL 3% MOS PL 5% MOS PL 10%
All 61 2.52 ± 0.30 3.97 ± 0.15 3.25 ± 0.13 3.15 ± 0.10 2.74 ± 0.13 2.44 ± 0.13 2.21 ± 0.12 1.43 ± 0.13
Video Content Yes 20 3.95 ± 0.25 4.05 ± 0.28 3.40 ± 0.28 3.15 ± 0.23 2.95 ± 0.24 2.60 ± 0.24 2.40 ± 0.24 1.65 ± 0.23
Likeness No 41 1.82 ± 0.19 3.93 ± 0.18 3.17 ± 0.14 3.15 ± 0.11 2.63 ± 0.15 2.37 ± 0.15 2.12 ± 0.13 1.32 ± 0.15
Video Daily 37 2.69 ± 0.41 4.05 ± 0.21 3.29 ± 0.19 3.18 ± 0.13 2.78 ± 0.18 2.51 ± 0.17 2.22 ± 0.16 1.51 ± 0.17
Watching Often 18 2.19 ± 0.51 3.78 ± 0.27 3.22 ± 0.21 3.06 ± 0.21 2.56 ± 0.25 2.28 ± 0.23 2.17 ± 0.19 1.28 ± 0.23
Frequency Sometime 6 2.42 (N/A) 4.00 (N/A) 3.00 (N/A) 3.17 (N/A) 3.00 (N/A) 2.50 (N/A) 2.33 (N/A) 1.33 (N/A)
User Pleasant 40 2.57± 0.37 3.98± 0.21 3.30± 0.18 3.23± 0.14 2.78± 0.17 2.53± 0.16 2.25± 0.16 1.48± 0.16
Mood Unpleasant 21 2.40± 0.54 3.95± 0.18 3.14± 0.16 3.00 ± 0.14 2.67 ± 0.22 2.29 ± 0.21 2.14 ± 0.16 1.33 ± 0.22
Video
Football
Users Content Rating MOS PL 0.1% MOS PL 0.3% MOS PL 0.7% MOS PL 1% MOS PL 3% MOS PL 5% MOS PL 10%
All 61 3.94 ± 0.20 4.10 ± 0.15 3.64 ± 0.14 3.03 ± 0.07 2.62 ± 0.15 2.03 ± 0.09 1.69 ± 0.13 1.03 ± 0.05
Video Content Yes 57 4.06 ± 0.17 4.11 ± 0.15 3.64 ± 0.15 3.03 ± 0.07 2.61 ± 0.16 2.02 ± 0.10 1.70 ± 0.13 1.04 ± 0.05
Likeness No 4 2.25 (N/A) 4.00 (N/A) 3.50 (N/A) 3.00 (N/A) 2.75 (N/A) 2.25 (N/A) 1.50 (N/A) 1.00 (N/A)
Video Daily 37 4.01 ± 0.28 4.00 ± 0.16 3.51 ± 0.19 3.00 ± 0.08 2.62 ± 0.20 2.05 ± 0.13 1.70 ± 0.17 1.03 ± 0.06
Watching Often 18 3.72 ± 0.36 4.28 ± 0.33 3.89 ± 0.23 3.11 ± 0.16 2.67 ± 0.30 2.00 ± 0.17 1.72 ± 0.23 1.06 ± 0.12
Frequency Sometime 6 4.17 (N/A) 4.17 (N/A) 3.67 (N/A) 3.00 (N/A) 2.50 (N/A) 2.00 (N/A) 1.50 (N/A) 1.00 (N/A)
User Pleasant 40 3.98 ± 0.27 4.05 ± 0.19 3.58 ± 0.18 3.03 ± 0.09 2.63 ± 0.19 2.05 ± 0.12 1.63 ± 0.17 1.03 ± 0.05
Mood Unpleasant 21 3.88 ± 0.30 4.19 ± 0.23 3.76 ± 0.24 3.05 ± 0.10 2.62 ± 0.27 2.00 ± 0.14 1.81 ± 0.18 1.00 ± 0.00
Video
News
Users Content Rating MOS PL 0.1% MOS PL 0.3% MOS PL 0.7% MOS PL 1% MOS PL 3% MOS PL 5% MOS PL 10%
All 61 3.12 ± 0.34 3.84 ± 0.15 3.59 ± 0.14 3.15 ± 0.09 2.79 ± 0.12 2.31 ± 0.12 1.93 ± 0.06 1.13 ± 0.09
Video Content Yes 37 4.00 ± 0.25 3.97 ± 0.17 3.62 ± 0.18 3.20 ± 0.13 2.81 ± 0.15 2.38 ± 0.16 1.92 ± 0.09 1.16 ± 0.12
Likeness No 24 1.77 ± 0.30 3.63 ± 0.27 3.54 ± 0.21 3.08 ± 0.12 2.75 ± 0.19 2.21 ± 0.18 1.96 ± 0.09 1.08 ± 0.12
Video Daily 37 3.09 ± 0.47 3.81 ± 0.19 3.54 ± 0.19 3.14 ± 0.12 2.76 ± 0.15 2.27 ± 0.15 1.95 ± 0.08 1.19 ± 0.13
Watching Often 18 2.97 ± 0.58 3.83 ± 0.30 3.67 ± 0.24 3.11 ± 0.16 2.72 ± 0.23 2.33 ± 0.24 1.94 ± 0.12 1.00 (N/A)
Frequency Sometime 6 3.75 (N/A) 4.00 (N/A) 3.67 (N/A) 3.33 (N/A) 3.17 (N/A) 2.50 (N/A) 1.83 (N/A) 1.17 (N/A)
User Pleasant 40 3.11 ± 0.45 3.78 ± 0.20 3.58 ± 0.18 3.15 ± 0.12 2.75 ± 0.16 2.33 ± 0.15 1.98 ± 0.05 1.18 ± 0.12
Mood Unpleasant 21 3.14 ± 0.53 3.95 ± 0.23 3.62 ± 0.23 3.14 ± 0.16 2.86 ± 0.16 2.29 ± 0.21 1.95 ± 0.10 1.05 ± 0.10
(a) Foreman (b) Football (c) News
Figure 2: User Video Ratings and MOS (Delight): (a) Foreman (b) Football (c) News.
This approach gave us a sample size of 40 and 21 sub-
jects, respectively. The effect of the user mood state
on the MOS is shown in Figure 4.
Table 3: Oneway ANOVA of User Frequency.
Video and Loss%
Significance Level: 0.05
Freq. (3 cat.) Freq. (Not-/Daily)
Foreman 10% 0.233 0.090
Football 0.1% 0.228 0.094
Football 0.3% 0.056 0.025
News 1% 0.090 0.522
Table 4: Oneway ANOVA of User Mood.
Video and Loss%
Significance Level: 0.05
Mood (Pleasant, Unpleasant)
Foreman 0.7% 0.036
Foreman 3% 0.076
We can observe a slight impact on almost all stim-
uli but the effect in not pronounced. Moreover, the
results from ANOVA test showed that there is only
one stimulus in the significant range as shown in the
Table 4.
DCNET 2020 - 11th International Conference on Data Communication Networking
64
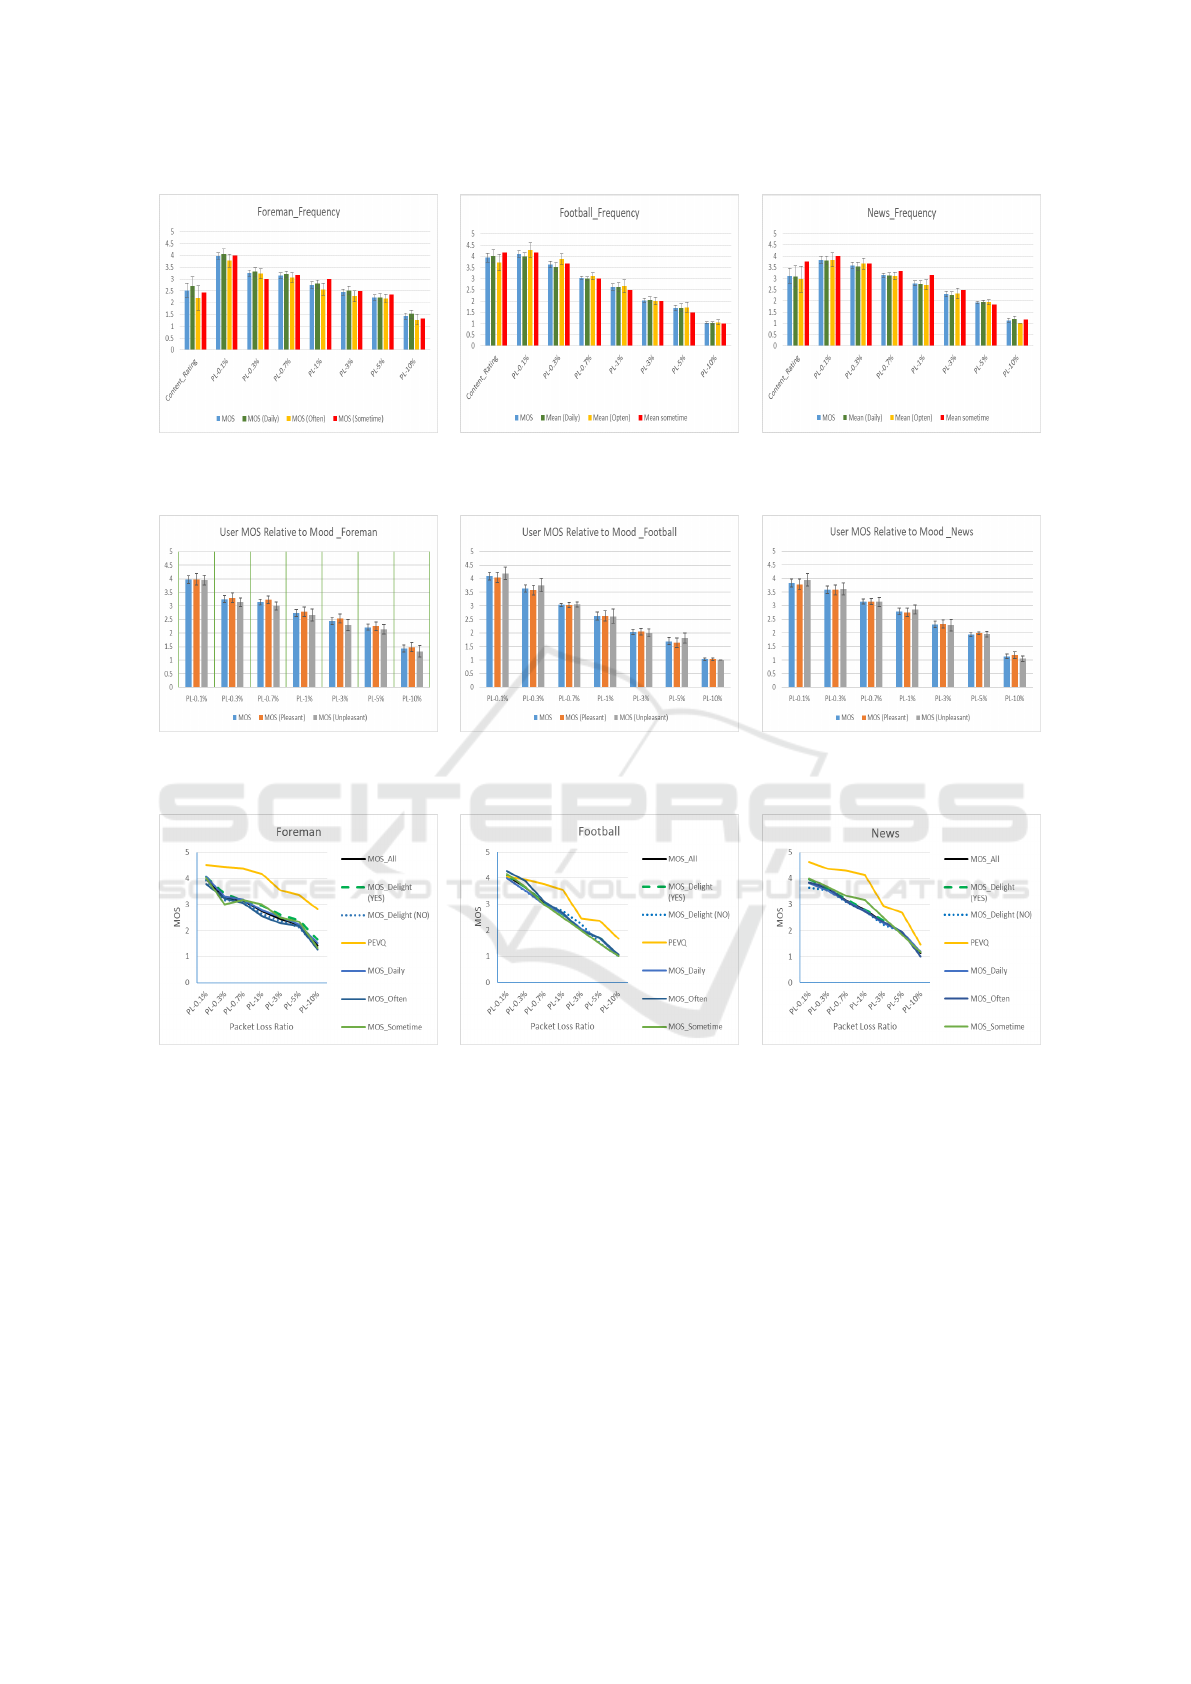
(a) Foreman (b) Football (c) News
Figure 3: User Video Ratings and MOS (Frequency): (a) Foreman (b) Football (c) News.
(a) Foreman (b) Football (c) News
Figure 4: MOS in Relevance to Mood: (a) Foreman (b) Football (c) News.
(a) Foreman (b) Football (c) News
Figure 5: User and PEVQ ratings: (a) Foreman (b) Football (c) News.
The subjects in the group Pleasant have given bet-
ter MOS ratings as compared to Unpleasant with a
mean difference of 0.23 for Foreman stimulus at 0.7%
packet loss ratio. The only other scenario closed to
be significant is Foreman at 3% packet loss ratio.
This tentatively suggests that there is a slight effect of
mood on MOS ratings, but subjects are able to iden-
tify the quality aspects irrespective of their state of
mind.
5.4 PEVQ MOS Benchmarks
Finally, the comparison of MOS values calculated by
the PEXQ software (V1.3) (Opticom-GmbH, 2016)
with actual MOS values of human subjects is shown
in the Figure 5. The subjects’ ratings were uniform
despite their differences in terms of delight, mood
or frequency, and the difference from PEVQ based
ratings is apparent. In our cases, PEVQ tends to
overestimate the video quality as compared to real
human subjects, which is in line with a previous
study (Nawaz et al., 2014). The offset between PEVQ
and actual ratings is consistent, although not constant,
for almost all the videos. This potential behaviour
should be kept in mind when using PEVQ for qual-
ity evaluation.
Impact of Human and Content Factors on Quality of Experience of Online Video Streaming
65

6 CONCLUSION
In this paper, we have considered additional fac-
tors like content delight, frequency of watching on-
line video content and user mood and their impact
on MOS for multimedia communication. The video
stimuli were streamed in different packet loss scenar-
ios, and we have used both binary and ordinal scale
to take account of the user delight. We have seen a
slight impact of both frequency of using online video
content or mood on MOS, but the results are not sta-
tistically significant. On the other hand, we have ob-
served a slight tendency to give higher MOS ratings to
stimuli where the user is delighted to watch content,
but the different is not too large. It is important to
mention that all subjects were technologically aware
of the field, and we might get more relevance from
the diverse set of users in an additional study. The
results establish the effectiveness of MOS ratings ob-
tained through subjective assessments for video clips.
Finally, we have benchmarked the subjective MOS
ratings with PEVQ MOS and observed the software
tendency to overestimate the quality of the streamed
videos. This paper motivates to test effectiveness of
the results by using latest codecs with high resolution
videos streamed over high-speed networks in future
work.
REFERENCES
Cisco (2018). Cisco Annual Internet Report - Cisco Annual
Internet Report (2018–2023) White Paper. Technical
report. Library Catalog: www.cisco.com.
Engelke, U., Maeder, A., and Zepernick, H. J. (2012). Hu-
man observer confidence in image quality assessment.
Signal Processing: Image Communication, 27:935–
947.
IBM Corp. (2019). IBM SPSS Statistics for Windows ver-
sion 22.
ITU-R Rec. BT.500-10 (2012). Methodology for the sub-
jective assessment of the quality of television pictures.
ITU-T Rec. J.247 (2008). Objective perceptual multimedia
video quality measurement in the presence of a full
reference.
ITU-T Rec. P.10/G.100 (2017). Vocabulary for perfor-
mance, quality of service and quality of experience.
Recommendation (11/2017), ITU-T.
ITU-T Rec. P.910 (2008). Subjective video quality assess-
ment methods for multimedia applications.
Johnston, K. (2018). Netflix and Video Streaming Widen
Lead over Subscription TV in Customer Satisfaction
American Customer Satisfaction Index.
Minhas, T. N. and Fiedler, M. (2013). Quality of experi-
ence hourglass model. In Computing, Management
and Telecommunications (ComManTel), 2013 Inter-
national Conference on, page 87–92. IEEE.
Minhas, T. N., Nawaz, O., Fiedler, M., and Khatibi, S.
(2019). The Effects of Additional Factors on Subjec-
tive Quality Assessments. In 2019 2nd International
Conference on Advancements in Computational Sci-
ences (ICACS), pages 1–5.
Nawaz, O., Minhas, T., and Fiedler, M. (2014). Optimal
MTU for realtime video broadcast with packet loss;
A QoE perspective. In The 9th International Con-
ference for Internet Technology and Secured Transac-
tions (ICITST-2014), London, pages 396–401.
Nawaz, O., Minhas, T. N., and Fiedler, M. (2017). QoE
based comparison of H.264/AVC and WebM/VP8 in
an error-prone wireless network. In Integrated Net-
work and Service Management (IM), 2017 IFIP/IEEE
Symposium, Lisbon, pages 1005–1010.
Ofcom (2019). Comparing service quality: Choosing the
best broadband, mobile and landline provider.
Opticom-GmbH (2016). PEVQ, advanced perceptual eval-
uation of video quality, White Paper. Technical report.
Library Catalog: www.opticom.de.
Pinson, M. H., Janowski, L., Pepion, R., Huynh-Thu, Q.,
Schmidmer, C., Corriveau, P., Younkin, A., Callet,
P. L., Barkowsky, M., and Ingram, W. (2012). The In-
fluence of Subjects and Environment on Audiovisual
Subjective Tests: An International Study. IEEE Jour-
nal of Selected Topics in Signal Processing, 6(6):640–
651.
Qualinet (2013). Qualinet White Paper on Definitions of
Quality of Experience. Technical report. Library Cat-
alog: www.qualinet.eu.
Reiter, U., Brunnstr
¨
om, K., De Moor, K., Larabi, M.-C.,
Pereira, M., Pinheiro, A., You, J., and Zgank, A.
(2014). Factors Influencing Quality of Experience. In
M
¨
oller, S. and Raake, A., editors, Quality of Experi-
ence: Advanced Concepts, Applications and Methods,
T-Labs Series in Telecommunication Services, pages
55–72. Springer International Publishing, Cham.
Robitza, W. and Hlavacs, H. (2014). Assessing the validity
of subjective qoe data through rating times and self-
reported confidence. In Quality of Multimedia Expe-
rience (QoMEX), 2014 Sixth International Workshop,
pages 297–302.
Russell, J. A. (1980). A Circumplex Model of Af-
fect. Journal of Personality and Social Psychology,
39(6):1161–1178.
Schleicher, R. and Antons, J.-N. (2014). Evoking Emo-
tions and Evaluating Emotional Impact. In M
¨
oller,
S. and Raake, A., editors, Quality of Experience: Ad-
vanced Concepts, Applications and Methods, T-Labs
Series in Telecommunication Services, pages 121–
132. Springer International Publishing, Cham.
Streijl, R. C., Winkler, S., and Hands, D. S. (2016). Mean
Opinion Score (MOS) Revisited: Methods and Ap-
plications, Limitations and Alternatives. Multimedia
Syst., 22(2):213–227.
Zhu, Y., Heynderickx, I., and Redi, J. A. (2015). Under-
standing the role of social context and user factors in
video Quality of Experience. Computers in Human
Behavior, 49:412–426.
DCNET 2020 - 11th International Conference on Data Communication Networking
66
