
Catalog Integration of Low-quality Product Data
by Attribute Label Ranking
Oliver Schmidts
1
, Bodo Kraft
1
, Marvin Winkens
1
and Albert Z
¨
undorf
2
1
FH Aachen, University of Applied Sciences, Germany
2
University of Kassel, Germany
Keywords:
Catalog Integration, Data Integration, Data Quality, Label Prediction, Machine Learning, Neural Network
Applications, Public Data.
Abstract:
The integration of product data from heterogeneous sources and manufacturers into a single catalog is often
still a laborious, manual task. Especially small- and medium-sized enterprises face the challenge of timely
integrating the data their business relies on to have an up-to-date product catalog, due to format specifications,
low quality of data and the requirement of expert knowledge. Additionally, modern approaches to simplify
catalog integration demand experience in machine learning, word vectorization, or semantic similarity that
such enterprises do not have. Furthermore, most approaches struggle with low-quality data. We propose
Attribute Label Ranking (ALR), an easy to understand and simple to adapt learning approach. ALR leverages
a model trained on real-world integration data to identify the best possible schema mapping of previously
unknown, proprietary, tabular format into a standardized catalog schema. Our approach predicts multiple
labels for every attribute of an input column. The whole column is taken into consideration to rank among
these labels. We evaluate ALR regarding the correctness of predictions and compare the results on real-world
data to state-of-the-art approaches. Additionally, we report findings during experiments and limitations of our
approach.
1 INTRODUCTION
The success of an e-commerce company depends on
displaying and selling products on its platform. To do
so, all customers who want to offer products on this
platform have to provide the corresponding product
data. Small to medium sized enterprises (SMEs) are
not able to force every customer to comply with their
standards. Hence, they have to deal with various data
formats from different sources and extract relevant in-
formation to display on their platform.
A typical workflow to integrate heterogeneous
data from multiple sources includes steps like for-
mat unification, schema matching, and information
extraction. Due to the complexity of these tasks, data
integration requires manual corrections, since tools
often fail to automate extract-transform-load (ETL)
data pipelines on non-standard or low-quality data.
Enabling an automated data integration pipeline
allows employees to process complex datasets with
reduced effort and domain knowledge. Schema
matching is a critical operation in this process, espe-
cially for data warehouses or e-commerce. In order
to integrate one product catalog into the other, corre-
sponding entries in both catalogs need to be identified,
or attributes need to be matched to their representa-
tives.
However, relations between attributes of an in-
put catalog and the target schema are unknown if the
names of attributes change frequently. Even if the in-
put schema is known from a previous catalog, another
manufacturer could use the same naming differently.
Since tabular data with product attributes are the most
common way to handle these data in SMEs, we can
only rely on attribute names and attribute representa-
tives to identify possible matches.
In this paper, we present an approach to integrate
tabular catalog data with previously unknown column
names and column count from different manufactur-
ers into a single catalog based on labeling each repre-
sentative of an attribute. After labeling each attribute
representative, we aggregate the label predictions to
rank among all label candidates of a column and use
this ranking as a recommendation to simplify the pro-
cess of catalog integration for SMEs.
We conducted this research in a collaboration
90
Schmidts, O., Kraft, B., Winkens, M. and Zündorf, A.
Catalog Integration of Low-quality Product Data by Attribute Label Ranking.
DOI: 10.5220/0009831000900101
In Proceedings of the 9th International Conference on Data Science, Technology and Applications (DATA 2020), pages 90-101
ISBN: 978-989-758-440-4
Copyright
c
2020 by SCITEPRESS – Science and Technology Publications, Lda. All rights reserved

Product Name
Quantity
Host
Reactivity
Hu IRF-3 Pure SL-12.1 100ug
0.1mg
Mouse Hu
Sample Input
Clone
Quantity
Hosts
Reactivity
SL-12.1
0.1mg
Mouse Human
Sample Output
ETL Data Pipeline
Figure 1: A typical integration workflow for e-commerce data: An industry partner delivers a tabular semi-structured input
file, which might look like the sample input. Then, an ETL pipeline handles these data. Every node in the data pipeline
represents a task that might include manual actions or is entirely automated. After meeting quality objectives, output data
have a unified schema and semantic concepts as well as standardized attribute contents.
project with an e-commerce SME from the bioscience
domain. Therefore, we evaluate our approach with
real-world product catalogs from this domain.
The main contributions of this paper are:
1. We introduce a dataset specifically designed to
target the challenge of catalog integration and col-
umn labeling. This dataset includes real-world
data collected during manual integration tasks.
1
2. We propose Attribute Label Ranking (ALR), an
approach for catalog integration based on at-
tribute labeling by learning from attribute repre-
sentatives through combining features from meta-
information and content language analysis.
3. We compare the performance of using one-hot
vectors of words or n-grams as language features
on catalog integration.
The remainder of this paper is structured as fol-
lows: Section 2 emphasizes the importance of han-
dling low-quality data in automatic integration ap-
proaches for SMEs in e-commerce. Subsequently,
Section 3 provides an overview of related approaches
and previous work. In Section 4, we review the data
we work on before we present our approach to in-
tegrating low-quality data in Section 5. Based on
the dataset for catalog integration of antibody product
data in Section 6, we evaluate our work in Section 7
before we conclude the paper with a summary and a
brief outlook in Section 8.
2 MOTIVATING EXAMPLE
This section provides a motivating example, demon-
strating the economic importance of automatic inte-
gration of low-quality data, especially for SMEs in
e-commerce. We present a simplified data integra-
tion workflow of an SME, providing antibodies to re-
searchers.
Figure 1 illustrates a typical workflow for such
an e-commerce company after format unification.
1
https://github.com/oschmi/antibody-catalog-
integration-dataset
Prior to this workflow, antibody manufacturers deliver
product data in any format. After format unification,
additional data processing tasks are required to inte-
grate the product catalog. Often, an ETL pipeline
handles these tasks with or without manual interac-
tion. Typical tasks that require manual actions are:
• Schema Matching. An employee has to match
the schema from an input file to the target schema,
on which other processes rely. Automating this
task is easy if the two schemas are identical.
However, SMEs cannot force their customers to
comply with their schema, format, or seman-
tic concept naming due to the lack of market
power. Problem classes for identifying semantic
concepts, such as using synonyms, misspelling,
plural, splitting characters, identified by Paulus
et al. (Paulus et al., 2018), apply here as well (c.f.
Figure 1, Host expands to Hosts). Although trans-
formations once implemented for a single manu-
facturer are in theory reusable, the reality shows
that the input schema changes regularly.
• Identifying Additional Information. Some
manufacturers add information to a semantic con-
cept that misses elsewhere. An employee needs
to identify those entities, to extract them (e.g., via
unique regular expressions), and finally matches
them to the correct concept. This task requires
very much time and is error-prone due to the use
of regular expressions for information extraction.
For example, in Figure 1, the clone is extracted
from the product name, since the input schema
misses a clone property.
• Resolving Duplicated Information. The same
information might occur in multiple attributes. An
employee needs to decide which information to
use. The input file in Figure 1 contains the prod-
uct quantity in multiple attributes. The quantity
is identical in both attributes, but the unit of mea-
surement differs (including a misspelling).
• Resolving Synonyms and Abbreviations. Dif-
ferent antibody manufacturers might use their
synonyms and abbreviations in input files. These
Catalog Integration of Low-quality Product Data by Attribute Label Ranking
91

need to be standardized and resolved to use a con-
sistent vocabulary in the webshop (c.f. Figure 1,
Hu expands to Human).
Failing a single task may create product data in
the shop that are incorrect. Hence, a review by a
highly educated domain specialist is required to guar-
antee the product data quality. In the worst case, an
employee has to run the integration pipeline multiple
times until fulfilling quality goals. Avoiding to inte-
grate a single file of product data multiple times saves
time and money for a SME, depending on the amount
of manual work required.
Considering that antibody manufacturers change
their schema frequently, reducing the effort to inte-
grate product data becomes economically relevant. In
addition to regular schema changes, some manufac-
turers try to hide that they are reselling other manu-
facturers’ products and obfuscate product data.
Hence, it is desirable to improve automatic data
integration for e-commerce data by predicting mul-
tiple labels for given attributes and thus simplifying
schema matching and identifying additional informa-
tion to assist employees on manual tasks.
3 RELATED WORK
The task of data integration closely relates to schema
matching, data labeling, and finding similar seman-
tic concepts in multiple datatsets. In this section, we
present recent work from corresponding fields.
While schema matching has a long history of
approaches, it typically relies on the similarity be-
tween attribute names (Comito et al., 2006; Schmidts
et al., 2019) or similarity of their values (Kirsten
et al., 2007; Bernstein et al., 2011; de Carvalho et al.,
2013). Advanced approaches that resulted in major
matching frameworks like CUPID (Madhavan et al.,
2001), COMA++ (Aumueller et al., 2005), or OR-
CHID (Dessloch et al., 2008) use a combination of
both and add further steps like synonym and abbrevia-
tion resolution to match between two schemas. How-
ever, these approaches focus on a general-purpose so-
lution to unify schemas and often use structural in-
formation derived from hierarchies (Shvaiko and Eu-
zenat, 2005).
Integrating and matching product data into a sin-
gle catalog relies on tabular data in which product at-
tributes are most commonly stored. Approaches mo-
tivated by the semantic web, focus on entity match-
ing to find related products in two tabular datatsets.
Foley et al. shows that learning from low-quality
data can improve search results (Foley et al., 2015).
Ristoski et al. and Bizer et al. demonstrate how a
deep learning model can predict matching products
(Ristoski et al., 2018; Bizer et al., 2019). Neverthe-
less, these approaches rely on a unified schema for
all input data. Gu et al. combine schema matching
and record matching through likelihood estimation.
This approach works well on datatsets that overlap for
some records and attributes, and it works only well if
one entity in a table matches with no more than one
entity in the other table (Gu et al., 2017).
Recent research focuses on predicting labels or
semantic concepts by content analysis (Chen et al.,
2018) or combining attribute names and representa-
tives (Pham et al., 2016; Pomp et al., 2019). Chen
et al. leverage a deep learning model to predict la-
bels to columns based on multiple features, such as
cell length, character ratio, and character unigramms.
They consider the labeling problem as a multi-class
classification where every label represents a single
class. For a data integration task, we need to ex-
tend this approach to a multi-label problem where
every column can have multiple labels. Otherwise,
the model can solely recognize 1:1 relations, which is
not desirable for a product catalog integration. Addi-
tionally, their approach works best on Bag of Words
(BoW) columns. However, columns concerning prod-
uct specifications frequently contain text.
Pham et al. and Pomp et al. determine similar
concepts based on different similarity measures, for
instance, value distribution through a column. Uti-
lizing the value distribution is not possible in cata-
log integration. For instance, one manufacturer pro-
duces antibodies with mice as host, and another man-
ufacturer uses mice and rabbits as host. As a conse-
quence the distribution of class representatives differ.
Knowledge graphs can further improve matching re-
sults after enriching with enough concept representa-
tives (Anam et al., 2016; Pomp et al., 2019). They find
similar concepts (labels) in a knowledge base based
on different classifiers (e.g., rule and histogram) and
metrics. These approaches perform well on BoW and
numerical columns, but lack accuracy on textual rep-
resentatives.
4 REVIEW OF PRODUCT
CATALOG DATA
Before we started to design a learning model, we re-
viewed original data from integration processes in the
antibody product domain to identify challenges and
to measure the usual quality of data from manufac-
turers. We limited this review to CSV files since it is
the most common format to integrate on our partners’
platform. However, our review also applies to any file
DATA 2020 - 9th International Conference on Data Science, Technology and Applications
92

format that allows hierarchical attributes and thus can
express relations between attributes. We reviewed a
total number of 50 files before and after integration
from different manufacturers containing a range from
three up to 230.000 products of multiple types. Due
to the specialized domain, the product standards of
schema.org are not applicable in this context.
2
To
integrate data effectively, we analyzed the content of
the columns and categorized them into the following
classes:
• Bag of Words (BoW). A column that contains a
limited amount of words (e.g., a host is always
one of 22 animals). We can find the attribute to
integrate by analyzing the content if the BoW is
unique in both schemas. However, BoWs are not
unique for antibodies. For example, an animal
can be a host or describes the reactivity of the
antibody. In this case, the attribute name always
defines the context of this class. A BoW mostly
refers to a 1:1 relation between two schemas.
• Unstructured Text (UT). This class contains ei-
ther a list of words or full sentences up to para-
graphs of multiple sentences. Typical examples
for this class are product names or descriptions,
where the product name contains a list of words,
and the description contains multiple paragraphs.
Nevertheless, this class is not limited to these two
attributes. The UT class can refer either to a 1:1
relation (e.g., description) or a 1:n if the content
holds more than one concept of a finer-grained tar-
get schema despite not mentioning this concept in
the column or attribute name.
• URLs. Some attributes include URLs to different
targets like pictures, detailed product specification
sheets, or the UniProt database.
3
BoW and UT classes suffer from similar problem
classes as the naming of attributes such as misspelling
and encoding errors. Depending on the manufacturer,
different synonyms and abbreviations are used, which
require a transformation to a standard naming in a
subsequent process.
Pomp et al. identified further data classes, such as
ID and numerical values (Pomp et al., 2019). How-
ever, these classes are not as relevant in catalog inte-
gration as in a more general context. For example,
if an attribute contains prices, a manufacturer may
use the plain number in the corresponding column or
use the number with an additional currency symbol.
Hence, we handle these cases as plain text, to avoid
mistakes based on class confusion because of addi-
tional (or missing) symbols or characters.
2
https://schema.org/Product
3
https://www.uniprot.org/
5 ATTRIBUTE LABEL RANKING
In this section, we present Attribute Label Ranking
(ALR) to integrate products from different manufac-
turers into a unified catalog through mutli-label clas-
sification ranking.
5.1 Problem Statement
We follow the problem definition of Chen et al. on
finding schema labels based on content analysis of
tabular data and extend it to catalog integration. We
consider an input file of the format (Chen et al., 2018)
as product catalog:
P
in
=
L
in
1
L
in
2
··· L
in
n
c
in
1,1
c
in
1,2
··· c
in
1,n
.
.
.
.
.
.
.
.
.
.
.
.
c
in
m,1
c
in
m,2
··· c
in
m,n
Based on this product catalog, we introduce the
following naming conventions:
• input schema labels (or attribute names): L
in
i
,
where i (i ∈ [1, n]) is the input label index.
• output schema labels: L
out
k
, where k (k ∈ [1, q])
is the input label index.
• input catalog content (or attribute representa-
tives): c
in
= [c
in
1,1
, . . . , c
in
m,n
] where c
in
j,i
is a single
representative.
• column: C
in
i
= [L
in
i
, c
in
1,i
, . . . , c
in
m,i
].
• product (or row): P
in
j
= [c
in
j,1
, . . . , c
in
j,n
].
With these conventions, we define catalog integra-
tion as a task, where we try to integrate multiple cata-
logs into the fixed schema L
out
of a target catalog. An
optimal result would match each column to the cor-
rect target schema label. This approach corresponds
to the approach of Chen et al. for columns matching
exactly one label (1:1 relation) (Chen et al., 2018).
However, an input column may refer to multiple tar-
get labels. We leverage a multi-label classification
model to also obtaining 1:n relations while preserv-
ing the performance on 1:1 relations. By considering
multiple input columns from C
in
that target the same
L
out
k
, we further address n:1 relations.
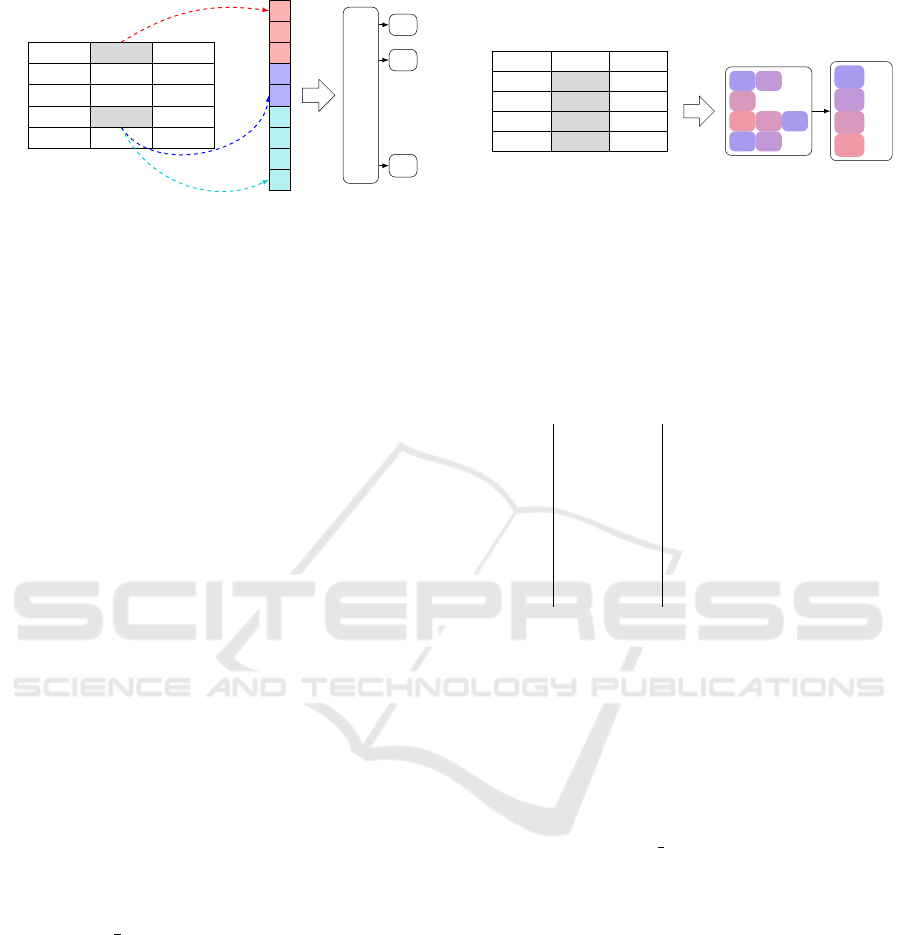
5.2 Approach Overview
ALR relies on two consecutive steps, as pictured in
Figure 2, while making no assumptions about the
schema and content of an input catalog except both
are part of the same context (e.g., antibody products).
Catalog Integration of Low-quality Product Data by Attribute Label Ranking
93
Quantity
Host
Reactivity
0.1mg
Mouse Hu
0.1mg
Bovine
Hu
0.1mg
Rabbit
Hu
0.1mg
Mouse
Hu, Mo
l
a
b
e
l
s
i
m
i
l
a
r
i
t
i
e
s
l
a
n
g
u
a
g
e
f
e
a
t
u
r
e
s
c
h
a
r
a
c
t
e
r
f
e
a
t
u
r
e
s
neural network
L
out
1
L
out
2
.
.
.
L
out
q
(a) The feature vector contains character and language fea-
tures based on an attribute representative as well as label
similarities between the corresponding input header and
target label. Hereafter, a neural network predicts multiple
possible labels for a single attribute representative.
Quantity
Host
Reactivity
0.1mg
Mouse Hu
0.1mg
Bovine
Hu
0.1mg
Rabbit
Hu
0.1mg
Mouse
Hu, Mo
L
out
1
(3)
L
out
4
(2)
L
out
2
(2)
L
out
3
(1)
ranking
L
out
1
L
out
4
L
out
2
L
out
3
L
out
2
L
out
1
L
out
1
L
out
4
predictions
(b) The network predicts labels for each representative of
a column. After that, the count of occurrences determines
the label ranking for that column. The more often a label
occurs, the higher is the ranking. For example, L
out
1
receives
the highest ranking with three occurrences.
Figure 2: Overview of our approach consisting of two parts. Figure 2a illustrates how we generate feature vectors from
attribute representatives. In Figure 2b the results of the neural network define the final label ranking for the complete column.
The first step considers different features for each
attribute representative with its corresponding input
label to determine possible target labels. Figure 2a il-
lustrates the process of feature selection at different
levels for the attribute representative Rabbit. From
this attribute representative, we extract character- and
language-based features. Besides, we utilize avail-
able meta-information, such as the similarity between
the corresponding input label (e.g., Host in Figure 2a)
and all target labels. The next section provides more
details on feature selection. After determining these
features, we aggregate and feed them into a neural
network, which predicts multiple labels for each at-
tribute.
After predicting target labels for all attribute rep-
resentatives of a column, we count occurrences per
target label. Based on the occurrence count, we
build a ranking among all predicted target labels. In
Figure 2b target labels for the column Host were pre-
dicted. The target label L
out
1
counts three occurrences
and therefore receives the highest rank before L
out
4
and
L
out
2
with two occurrences. The relative ranking score
is the final result of ALR. In Figure 2b L
out
1
receives a
final score of
3
8
= 0.375.
5.3 Feature Selection
Modern research approaches perform well in predict-
ing labels on numerical-, BoW-, and ID-based at-
tributes (Chen et al., 2018; Pomp et al., 2019). How-
ever, a product catalog contains multiple textual at-
tributes, such as a description or usage information.
Additionally, a textual attribute might contain infor-
mation that misses in an explicit product specification
by manufacturers but is available in a more general
schema. Consequently, we use the following features
based on label similarity, language, attribute content
Table 1: List of features for multi-label classification.
ID Length Description
1 len(L
out
) target label similarity
2 1 ltd., norm., cell length
3 1 % of alphabetic chars
4 1 % of numeric chars
5 1 % of symbolic chars
6 len(vocab) one-hot tokens
7 1 a token is a URL
(c.f. Table 1 and Figure 2a) to predict multiple labels
for an attribute representative:
• Label Similarity Features: We utilize the la-
bel similarity between L
in
i
and each L
out
k
as meta-
information of a representative. The similarity
vector is calculated by applying the cos-similarity
of character bi- and trigrams to a single input label
and each target label:
cos sim(L
in
i
, L
out
k
)
As a result, the feature length is q = len(L
out
).
• Character Features: We use the count of char-
acters, limited to a maximum of 1024 characters
per attribute, and normalize the value to [0,1].
Besides, we use the percentages of numeric, al-
phabetic, and symbolic characters of an attribute.
These features are particularly useful to predict
the labels of IDs (Chen et al., 2018) and antibodies
or gene sequences in the context of our products.
• Language Features: To improve results on la-
beling text attributes, we use different text vec-
torizing techniques. These may include one-hot
word vectors, character n-grams of word tokens
(sub-word n-grams), or any other word vector-
ization technique, such as word embeddings. In
this paper, we only consider one-hot word vectors
DATA 2020 - 9th International Conference on Data Science, Technology and Applications
94
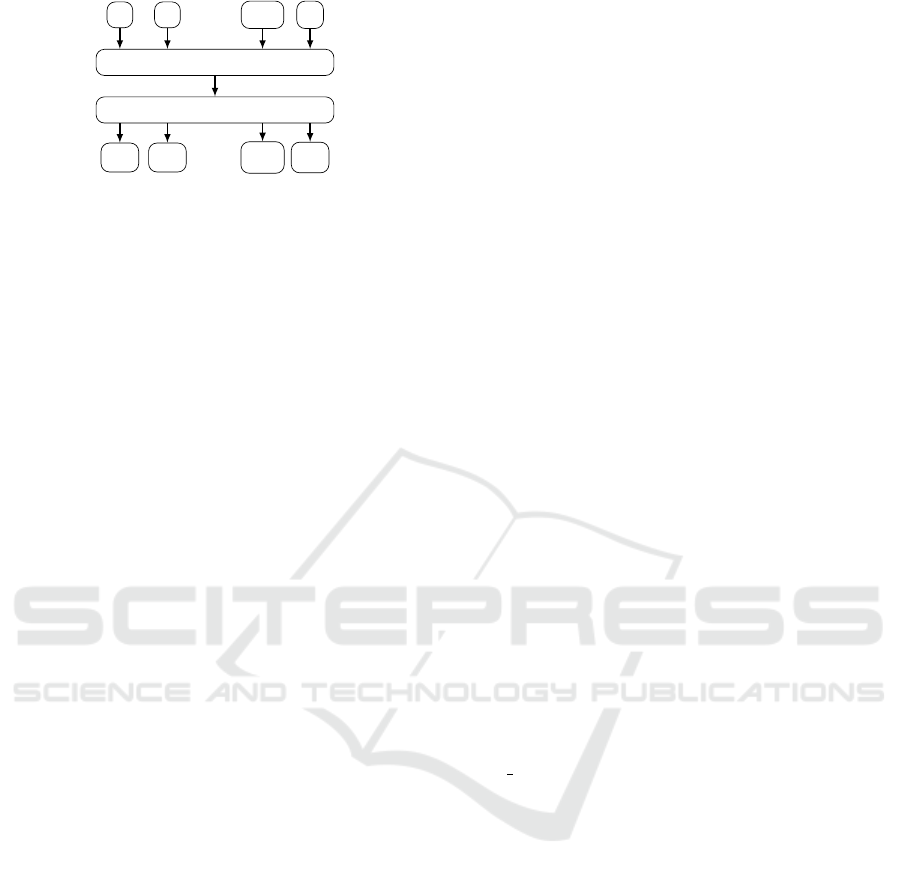
f
1
f
2
·· ·
f
p−1
f
p
Hidden Layer
Output Layer
L
out
1
L
out
2
·· ·
L
out
q−1
L
out
q
ReLU
Figure 3: Neural network architecture for attribute labeling.
and sub-word n-grams since we would need spe-
cialized embeddings for antibody product data.
Building these embeddings is not feasible for
SMEs because of hardware and knowledge lim-
itations. The used vocabulary determines the
feature-length for one-hot vectors. Additionally,
we added a binary URL recognizer, which is ei-
ther set to 1 if a URL is present or 0 if not.
5.4 Multilayer Network
Figure 3 shows a similar network architecture, as
Joulin et al. used in their approach to efficient text
classification. They advise using flat neural networks
to gain fast and accurate results on text classification
tasks (Joulin et al., 2016). Therefore, we use a multi-
layer approach with a single hidden layer that is close
to their network architecture. The feature size defines
the size of the input layer. We use a layer of 400 nodes
as a hidden layer, which is fully connected by rectified
linear units (ReLUs) to the output layer. The size of
the output layer depends on the number of labels to
predict for an attribute.
Our model optimizes the Binary Cross Entropy
(BCE) with logits loss through ADAGRAD (better
performance on multi-label classification (Nam et al.,
2014)) to handle the multi-label classification. With
this loss function, we can use binary labels as a target
or any value in [0, 1]. In the prediction step, we con-
sider every target value greater than 0 as a positive
label prediction.
6 CREATING A CATALOG
INTEGRATION DATATSET
With ALR, we provide an approach to tackle cat-
alog integration. However, commonly used tabular
datasets do not include information about how the
data were integrated. In this section, we introduce an
annotated dataset for product catalog integration. We
gathered this dataset by analyzing logs from manual
labeling actions in our partners’ ETL pipeline.
6.1 Data Collection and Annotation
We collected files at two stages of our partners’ inte-
gration pipeline. Firstly, we gathered product catalog
data after the format unification in the CSV format,
where each file contains original attribute names and
contents of a manufacturer. Secondly, we gathered
the corresponding data after the last human interac-
tion before transferring the product information into
a database. These files have a unified tabular target
schema.
Between these stages, data of some input columns
were adopted entirely into the target file. These at-
tributes identify by matching strings before and af-
ter integration. We consider an exact match as a 1:1
relation between the two files. However, other at-
tribute representatives from the input file have been
transformed during the integration process: Informa-
tion was extracted from strings into one or multiple
target columns, units of measurement were standard-
ized, synonyms and abbreviations might have been re-
solved. Nevertheless, we only know for sure the re-
lation among exact string matches, since we have no
information about the matching process (input label
to target label).
To identify unknown relations as well, we used a
tokenizer for biomedical data (Neumann et al., 2019).
We determined the cosine similarity (ignoring stop-
words) of tokens between an attribute representative
from the manufacturers’ file and all representatives of
the corresponding product in the integrated file.
After that, we annotated c
in
j,i
with the tuple
of the associated L
out
k
and the similarity score
(cos sim(c
in
j,i
, c
out
j,k
)). With this method, an exact string
match receives a similarity score of 1.0. We consider
a target label annotated with a similarity score of 1.0
as the primary label of that attribute representative. If
a representative has no primary label after the annota-
tion, we can only assume that the representative was
integrated into the target label with the highest score.
This approach allows using the same dataset for
different problem definitions. For example, solely
considering 1:1 relations, where the similarity equals
1.0, leads to a multi-class classification problem,
since the content can only match to a single concept.
Utilizing lower similarities leverages a multi-label ap-
proach, where the content may correspond to multiple
concepts.
6.2 Properties and Format
We assembled 19 files from integration jobs for the
dataset, containing a total of ca. 420.000 antibody
Catalog Integration of Low-quality Product Data by Attribute Label Ranking
95

Table 2: Properties of the catalog integration dataset.
Total Files 19
Total Products ca. 420.000
Products per File 3 – ca. 230.000
Manufacturers 12
Input Attribute Range 14 – 65
{
'content': ...
'labels': [
'label_1': 0.1,
'label_2': 1.0,
...
'label_q': 0.5
]
'header_similarity': {
'original_header': L
in
1
,
'headers': [
'label_1': cos sim(L
out
1
, L
in
1
),
'label_2': cos sim(L
out
2
, L
in
1
),
...
'label_q': cos sim(L
out
q
, L
in
1
)
]
}
Listing 1: Format of the catalog integration dataset.
products (c.f. Table 2).
4
The number of products con-
tained in a single file ranges from 3 up to ca. 230.000
products of 12 manufacturers and different product
types (e.g., ELISA Kits, Primary Antibodies, etc.).
Depending on the product type and manufacturer, the
number of attribute names per catalog ranges from 14
to 65 names that were integrated into a target schema
with 94 labels.
Listing 1 shows the structure of the annotated
dataset in a JSON-format based on attribute represen-
tatives. The property content refers to a single at-
tribute representative of a product catalog. The un-
sorted list of labels contains all possible target labels
with the annotations. Additionally, we include the bi-
and trigram cos-similarity mentioned in Section 5.3.
However, the only mandatory attributes in this dataset
are content and labels. Other properties are added
and pre-calculated for convenience. To keep track of
manufacturers, we pseudonymized their name and re-
placed it with a sha256-hash in the file name. Addi-
tionally, we split all files into smaller chunks.
6.3 Limitations
The integrated data contain quality issues despite the
manual actions and review. For example, there are en-
coding errors, spelling errors, and fragments of reg-
4
https://github.com/oschmi/antibody-catalog-
integration-dataset
ular expressions. These errors made the annotation
process more prone to errors for uncertain matches
without a primary label. Furthermore, the integrated
dataset only contains resolved synonyms and abbre-
viations, which might lead to a missing primary label
in a small number of cases.
Furthermore, we removed URL-attributes from
the published datatset to prevent manufacturers from
being exposed.
7 EXPERIMENTAL EVALUATION
In this section, we evaluate the performance of ALR
regarding different aspects as correctness, perfor-
mance, and explain limitations. We also compare
our results to recent research approaches and present
mentionable findings.
7.1 Scenario
In this experimental scenario, we use a subset of an-
tibody products from our dataset (c.f. Section 6) split
in train and test datasets. The training dataset consists
of ca. 50.000 products from 7 manufacturers with dif-
ferent product types (e.g., ELISA Kits, Primary Anti-
bodies, etc.). The testing dataset contains ca. 25.000
products from 5 manufacturers, which are not present
in the training dataset. Every manufacturer uses an
individual schema for its products ranging from 14
attributes to 65 attributes that shall be integrated into
94 attributes of the integration schema.
We evaluate the performance of our approach by
trying to integrate the product catalogs from the test-
ing set after our model was trained through the train-
ing set. We study the model performance with two
different language features (one-hot word vectors and
combined one-hot sub-word bi- and trigram vectors)
while retaining character features and label similarity
features.
Additionally, we trained the models with three
thresholds (0.0, 0.5, 0.9) that determine target la-
bels from the annotated dataset. A model trained
with a threshold of 0.9 means to only consider al-
most exact matches of attribute representatives be-
tween columns of an input dataset and the associated
integrated dataset during the training phase. Regard-
ing our scenario, the models with a threshold of 0.9
were trained with exact string matches of attribute
representatives only. A model that was trained with
a threshold of 0.5 additionally considers uncertain
string matches in the training phase, while a model
trained without a threshold (0.0) respects every kind
DATA 2020 - 9th International Conference on Data Science, Technology and Applications
96
of similarity between attribute representatives to pre-
dict a target label during training.
For models trained with the thresholds of 0.5 and
0.9, we determine the annotated target labels by trans-
forming the raw annotated label score from the dataset
into a one-hot ground truth vector, where an annota-
tion value greater than 0.5 (0.9) is transformed into
1 and otherwise into 0. A target vector may contain
more than one target label, especially for the thresh-
old of 0.5.
The models trained with a threshold of 0.0 use the
annotated label score as ground truth. This ground
truth is not transformed into a one-hot multi-label
target vector. For the rest of the paper, we refer to
the models as word
t
concerning one-hot word vector
based models, where t is followed by the threshold
used, and ngram
t
respectively if the used model was
trained with sub-word bi- and trigrams.
7.2 General Performance
Before evaluating the applicability of ALR to catalog
integration, we analyze the performance of the model
trained on one-hot word vectors with a threshold of
0.0 by analyzing the Label Ranking Average Preci-
sion (LRAP), which evaluates the average fraction
of labels ranked above a particular label (Tsoumakas
et al., 2010), concerning the label cardinality and
the content type (either BoW or text) on the test-
ing dataset. The label cardinality describes the av-
erage number of labels of the examples in a dataset
(Tsoumakas et al., 2010).
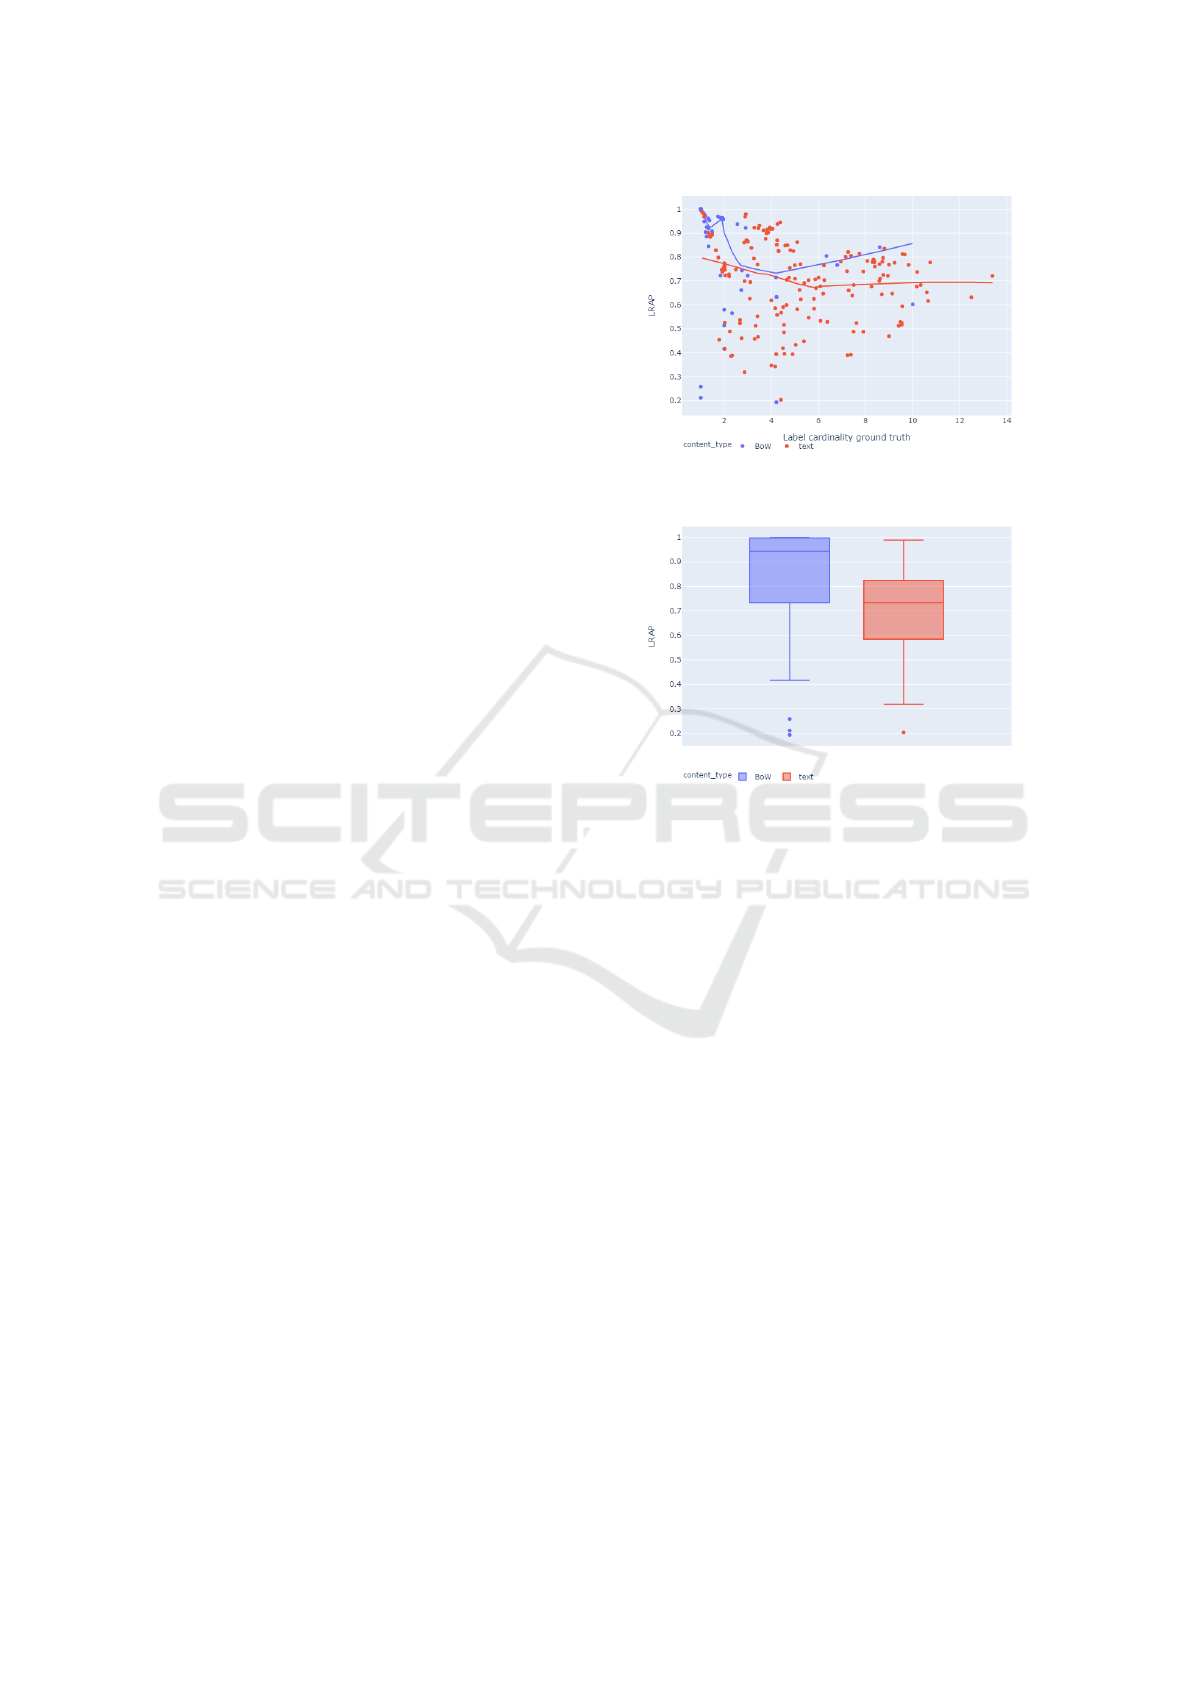
Figure 4 illustrates the influence of the ground
truth label cardinality per target label to the LRAP
score. Most instances of BoW have a cardinality
lower than 4. However, the LRAP significantly drops
after two labels in the examples for BoWs and rises
again after four. The label cardinality of text in-
stances ranges from 1 to 14 with no recognizable fo-
cus. The LRAP drops slowly from 0.8 to 0.7 at six
labels while almost staying constant after more than
six labels. These observations show that most BoW
instances have a clear label ranking, which is learn-
able by the model. On the other hand, label ranking of
text instances seems more challenging to learn. Ad-
ditionally, a higher label cardinality reduces the mod-
els’ performance since there are more labels to learn
combined with the simple structure of the model. Ap-
plying thresholds to the ground truth reduces the label
cardinality – a threshold of 0.5 results in a maximum
ground truth cardinality of 5.
Figure 5 pictures the LRAP concerning the con-
tent type of full columns using the same model as in
Figure 4. Comparing BoW and text attributes, BoW
Figure 4: Model performance concerning the label cardi-
nality. word
t0.0
needs to predict a maximum of 14 labels.
Figure 5: LRAP comparing text and BoW columns for
word
t0.0
.
clearly gains higher LRAP scores with some minor
outliers. These results should also be visible in the
following evaluations.
7.3 Multi-class Evaluation
We evaluate the performance predicting the labels for
complete columns in two different aspects. Firstly,
we measure the Mean Reciprocal Rank (MRR)
(Craswell, 2009) to examine the usability of ALR as
a recommendation engine. We consider a prediction
of ALR as correct if the highest-ranked label of a
column matches the target label of the column since
MRR does not apply to multi-label classifications.
Secondly, we measure precision, recall, and f1-score
concerning the highest-ranked label to compare our
approach with recent research results.
7.3.1 Recommendation Results
Table 3 illustrates the MRR of predictions of ALR
based on the different models from the scenario for
1:1 relations with no modification during the integra-
tion process (target label threshold of 0.9). Therefore,
we precisely know the associated columns.
Catalog Integration of Low-quality Product Data by Attribute Label Ranking
97

Table 3: MRR of ALR with models trained on different
ground truth thresholds on 1:1 relations. Bold font indicates
the best performance.
MRR
all BoW text
Model
word
t0.0
0.7212 0.7678 0.7030
word
t0.5
0.7641 0.7857 0.7558
word
t0.9
0.7075 0.7678 0.6840
ngram
t0.0
0.7679 0.8125 0.7506
ngram
t0.5
0.8208 0.8393 0.8137
ngram
t0.9
0.7467 0.8214 0.7176
Comparing word-based ALR to n-gram-based
ALR, we can see that every ALR based on n-grams
gains higher scores than the corresponding ALR
based on text. The ALR that uses an n-gram model
trained with a threshold of 0.5 performs best in all
categories. It reaches an MRR of 0.8208 overall
while performing better on BoW (0.8393) than on text
(0.8137).
The other configurations show a similar charac-
teristic: In general, the performance on BoW is better
than on text. Additionally, the gap between BoW and
text of the ALR based on ngram
t0.5
is significantly
smaller than other approaches except for text
t0.5
. Con-
sidering word and n-gram-based ALRs individually,
models trained with a threshold of 0.5 perform best
in each category. We can explain the better perfor-
mance of n-gram based ALRs by vocabulary misses
and low quality of attribute representatives. For in-
stance, the word vocabulary does not contain 96test
due to the missing whitespace. If the whole column
contains only unknown words, a word-based model
possibly cannot predict a target label if other features
are not significant as well. An n-gram-based approach
at least gets partial matches if the vocabulary contains
the trigrams of test (tes, est).
Although our scenario and the dataset is not fully
comparable to the datasets Pomp et al. evaluated their
approach with, our results for the MRR indicate that
we perform in the same range of MRR scores overall
(Pomp et al., 2019). They report maximum MRRs for
BoW of 0.783 (soccer dataset) and 0.764 (museum
dataset), we reach a maximum value of 0.839. Con-
cerning text attributes, their approach varies depend-
ing on the dataset from 0.783 (museum) up to 0.983
(soccer). With the consideration that the museum
dataset contains more complex data than the soccer
dataset, we perform at least on even on complex and
low-quality data.
7.3.2 Classification Results
To evaluate the classification results of ALR, we used
the same setup as for the recommendations. We again
consider 1:1 relations with no modification during the
integration process (target label threshold of 0.9) and
treat the predicted label with the highest rank as a
classification result. We take columns, where ALR
could not make a prediction, into account as false neg-
atives. Therefore, unpredicted columns modify recall
and f1-score but not the precision.
Table 4 shows the classification performance of
ALR depending on the model used and the attribute
class. The overall precision score of ALR remains
over 0.8 for all models, reaching the maximum
(bold) of 0.893 with the word
t0.5
model, followed by
ngram
t0.5
(0.8766) and word
t0.9
(0.8735). Addition-
ally, ngram
t0.5
achieves the highest recall (0.805) and
f1-score (0.8393) followed by word
t0.5
with a recall
of 0.75 and an f1-score of 0.8153.
Concerning the performance of BoW attribute
representatives, all approaches gain precision scores
of higher (or equal) than 0.9. Again word
t0.5
achieves
the highest precision (0.9778). Contrary to the overall
performance, word-based models work significantly
better than n-gram-based models concerning the pre-
cision, while the f1-score is almost on even for all
models (maximum of 0.8713 for word
t0.5
). N-gram-
based models constantly achieve a recall of 0.8 or bet-
ter outperforming word-based models again, where
ngram
t0.5
reaches the highest value of 0.8393.
Chen et al. report a micro f-score of 0.23 or 0.20
for strings depending on the features used (Chen et al.,
2018). ALR outperforms their approaches by at least
0.5. This result shows the effectiveness of using sub-
word bi- and trigrams or words instead of character
unigrams for strings.
Even if we consider uncertain 1:1 integrations,
where we do not exactly know which columns were
matched during the integration process due to am-
biguousness, ALR almost perseveres its precision
(c.f. Table 5). Both models trained on a threshold of
0.5 still perform well. As before, ALR with ngram
t0.5
achieves higher recall scores than the word
t0.5
. How-
ever, Table 5 shows that the achieved recall scores
drop by at least 0.1 for n-grams (0.8 to 0.69, 0.84 to
0.7, 0.79 to 0.68, rounded). word
t0.5
achieves higher
precision scores except for text, where n-grams out-
perform other approaches. Nevertheless, the loss in
precision of word
t0.5
is relatively small (0.89 to 0.87,
0.98 to 0.98, 0.87 to 0.85, rounded). The range of this
loss applies to n-gram-based ALR as well. The results
on the f-scores show again that ALR outperforms the
approach of Chen et al. on strings by at least 0.5.
DATA 2020 - 9th International Conference on Data Science, Technology and Applications
98

Table 4: Multi-class classification weighted avg. performance of ALR considering 1:1 relations of exact string matches
between input and integrated files. Bold font indicates the best performance.
all BoW text
precision recall f1 precision recall f1 precision recall f1
Model
word
t0.0
0.8130 0.6750 0.7376 0.9773 0.7679 0.8600 0.7585 0.6389 0.6936
word
t0.5
0.8930 0.7500 0.8153 0.9778 0.7857 0.8713 0.8681 0.7361 0.7967
word
t0.9
0.8735 0.7050 0.7803 0.9356 0.7679 0.8434 0.8543 0.6806 0.7576
ngram
t0.0
0.8368 0.7400 0.7854 0.9320 0.8036 0.8631 0.8186 0.7153 0.7635
ngram
t0.5
0.8766 0.8050 0.8393 0.9020 0.8393 0.8695 0.8992 0.7917 0.8420
ngram
t0.9
0.8595 0.7014 0.7724 0.9000 0.8214 0.8589 0.8681 0.7014 0.7759
Table 5: Multi-class classification weighted avg. performance of ALR considering 1:1 relations and uncertain matches be-
tween input and integrated files. Bold font indicates the best performance.
all BoW text
precision recall f1 precision recall f1 precision recall f1
Model
word
t0.5
0.8652 0.6320 0.7304 0.9787 0.6301 0.7666 0.8509 0.6327 0.7258
ngram
t0.5
0.8418 0.6877 0.7570 0.8098 0.6986 0.7501 0.8733 0.6837 0.7669
7.4 Multi-label Evaluation
ALR is not only able to predict the primary label for
a column, but it also aims to detect as many labels as
possible to identify possibly ambiguous columns. For
instance, a product name often contains more infor-
mation. In Figure 1, the product’s name contains in-
formation about the reactivity, quantity, and the clone
of the product. If these data miss in other columns,
practitioners need an indication, where they can find
these data. Consequently, ALR predicts 1:n relations
for uncertain matches.
We evaluate the performance considering multi-
label classification by evaluating the Area Under the
Receiver Operating Characteristic Curve (AUROC)
score (Hand and Till, 2001). The AUROC score
describes a models’ ability to distinguish between
classes. A score of 1.0 means that the model cor-
rectly identifies all classes. On the opposite, a model
achieving a score of 0.5 is not capable of separating
the classes.
Table 6 describes the ability of ALR based on dif-
ferent models to distinguish between classes, which
Table 6: Weighted mean AUROC of ALR for multi-label
classification. Bold font indicates the best performane.
AUROC
all BoW text
Model
word
t0.0
0.7324 0.6910 0.7400
word
t0.5
0.7105 0.6807 0.7190
ngram
t0.0
0.7271 0.7129 0.7304
ngram
t0.5
0.7464 0.7071 0.7571
are the different target labels in our case. ALR
based on ngram
t0.5
overall achieves the best results
with an AUROC of 0.7464. Additionally, it gains
the highest result on text (0.7571). Considering
BoW ngram
t0.0
(0.7129) performs slightly better than
ngram
t0.5
(0.7071). These results show that ALR can-
not perfectly distinguish different labels but can do
so for most of them. While analyzing the results in
more detail, we found some classes that could not
be separated at all (Antigen, Characteristic, Epitope,
Principle, proteinType, reactivityPredicted), lowering
the average score. Those classes need further inves-
tigation in future approaches. Furthermore, we could
identify ambiguous classes, which humans may con-
fuse as well without deep expert knowledge (Stor-
age, storageComment, storageShipping). However,
the majority of investigated target labels achieve re-
sults close to 1.
7.5 Limitations
The major limitation of ALR is relying entirely on
single columns, not taking co-occurrences of input la-
bels and context of the product into account to handle
ambiguous predictions. Hence, an imbalanced dataset
may restrict our evaluation. Besides to unbalanced
target labels, columns contain duplicates, especially
attribute representatives from BoW. Additionally, our
dataset includes a wide range of attributes and prod-
ucts (c.f. Table 2), but only a limited amount of dif-
ferent manufacturers.
We designed ALR to also work with low-quality
data, which our real-world dataset requires: The qual-
Catalog Integration of Low-quality Product Data by Attribute Label Ranking
99

ity varies from clean data to attribute representa-
tives without whitespaces (e.g., 96test instead of 96
test), representatives with misspellings or worse, rep-
resentatives containing encoding errors and arbitrary
strings or numbers (e.g., ™ instead of
™
, ug in-
stead of µg). These quality issues may negatively af-
fect the presented results due to uncertain matches in
the ground-truth data and more frequent out of vocab-
ulary errors. Out of vocabulary issues are the most
common reason for ALR not predicting a target label.
Another limitation of ALR is depending on a fixed
schema: All products need the same context or do-
main to apply ALR since we only learn a single target
schema. Therefore, we need to retrain the model if
the target schema changes. However, changes in the
target schema are rare, considering SMEs.
7.6 Experiences of Practitioners
We integrated a research prototype into the production
systems of our partner as a recommendation engine.
We applied this strategy because, according to inter-
views with our partners and reviews of their use case,
a single wrong, fully automatic prediction in the pro-
duction system would lead to mistrust. Furthermore,
an unrecognized false prediction might cause incor-
rect product data displayed to customers. According
to the results of our evaluation, the risk is too high.
We applied ALR with ngram
t0.5
due to its perfor-
mance in MRR in our evaluation. Despite not being
able to (always correctly) predict every label, ALR
reduced the manual effort from minutes to seconds
if the correct prediction occurred in the top 3 labels,
which is the case in 86%. This feedback validates the
economic benefit of ALR in practice.
8 CONCLUSION
The results of our evaluation show that ALR outper-
forms the approach of Chen et al., and ALR at least
performs on even compared to Pomp et al., with bet-
ter results on BoW attribute representatives. Further-
more, we verified the better performance of language
features compared to character and column distribu-
tion features for catalog integration.
Although we used simple language features (one-
hot vectors), we were able to produce results on low-
quality data that impact and simplify the daily busi-
ness of practitioners. Using sophisticated embed-
dings instead of one-hot vectors could further improve
our results as they did in natural language processing
(NLP) tasks like named entity recognition (NER). It
has to be considered that these embeddings need to be
specialized in the catalog domain.
Due to the imbalanced labels and attribute in-
stances of the dataset used, further research needs to
investigate the performance on other datasets or eval-
uate ALR over a more extended period in production
systems with feedback from practitioners and analy-
sis of their manual corrections. To adapt ALR onto
other domains, a model needs to learn from an inte-
gration dataset, which contains at least attribute repre-
sentatives with corresponding target labels of a fixed
schema. Since log files of integration processes con-
tain these data, adapting ALR to another domain is
simple.
Finally, future research should address the major
limitation of ALR: Since ALR relies only on single
columns, it does not take co-occurrences of labels into
account to handle ambiguous labels. Handling these
labels could further extend the use case of ALR.
ACKNOWLEDGEMENTS
This work was supported by the German Federal
Ministry for Economic Affairs and Energy (BMWi)
within the Central Innovation Programme for SMEs
(grant no. 16KN063729) and antibodies-online.com.
5
REFERENCES
Anam, S., Kim, Y. S., Kang, B. H., and Liu, Q. (2016).
Adapting a knowledge-based schema matching sys-
tem for ontology mapping. In Proceedings of the Aus-
tralasian Computer Science Week Multiconference,
ACSW ’16, pages 1–10, Canberra, Australia. Asso-
ciation for Computing Machinery.
Aumueller, D., Do, H.-H., Massmann, S., and Rahm,
E. (2005). Schema and ontology matching with
COMA++. In Proceedings of the 2005 ACM SIG-
MOD international conference on Management of
data, pages 906–908. Acm.
Bernstein, P. A., Madhavan, J., and Rahm, E. (2011).
Generic schema matching, ten years later. Proceed-
ings of the VLDB Endowment, 4(11):695–701.
Bizer, C., Primpeli, A., and Peeters, R. (2019). Us-
ing the Semantic Web as a Source of Training Data.
Datenbank-Spektrum, 19(2):127–135.
Chen, Z., Jia, H., Heflin, J., and Davison, B. D. (2018).
Generating Schema Labels Through Dataset Content
Analysis. In Companion Proceedings of the The Web
Conference 2018, WWW ’18, pages 1515–1522, Re-
public and Canton of Geneva, Switzerland. Interna-
tional World Wide Web Conferences Steering Com-
mittee.
5
https://www.antibodies-online.com
DATA 2020 - 9th International Conference on Data Science, Technology and Applications
100

Comito, C., Patarin, S., and Talia, D. (2006). A Seman-
tic Overlay Network for P2P Schema-Based Data In-
tegration. In 11th IEEE Symposium on Computers
and Communications (ISCC’06), pages 88–94. ISSN:
1530-1346.
Craswell, N. (2009). Mean reciprocal rank. Encyclopedia
of database systems, 1703.
de Carvalho, M. G., Laender, A. H., Gonc¸alves, M. A.,
and da Silva, A. S. (2013). An evolutionary approach
to complex schema matching. Information Systems,
38(3):302–316.
Dessloch, S., Hernandez, M. A., Wisnesky, R., Radwan,
A., and Zhou, J. (2008). Orchid: Integrating Schema
Mapping and ETL. In 2008 IEEE 24th International
Conference on Data Engineering, pages 1307–1316.
Foley, J., Bendersky, M., and Josifovski, V. (2015). Learn-
ing to Extract Local Events from the Web. In Pro-
ceedings of the 38th International ACM SIGIR Con-
ference on Research and Development in Information
Retrieval, SIGIR ’15, pages 423–432, New York, NY,
USA. ACM. event-place: Santiago, Chile.
Gu, B., Li, Z., Zhang, X., Liu, A., Liu, G., Zheng, K., Zhao,
L., and Zhou, X. (2017). The Interaction Between
Schema Matching and Record Matching in Data Inte-
gration. IEEE Transactions on Knowledge and Data
Engineering, 29(1):186–199.
Hand, D. J. and Till, R. J. (2001). A simple generalisation of
the area under the roc curve for multiple class classi-
fication problems. Machine learning, 45(2):171–186.
Joulin, A., Grave, E., Bojanowski, P., and Mikolov, T.
(2016). Bag of tricks for efficient text classification.
CoRR, abs/1607.01759.
Kirsten, T., Thor, A., and Rahm, E. (2007). Instance-
Based Matching of Large Life Science Ontologies. In
Cohen-Boulakia, S. and Tannen, V., editors, Data In-
tegration in the Life Sciences, Lecture Notes in Com-
puter Science, pages 172–187, Berlin, Heidelberg.
Springer.
Madhavan, J., Bernstein, P. A., and Rahm, E. (2001).
Generic schema matching with cupid. In vldb, vol-
ume 1, pages 49–58.
Nam, J., Kim, J., Loza Menc
´
ıa, E., Gurevych, I., and
F
¨
urnkranz, J. (2014). Large-scale multi-label text
classification — revisiting neural networks. In
Calders, T., Esposito, F., H
¨
ullermeier, E., and Meo,
R., editors, Machine Learning and Knowledge Dis-
covery in Databases, pages 437–452, Berlin, Heidel-
berg. Springer Berlin Heidelberg.
Neumann, M., King, D., Beltagy, I., and Ammar, W. (2019).
ScispaCy: Fast and Robust Models for Biomedical
Natural Language Processing. In BioNLP@ACL.
Paulus, A., Pomp, A., Poth, L., Lipp, J., and Meisen, T.
(2018). Gathering and Combining Semantic Concepts
from Multiple Knowledge Bases:. In Proceedings of
the 20th International Conference on Enterprise In-
formation Systems, pages 69–80, Funchal, Madeira,
Portugal. SCITEPRESS - Science and Technology
Publications.
Pham, M., Alse, S., Knoblock, C. A., and Szekely, P.
(2016). Semantic Labeling: A Domain-Independent
Approach. In Groth, P., Simperl, E., Gray, A., Sabou,
M., Kr
¨
otzsch, M., Lecue, F., Fl
¨
ock, F., and Gil, Y., ed-
itors, The Semantic Web – ISWC 2016, Lecture Notes
in Computer Science, pages 446–462, Cham. Springer
International Publishing.
Pomp, A., Poth, L., Kraus, V., and Meisen, T. (2019).
Enhancing Knowledge Graphs with Data Representa-
tives:. In Proceedings of the 21st International Con-
ference on Enterprise Information Systems, pages 49–
60, Heraklion, Crete, Greece. SCITEPRESS - Science
and Technology Publications.
Ristoski, P., Petrovski, P., Mika, P., and Paulheim, H.
(2018). A machine learning approach for prod-
uct matching and categorization. Semantic Web,
9(5):707–728.
Schmidts, O., Kraft, B., Siebigteroth, I., and Z
¨
undorf, A.
(2019). Schema Matching with Frequent Changes
on Semi-Structured Input Files: A Machine Learning
Approach on Biological Product Data. In Proceedings
of the 21st International Conference on Enterprise In-
formation Systems, pages 208–215, Heraklion, Crete,
Greece. SCITEPRESS - Science and Technology Pub-
lications.
Shvaiko, P. and Euzenat, J. (2005). A Survey of Schema-
Based Matching Approaches. In Spaccapietra, S., ed-
itor, Journal on Data Semantics IV, Lecture Notes in
Computer Science, pages 146–171. Springer Berlin
Heidelberg.
Tsoumakas, G., Katakis, I., and Vlahavas, I. (2010). Mining
Multi-label Data. In Maimon, O. and Rokach, L., ed-
itors, Data Mining and Knowledge Discovery Hand-
book, pages 667–685. Springer US, Boston, MA.
Catalog Integration of Low-quality Product Data by Attribute Label Ranking
101
